|
Recap
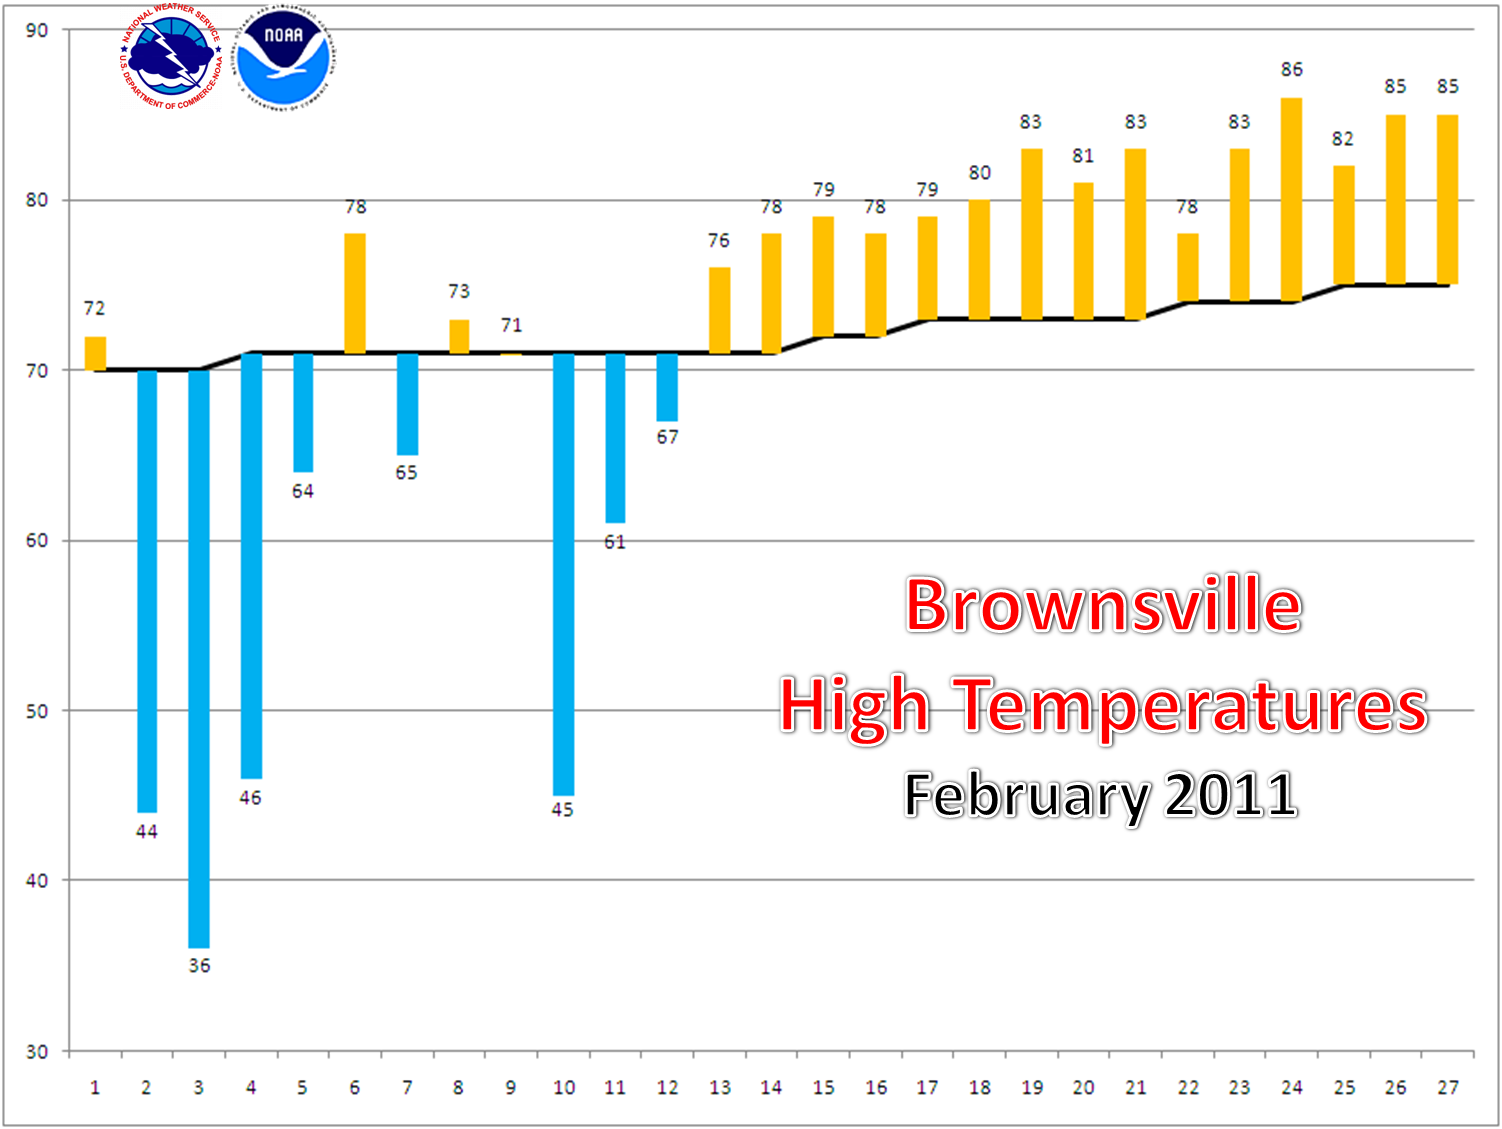
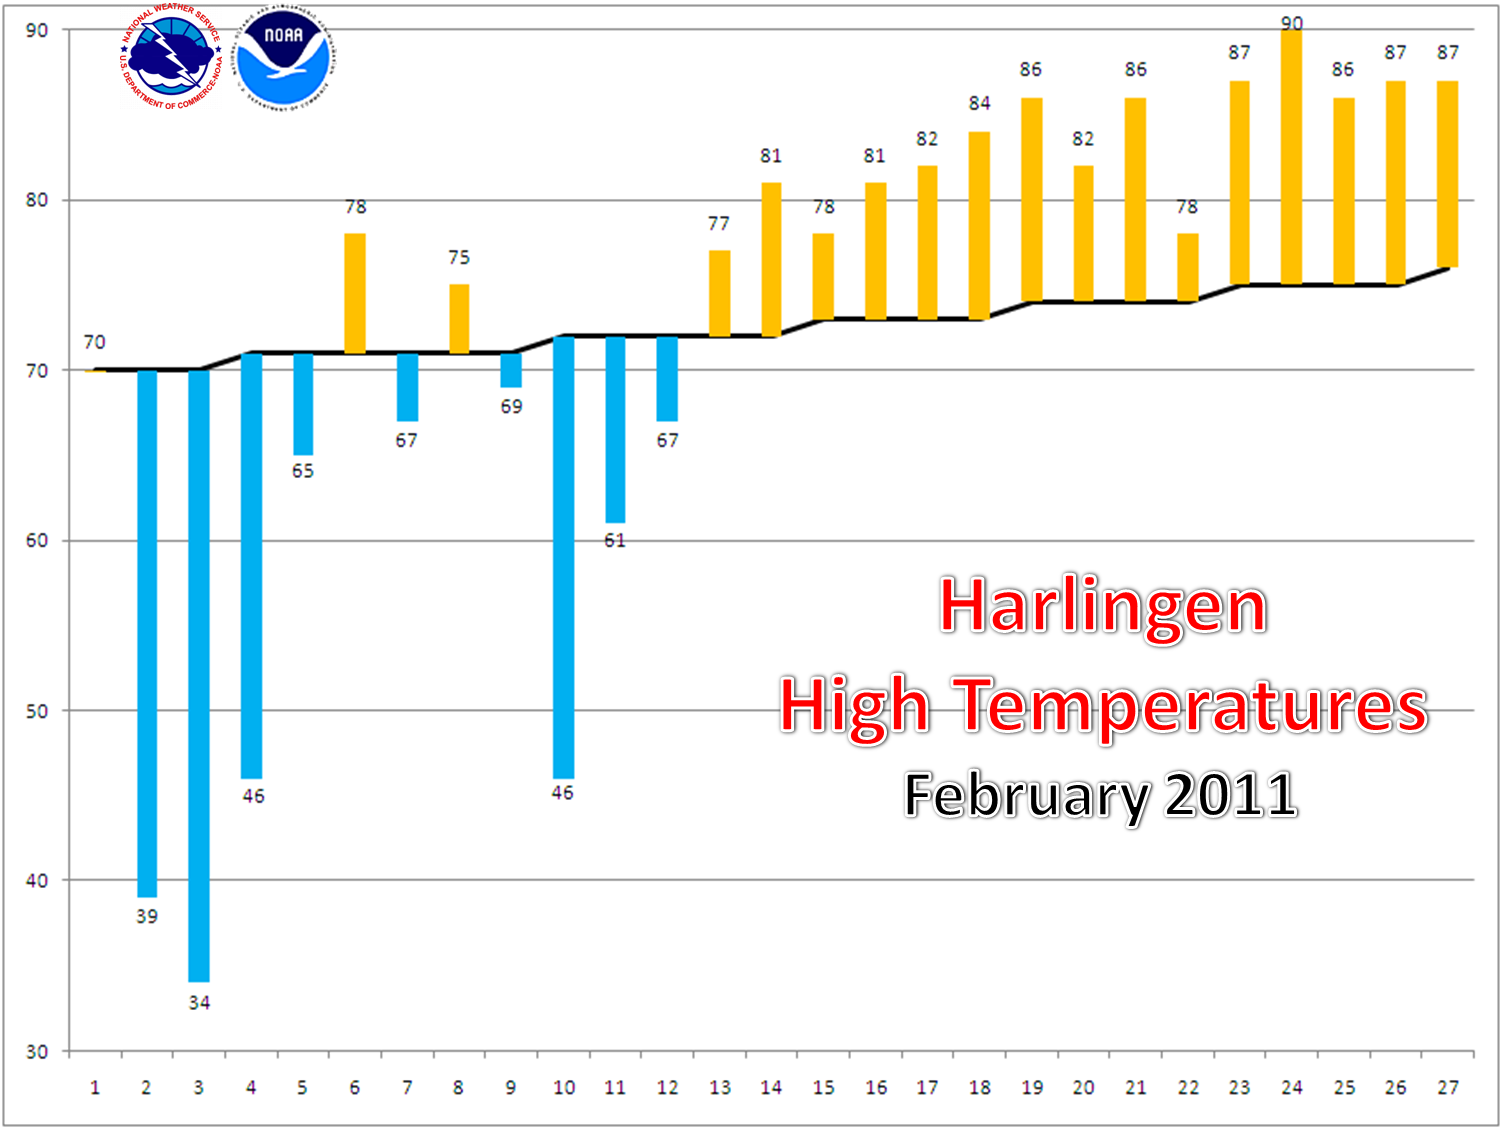
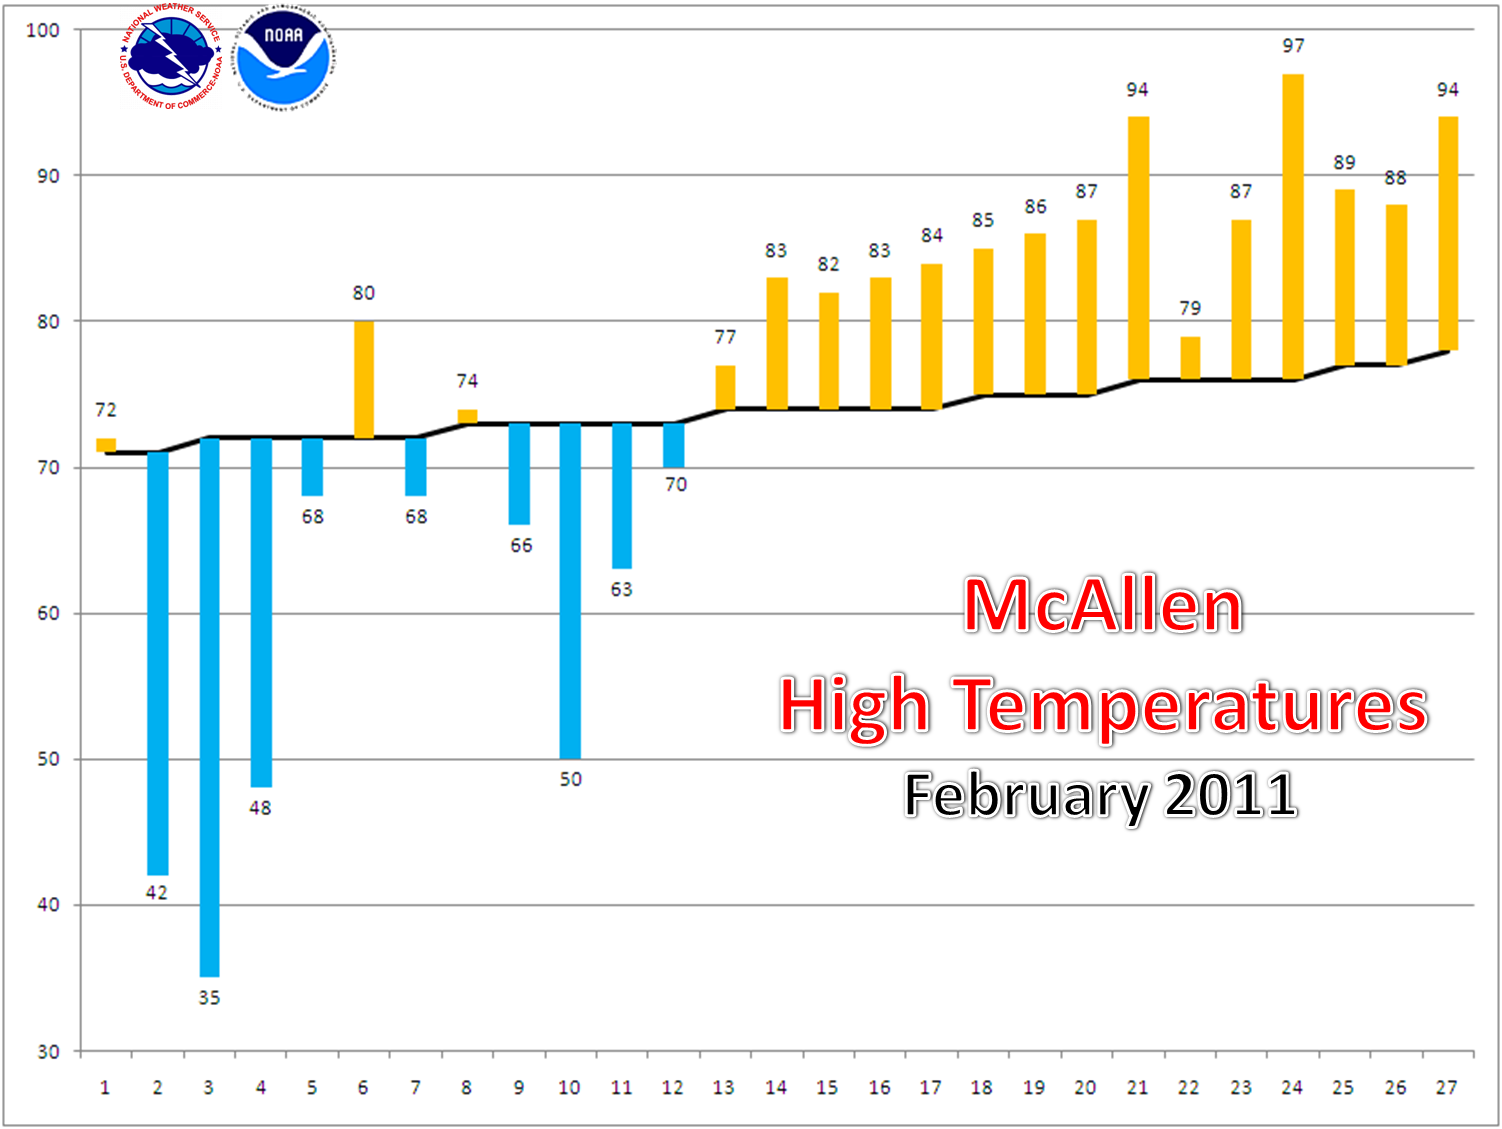
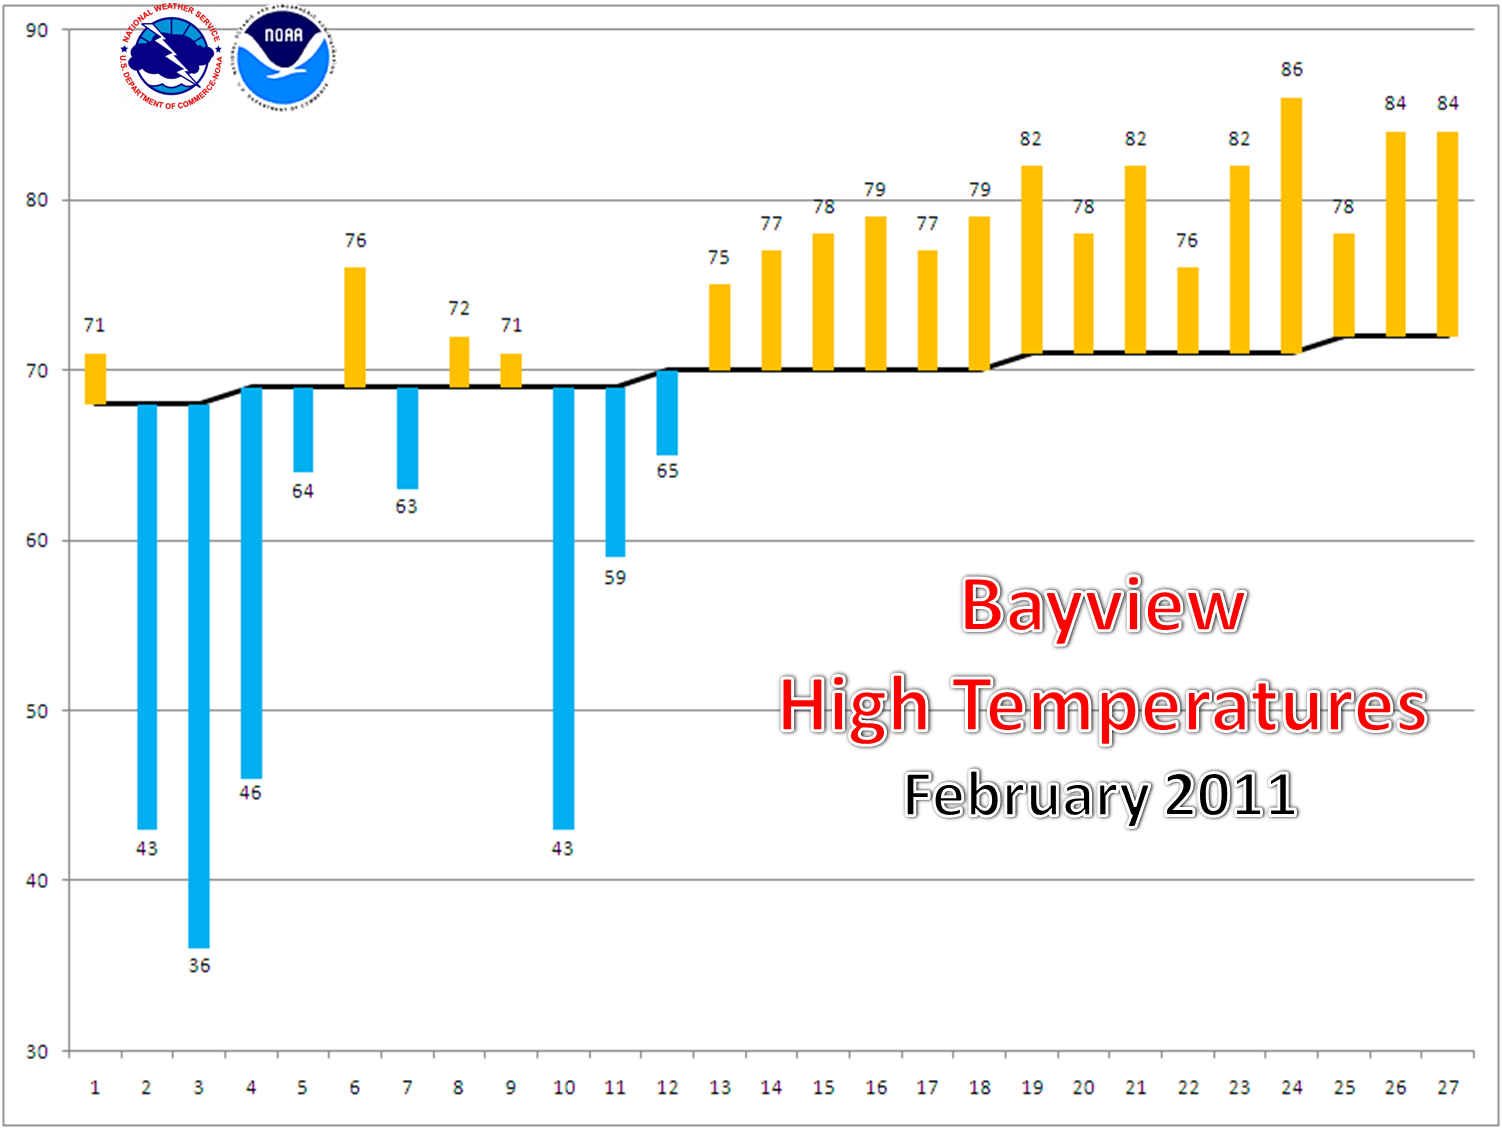
Rio Grande Valley residents were certainly talking about the wild swings in the weather that February 2011 brought to the area. From a rather nasty cold snap and ice storm between February 2nd and 5th, followed closely on its heels by another shot of cold between February 9th and 11th. By February 14th, temperatures across the region were some 10 to 15°F below average, making many wonder if a new "ice age" was upon Texas. And then...
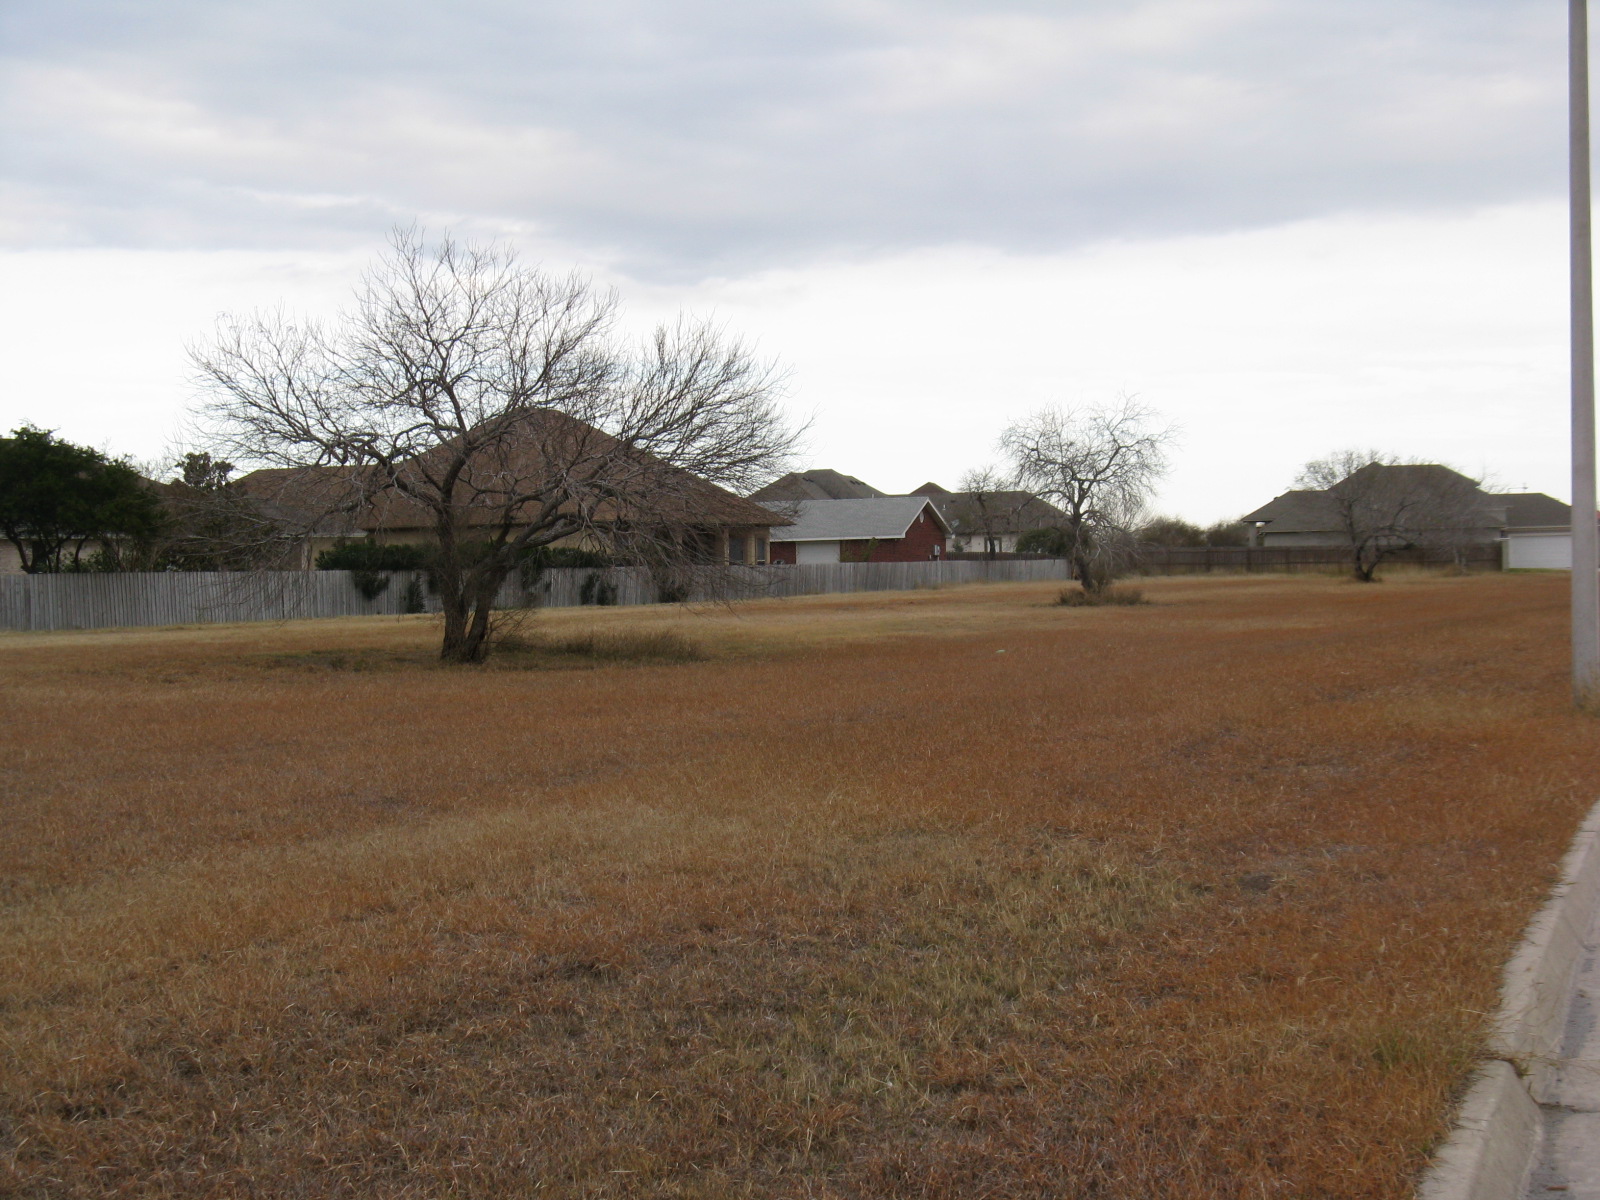
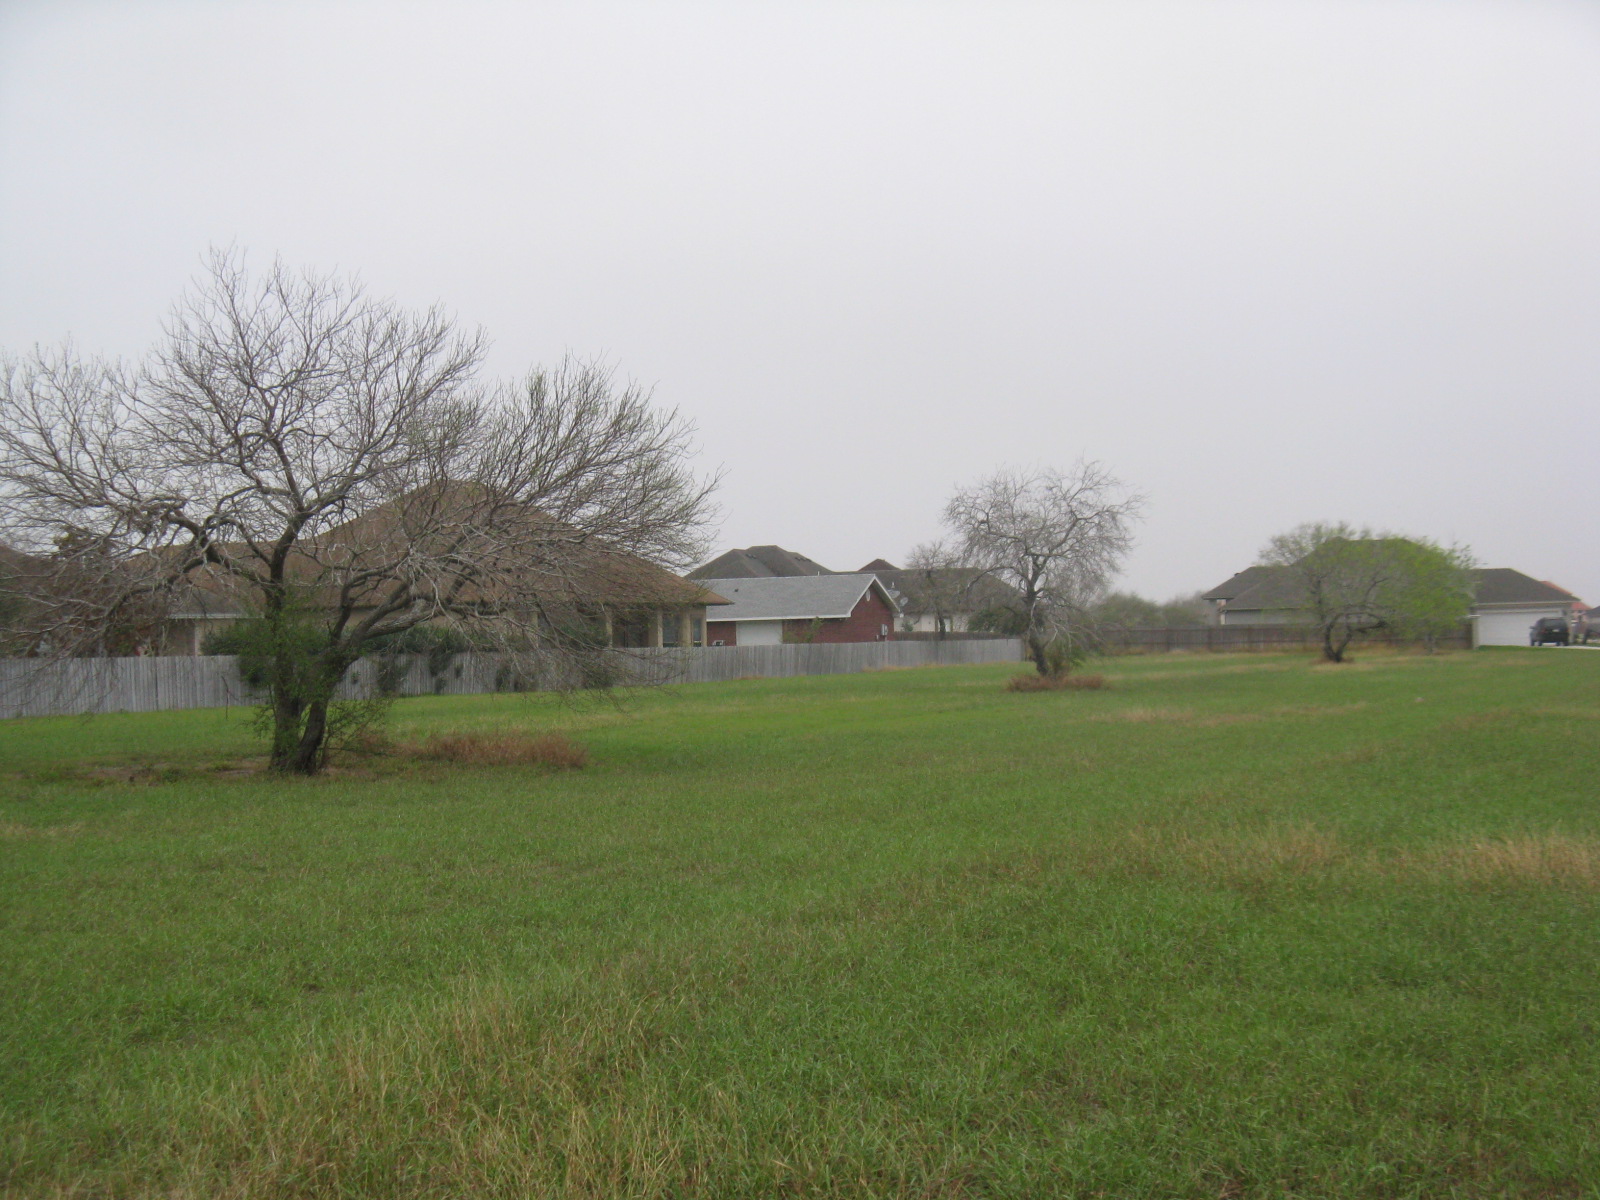
...Everything turned. Valentine’s Day came in sweet and sunny, with temperatures poking above 80°F away from the coast. Springlike temperatures had arrived, and humidity would follow, especially near the coast. Prolonged and pronounced southeast winds, often gusting to 40 mph or higher during the afternoon, brought warm days and muggy nights to the Lower Valley. Weak troughs edging across the Rio Grande Plains into the central Valley poked high temperatures to summer like levels from Brooks and Hidalgo Counties westward, culminating in the first century mark (100°F) maximum values on February 27th in Zapata and Starr County. For the coastal counties of Cameron, Willacy, and Kenedy, the muggy nights combined with enough soaking rainfall in mid January to turn brown lands green (above right). No such luck farther west, where rainfall of less than 2 inches since late September 2010 combined with a number of hot and dry afternoons to maintain highly cured vegetation, particularly along and west of Highway 281. By month’s end, temperatures recovered back to a value that matched the long term climatological average for February. The sharpness of the U–turn from much below average to well above average is shown in the following table:
Temperature Trends for Harlingen/Valley Intl. Airport, February 2011
|
Day
|
High
|
Low
|
Average
|
Departure
|
Heating Deg. Days
|
Cooling Deg. Days
|
|
1
|
72
|
44
|
58
|
-3
|
7
|
0
|
|
2
|
44
|
32
|
38
|
-23
|
27
|
0
|
|
3
|
36
|
28
|
32
|
-29
|
33
|
0
|
|
4
|
46
|
29
|
38
|
-23
|
27
|
0
|
|
5
|
64
|
31
|
48
|
-13
|
17
|
0
|
|
6
|
78
|
43
|
61
|
0
|
4
|
0
|
|
7
|
65
|
43
|
54
|
-7
|
11
|
0
|
|
8
|
73
|
42
|
58
|
-4
|
7
|
0
|
|
9
|
71
|
40
|
56
|
-6
|
9
|
0
|
|
10
|
45
|
32
|
39
|
-23
|
26
|
0
|
|
11
|
61
|
36
|
49
|
-13
|
16
|
0
|
|
12
|
67
|
42
|
55
|
-7
|
10
|
0
|
|
13
|
76
|
42
|
59
|
-3
|
6
|
0
|
|
14
|
78
|
55
|
67
|
5
|
0
|
2
|
|
15
|
79
|
65
|
72
|
9
|
0
|
7
|
|
16
|
78
|
62
|
70
|
7
|
0
|
5
|
|
17
|
79
|
67
|
73
|
10
|
0
|
8
|
|
18
|
80
|
67
|
74
|
11
|
0
|
9
|
|
19
|
83
|
68
|
76
|
13
|
0
|
11
|
|
20
|
81
|
68
|
74
|
10
|
0
|
10
|
|
21
|
83
|
68
|
76
|
12
|
0
|
11
|
|
22
|
78
|
69
|
74
|
10
|
0
|
9
|
|
23
|
83
|
69
|
76
|
12
|
0
|
11
|
|
24
|
86
|
71
|
79
|
15
|
0
|
14
|
|
25
|
82
|
68
|
75
|
10
|
0
|
10
|
|
26
|
85
|
71
|
78
|
13
|
0
|
13
|
|
27
|
85
|
72
|
79
|
14
|
0
|
14
|
|
28
|
90
|
61
|
76
|
11
|
0
|
11
|
|
Avg/Total
|
72.4
|
53.0
|
62.7
|
0.0
|
200
|
145
|
Heating Degrees: Difference between 65°F and Average Temperature when the Average Temperature is <65°F. Cooling Degrees: Difference between 65°F and Average Temperature when the Average Temperature is >65°F. Heating and Cooling Degree Days generally describe the energy demand for a typical home or business.
Reasons
Why was there such a sharp change in the atmospheric pattern, shown below? For one, it is February in the near tropics at or near sea level, and increasing sun angle helps temperatures begin the climb toward warmer conditions common at this latitude. Second, La Niña has been known to produce marked temperature swings during early to mid spring in the past, and 2011 thus far has been no exception. La Niña springs are typically warm and dry; a propensity to lean toward this pattern is expected between February and April. Finally, the atmospheric teleconnection known as the Arctic Oscillation (AO) may have played the largest role. The negative phase of the AO, combined with a moderate to strong La Niña in winter leads to cold weather across the eastern half of North America. The positive phase of the AO tends to favor warmer weather across the eastern half of North America. Often, during a long period of either phase, there is a bit of lag, up to two weeks, between actual weather on the ground and the observed phase when a pronounced change develops. From November through the end of January, the negative phase of the AO was dominant; hence, winter temperatures cooled in the eastern half of the U.S. and Texas, on the western edge, experienced a number of chilling fronts. As the phase shifted positive, the bottom dropped out of temperatures across the central and eastern U.S. in early February. Within a week of the cold, conditions recovered rapidly, with seasonable to above average conditions returning to many areas from the Great Plains eastward for the latter half of February. Click here for the November through February trend.
|
Height of the 500 mb pressure surface, 6 AM CST February 10th, 2011. Note the broad and generally high amplitude of the cold vortex, extending from the Arctic regions into the southern U.S. |
Height of the 500 mb pressure surface, 6 AM CST February 24th, 2011. Note the change in the pattern, with a broad ridge extending from the Texas coast through the Gulf of America including the Deep South. Also, note the more west to east flow across the central U.S., with the cold vortex retracted toward the Arctic. |

