|
Overview
As the 2011 Atlantic Hurricane Season winds to a close, many in North America are breathing a sigh of relief once again. While the number of cyclones, hurricanes, and major hurricanes was enough to put fear into coastal residents from the Virgin Islands to the Canadian Maritimes, steering patterns, persistent wind shear, and recalcitrant dry air high in the atmosphere reduced the potential impact that might have been had steering currents favored more landfalls, and deep atmospheric moisture been readily available. Media coverage may focus on a busy season that was missing in action; however, unlike 2010, when major population centers around the United States Gulf and Eastern Seaboard saw virtually no impact, Hurricane Irene (late August) kept the eastern megalopolis from Philadelphia to Boston on its toes. Click here for a satellite time lapse of the 2011 season.
Irene will be remembered in different ways depending on location. From the Jersey Shore through New York City, Irene was a wake–up call to preparedness and potential danger, while it did not live up to the "hype" for many residents" expectations. For residents of the Outer Banks of North Carolina, it was a stronger version of 2010’s Earl, causing a bit of damage similar to other storms in the past twenty years. For the mountains of New Jersey, New York, and Vermont, Irene will be long remembered for devastating flash and river flooding. The majority of the $10 billion in damage was related to the floods. After Irene, only Tropical Storm Lee caused trouble, focusing flooding rains and damage along the Louisiana Gulf Coast. Remnants of Lee, absorbed into an atmospheric trough of low pressure, produced a significant flood across New York and Pennsylvania, where summer rains had saturated the ground.
|
Rio Grande Valley: Close, but no Cigar
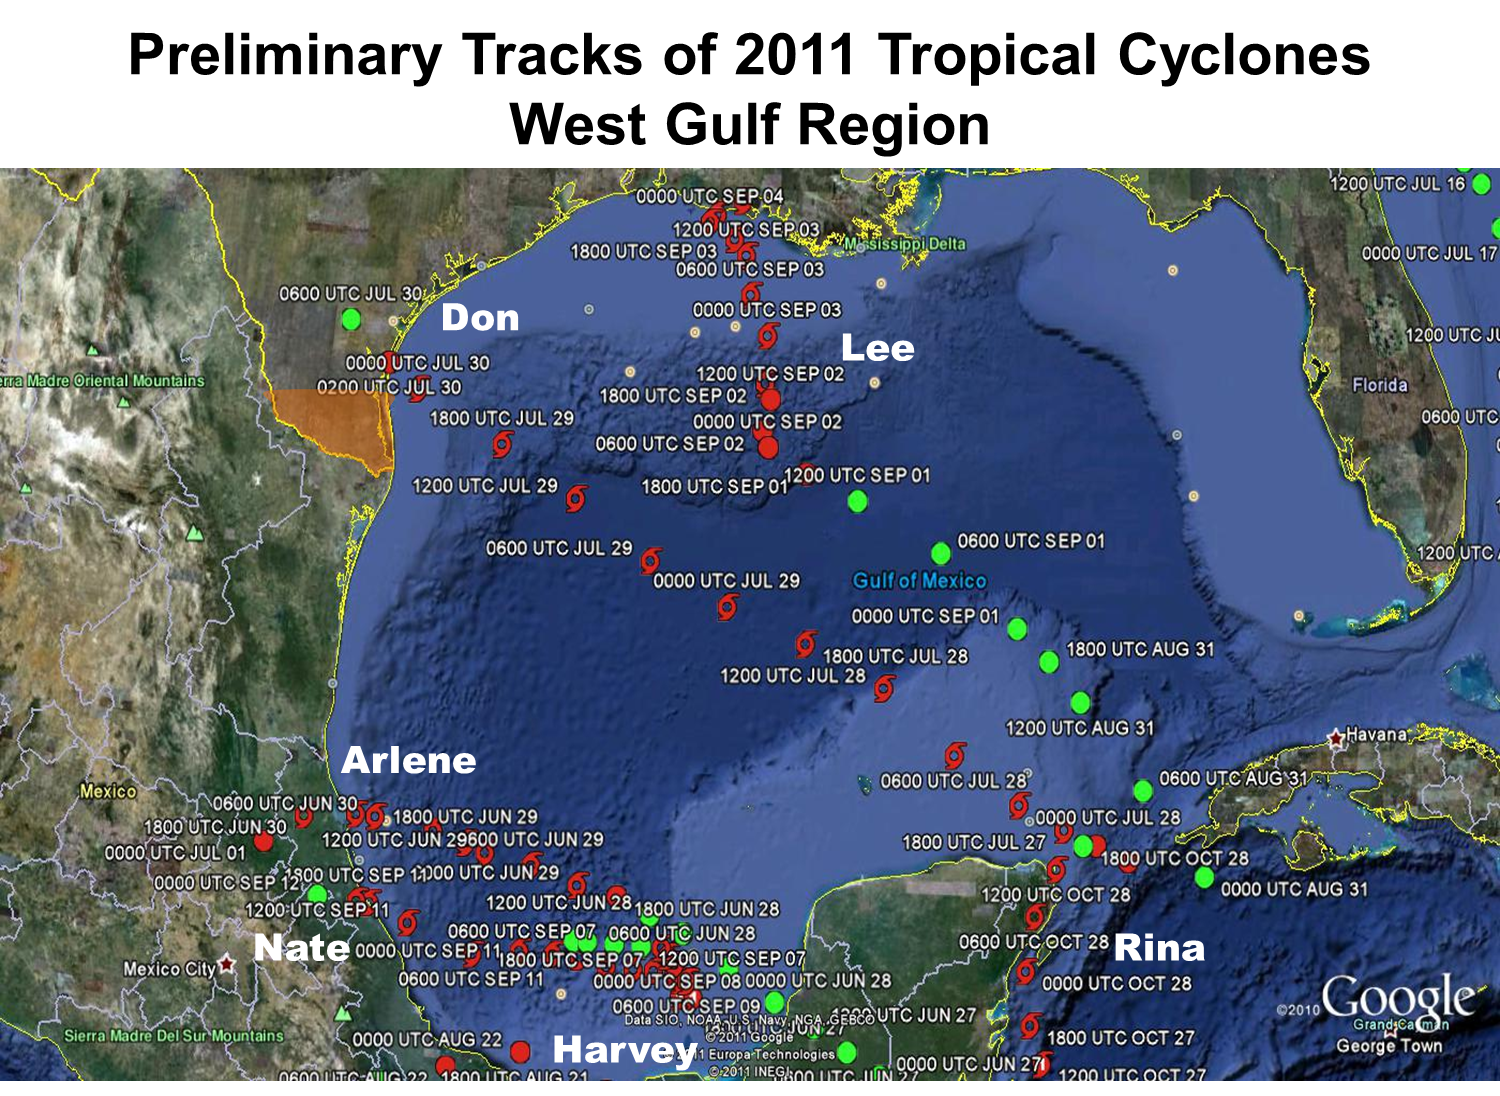
Record Water Year (2011) drought was guaranteed when the potential for significant rainfall dried up, literally, in persistent northwest to west flow bringing dry air from the Southwest U.S. and northern Mexican desert regions, around the La Canícula ("Dog Days") high pressure ridge. While a number of cyclones threatened the western Gulf, only Nate (mid September) was able to reach hurricane status. The season began with some promise, as a strengthening Tropical Storm Arlene brought bands of rainfall totalling between 1.5 and nearly 3 inches to the Lower RGV on June 30th. Later that afternoon, spin from the decaying cyclone may have contributed to a rotating thunderstorm which briefly dropped an EF–1 tornado between Pharr and Hidalgo. A month later, Tropical Storm Don fizzled into what some called "Tropical Storm ‘Dud’", bringing around inch of rain along the coast but nothing to the mid and upper Valley.
Tropical Storm Lee (Labor Day Weekend) and Hurricane Nate (September 8/9) not only missed the Valley, but dry air to the west and north of each storm exacerbated the drought through stifling heat and lower humidity. Lee brought triple digit record heat to the coast; Nate was shoved south of Tampico by the persistent ridge, leaving the Valley high and dry once again.
|
|
Fast Facts
- NOAA’s May 2011 Hurricane Outlook forecast 12 to 18 named storms, 6 to 10 hurricanes, 3 to 6 major hurricanes, and an Accumulated Cyclone Energy (ACE) Index Range of 105 percent to 200 percent of average. The preliminary results so far:
- 12 tropical storms.
- 7 hurricanes.
- 3 major hurricanes.
- ACE estimate: 119 percent of average
- The combination of high upper oceanic heat content across much of the basin, and a neutral El Niño rapidly returning to a weak La Niña in the eastern tropical Pacific, were important reasons for the large number of cyclones.
- The season got off to a very slow start. At one point, the Atlantic basin had five named tropical storms while the Eastern Pacific basin had five named hurricanes. In fact, the first eight storms (Arlene through Harvey) failed to reach hurricane status for the first time since records began in 1851. On the other hand, five of the final six cyclones were hurricanes.
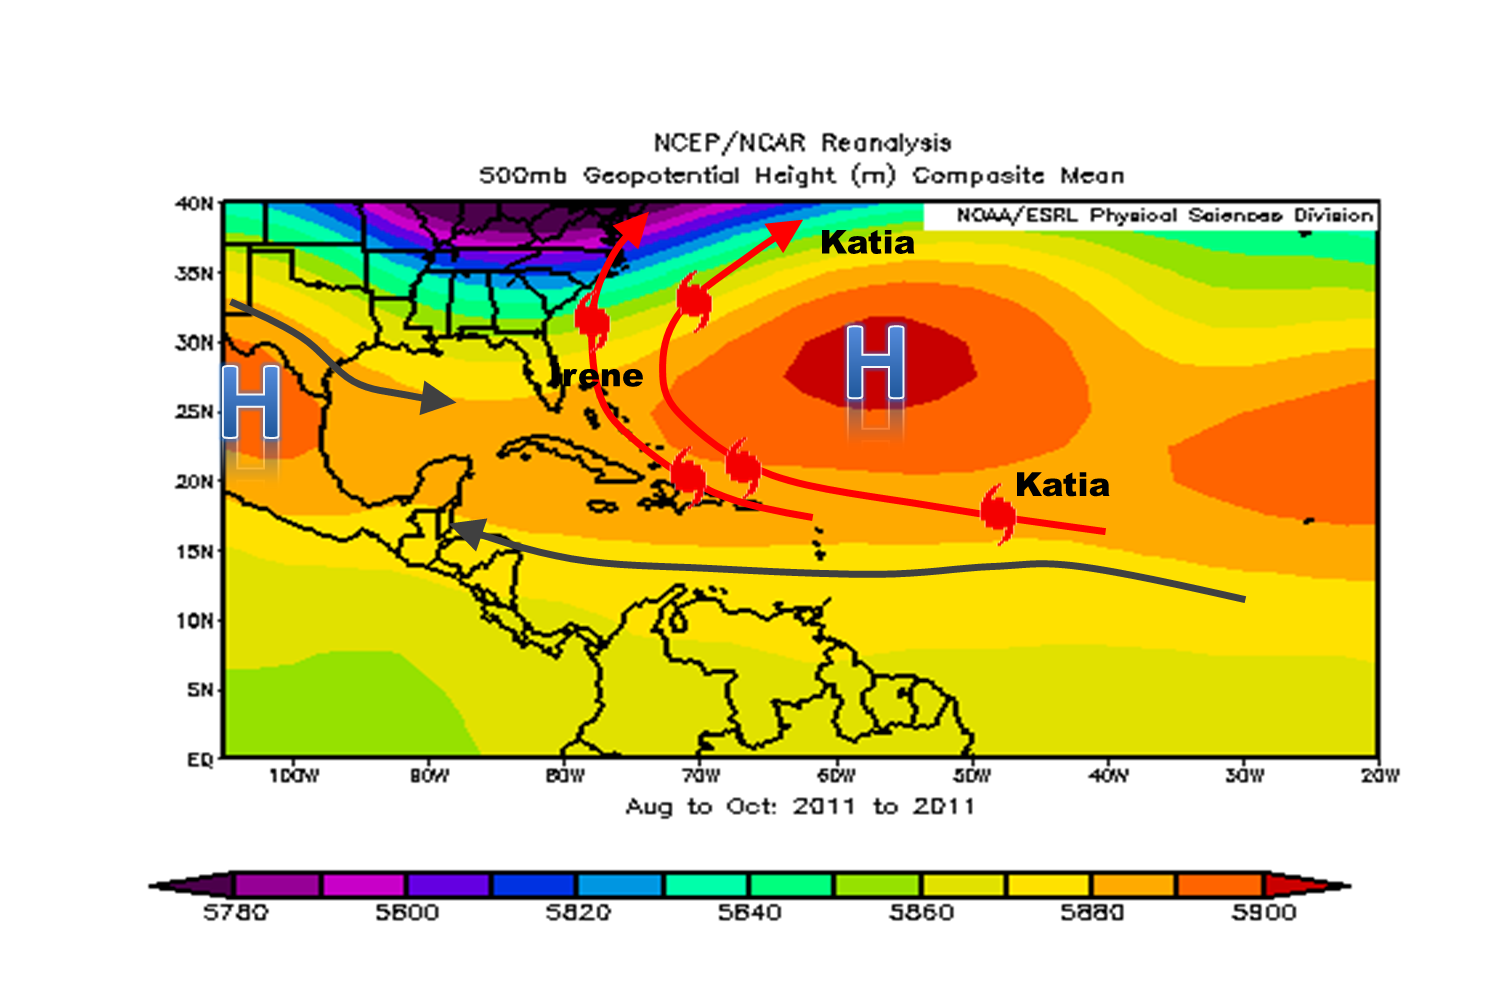
- Teleconnections, or atmospheric "puzzle pieces" which help dictate intraseasonal weather patterns, likely played a role in storm formation and movement. Some situations were eerily similar in 2011 when compared with 2010:
- Flow around the broad central Atlantic Ridge and repeating troughs nearing the east coast (below) recurved all but one (Harvey) Cape Verde wave
- Cyclones forming in the western Caribbean (Rina) or southern Gulf (Don, Lee, Nate) were blocked by the La Canícula ridge and/or impacted by a combination of atmospheric dry air and wind shear
- A persistent negative North Atlantic and Arctic Oscillation may have contributed to the stability of the eastern North American trough
- The 2011 season, like the one before it, is proof positive why we don’t "do" seasonal landfall predictions. As stated on the NOAA Hurricane Season Outlook: "NOAA does not make seasonal hurricane landfall predictions. Hurricane landfalls are largely determined by the weather patterns in place as the hurricane approaches, which are only predictable when the storm is within several days of making landfall."
|

