In early January 2024, the NWS text product AGOBRO (AGricultural Observations for NWS BROwnsville/Rio Grande Valley) was discontinued from NWS Brownsville/Rio Grande Valley's suite of daily text products. AGOBRO included reports from cooperative observers across the Rio Grande Valley and Deep South Texas ranchlands, showing temperature, rainfall, and for several, evaporation. All observations, with the exception of Brownsville, are reported on a general 24-hour basis from 7 AM to 7 AM Central Time (Brownsville is reported on a calendar day basis - midnight to midnight).
Understanding the Observations
For the 7 AM to 7 AM observations, nearly all maximum temperature reports are from the prior afternoon - for example, the high temperature recorded on January 31st actually occurred on January 30th. For minimum temperature, unusually low temperature values may be repeated on two days, as sensors are reset around 7 AM and values can remain low for an hour or two thereafter - which becomes the minimum value recorded on the following day. For example, a minimum temperature of 32 degrees recorded at 7 AM on January 17th would be repeated on January 18, even if the actual temperature on the 18th at 7 AM was 45 degrees. The repeat would be from value at 701 AM on the 17th, which would still be 32 degrees but recorded as the 24-hour minimum on the 18th. IN other words, two consecutive freezes would be reported, when in reality, only one morning - in this case - had a freeze.
For rainfall, the value shown for a given day (for example, January 21st) is often for the prior day (January 20th), except when rainfall continues into the overnight, when the value could include amounts from both dates. if you need to use calendar day observations, be sure to choose local airport locations from the Rio Grande Valley. They can be found under the "Observed Weather" tab on the Climate link.
Daily Temperature and Rainfall Cooperative Observations
These can be found under the NOAA Online Weather Data (NOWData) option (first tab) on the Climate link (image below). NOWData allows you to choose a location (column 1), a product (column 2), and a date or date span (column 3). Column 4 (View) produces a chart, table, or list of the requested data, which can be downloaded as a separate file. Locations include daily cooperative observations for all active sites across the Valley. The first two options (Brownsville Area and McAllen Area) are "threaded" data (multiple locations in the same vicinity, connected through the years for an official long-term period of record). Threaded data are primarily calendar-day based. "Brownsville/S Pa, TX" is also calendar-day based. The remaining locations are based on 7 AM to 7 AM data. Once a location is chosen, daily data can be found by selecting Daily almanac. The current date will appear under column 3 (options); choose "Go" in column 4 to display the data. The leftmost column will display the maximum, minimum, average, and precipitation - as well as snowfall, snow depth, heating degree days (HDD) and cooling degree days (CDD). Daily observations are available for the entire period of record for a listed location, which for stations such as Brownsville Area, date back to the late 19th Century.

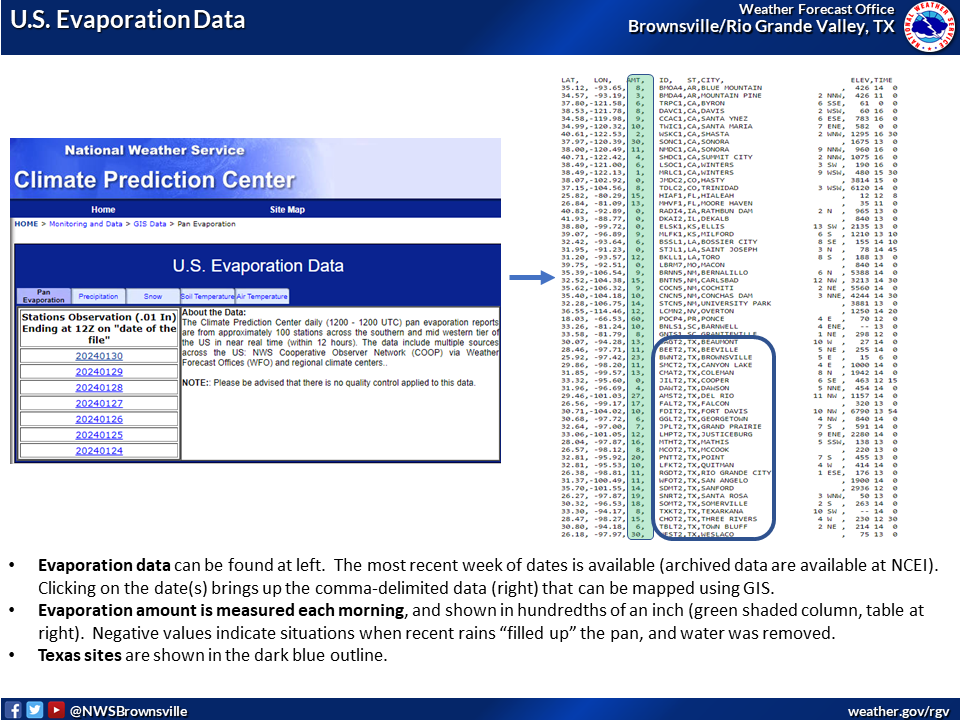
Pan Evaporation Data for Valley Cooperative Observation Sites
The unique climate of the Rio Grande Valley combined with the billion-dollar agricultural industry of crops and livestock, along with the other unique situation of the majority of water supply arriving via the Lower Rio Grande and the reservoirs which feed the river, are key reasons why NWS Brownsville/Rio Grande Valley has one of the larger networks of evaporation pans in the U.S. NWS maintains more than two dozen such locations, including six in the RGV (Falcon Dam, Rio Grande City, McCook, Weslaco, Santa Rosa, and Brownsville). Evaporation measurements are crucial to farmers and ranchers who can use the data to determine daily water use. Extreme evaporation rates, which can begin in spring and continue through early autumn, are often a combination of high temperatures, strong winds, and very low relative humidity. Periods of high to extreme evaporation rates can be used to conserve water use, as well as best time the use of water to be used by crops and livestock vs. being rapidly evaporated.
These data were part of the daily AGOBRO text product, but can still be found at the Climate Prediction Center (also linked from the graphic below). Seven days of evaporation data are available daily, with data updating each day (the earliest day "falls off" the chart). Archived data past the current seven days shown can be obtained via the National Centers for Environmental Information. Please note that data are not quality controlled; there will be occasions where the values may not make sense relative to the meteorological situation. For example, a location showing 150 as a value in the AMT (third) column (right side of the image below) during a cold, drizzly couple of days in January is incorrect and should not be considered.
Raw Text Data Still Available from Cooperative Observing Sites
To query the original data that is input by cooperative observers into a program known as Weather Coder, which produces single-station formatted observations each morning for all observers who report that day, click here. Be sure to review previous versions to view observations as they arrived, from the most recent to the earliest. The raw text data, known as the "RR3" (HydroMet Data Report, Part 3), updates continuously during the morning. For example, if you go to the site at 5 AM, all of the reports will be from the previous day. If you go to the site at 730 AM, you'll see a mix of the current day and previous day as you review prior versions. By 9 or 10 AM, all reports should be from the current day.
Reading the Raw HydroMet Data Report
Daily HydroMet reports are given in Standard Hydrometeorological Exchange Format, or SHEF, code. A manual describing SHEF code defines every category available for multiple weather and water observations. Below the following image, we describe each coded category for a specific location - in this case, Santa Rosa, Texas (just west of the Cameron/Hidalgo County line north of La Feria/Mercedes). Santa Rosa is one of six sites in the Rio Grande Valley that includes Pan Evaporation data.

| Code Letters | Description |
| .A | Agricultural Data |
| SNRT2 | Five-character site location (Santa Rosa) |
| 240201 | Date (YYMMDD) |
| C | Central Time Zone |
| TX | 7 AM to 7 AM Maximum Temperature (prior day, most times) |
| TN | 7 AM to 7 AM Minimum temperature. May have occurred now or on prior day, depending on situation |
| TA | Temperature at observation |
| PP | 7 AM to 7 AM Precipitation |
| .A1 | Continuation, second line |
| EP | Evaporation pan rate (inches/day) |
| TPIRZX | 7 AM to 7 AM Maximum water temperature in pan |
| TPIRZN | 7 AM to 7 AM Minimum water temperature in pan |
| UC | 7 AM to 7 AM accumulated wind travel, across pan |
| UCD | 7 AM to 7 AM wind travel length, across pan |
| DC2402010644 | Specific date/time observation was entered into system (YYMMDDHHMM) |

