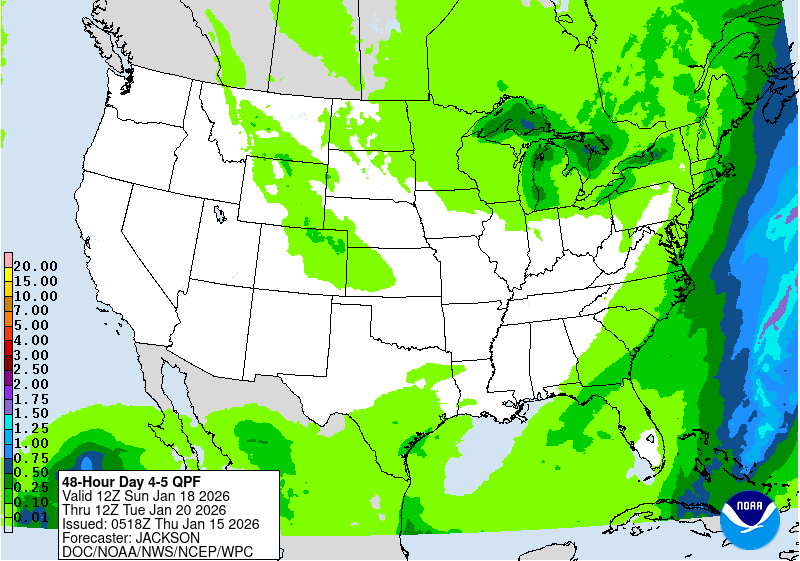
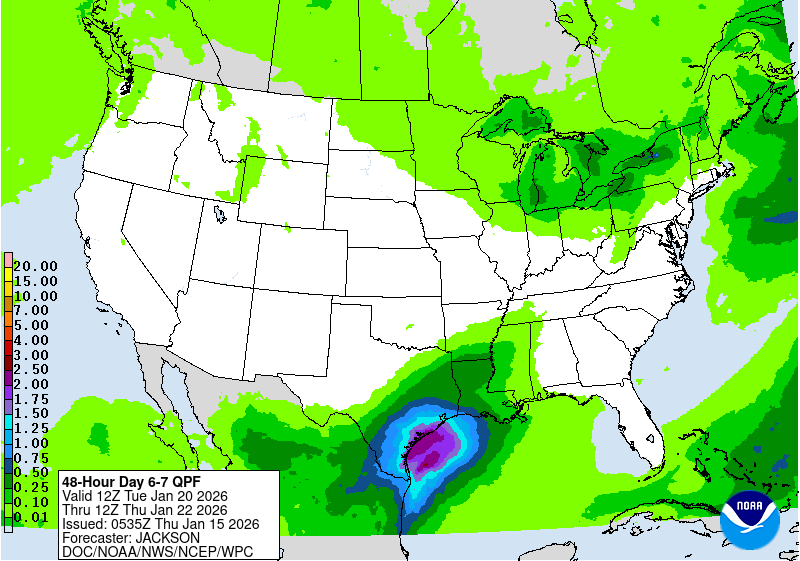
The purpose of these experimental probabilistic liquid precipitation products is to provide customers and partners a range of liquid precipitation possibilities, in complement to existing NWS deterministic liquid precipitation graphics, to better communicate forecast uncertainties during PQPF weather events. For more information visit this project's Product/Service Description Document.
| Location | Low-End Amount |
Expected Amount |
High-End Amount |
Chance of Seeing More Than | |||||||||
|---|---|---|---|---|---|---|---|---|---|---|---|---|---|