

Pre-Duty Controller Weather Briefing
Your essential overview for current and forecasted aviation weather.
Current Conditions
Radar
Satellite

Graphical Forecast for Aviation (GFA)
Terminal Area Forecasts (TAFs)
TAFs - Surrounding Airports
Forecasts & Models
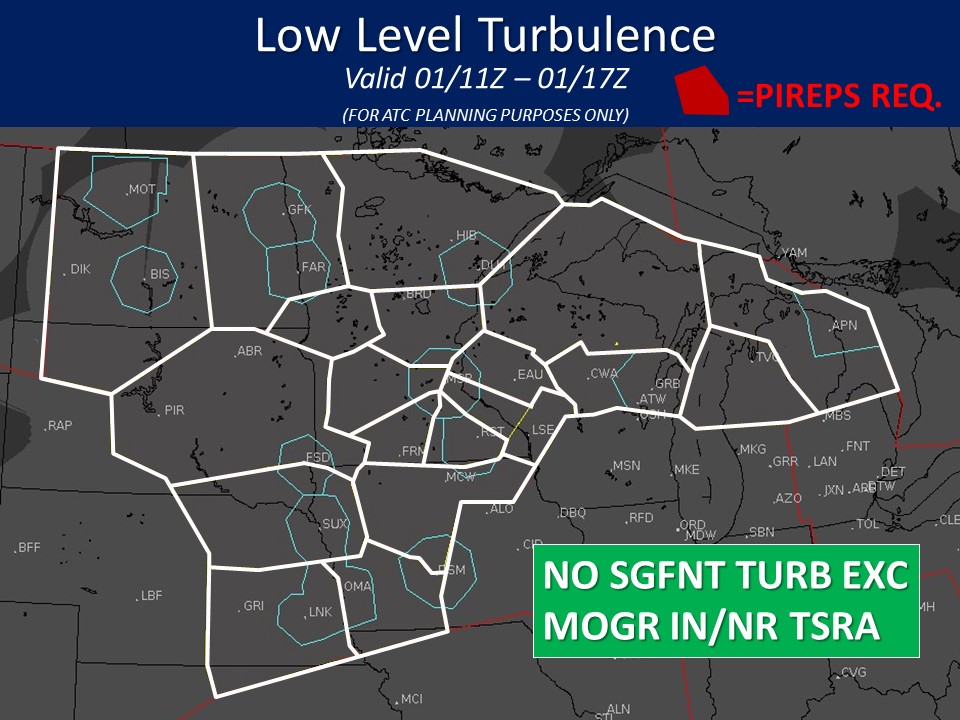
Low Level Turbulence
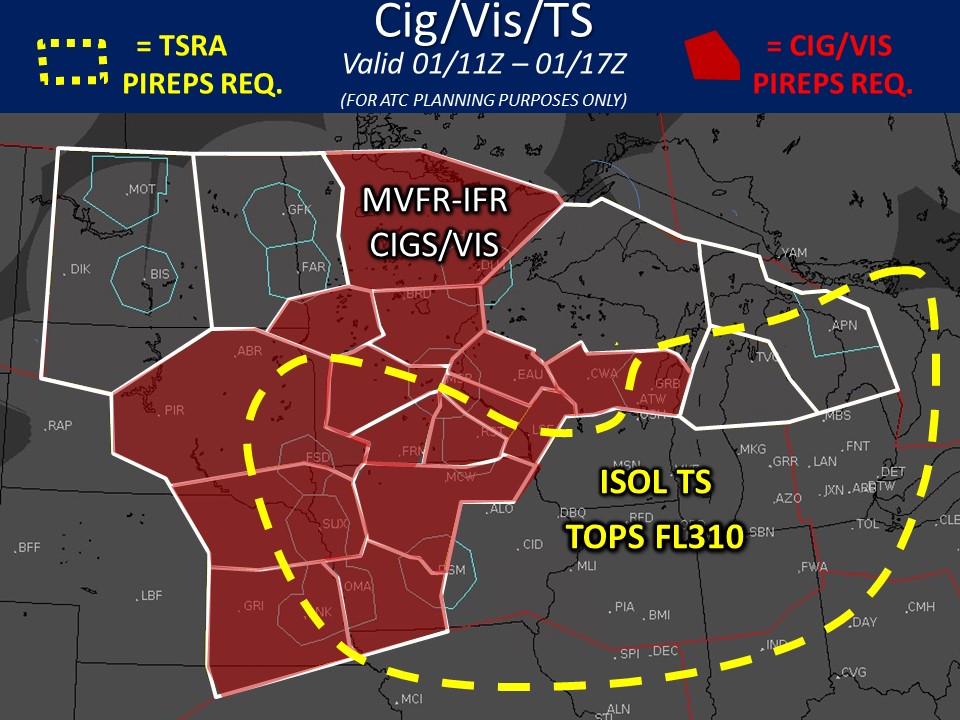
Cig/Vis/TS
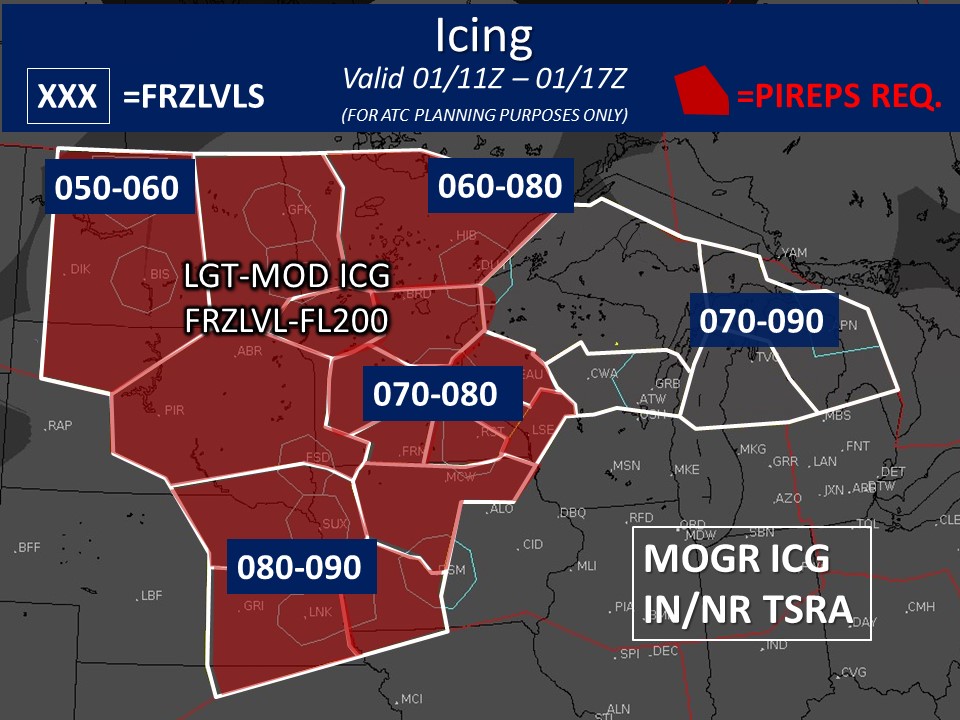
Icing
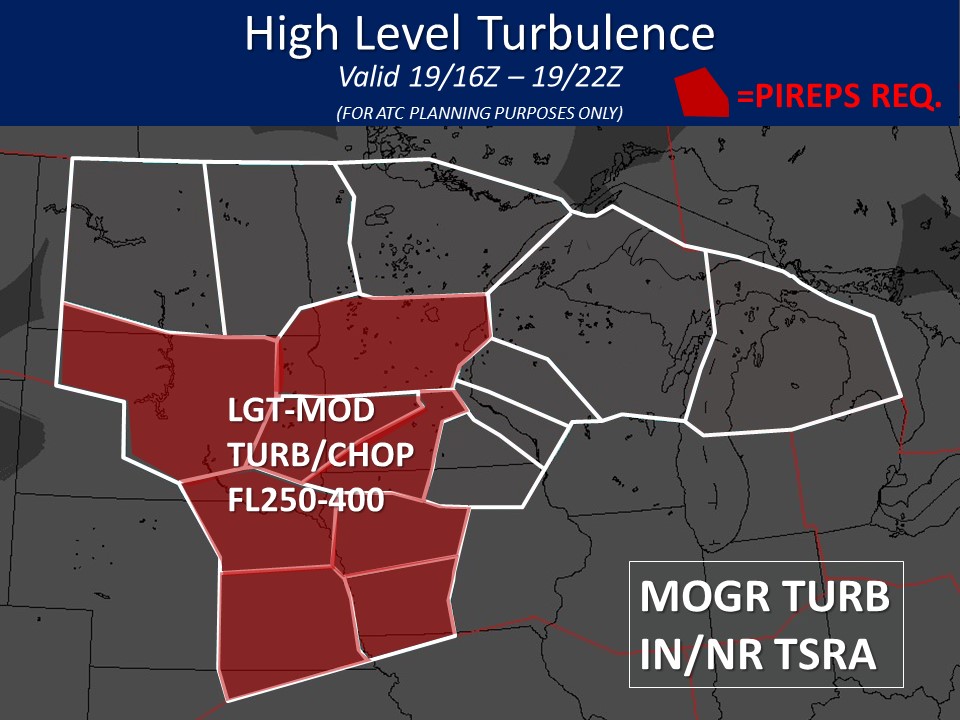
Flight Level Turbulence
KMSP Vertical Wind Profile
Model Trend Forecasts
Model meteogram for MSP airport
Model Probability Forecasts - Ceiling Height Plot
Bar graphs indicate the probability of selected flight category element. The color represents the difference (using 10% thresholds between categories) between the probability and the threshold required to make a categorical forecast. Solid black lines indicate the threshold value at each hour.
Model Probability Forecasts - Visibility Plot for MSP Airport
Bar graphs indicate the probability of selected flight category element. The color represents the difference (using 10% thresholds between categories) between the probability and the threshold required to make a categorical forecast. Solid black lines indicate the threshold value at each hour.