Timothy W. Troutman, NOAA/NWS, Southern Region Headquarters, Fort Worth, Texas
Mark A. Rose, NOAA/NWS, Weather Forecast Office, Nashville, Tennessee
L. Michael Trapasso, Department of Geography, Western Kentucky University, Bowling Green, Kentucky
Stuart A. Foster, Department of Geography, Western Kentucky University, Bowling Green, Kentucky
Date Submitted: January 25, 2001
Abstract
Heavy precipitation and flash flooding in middle Tennessee represent an ongoing forecast problem for meteorologists. The need for better ways to recognize heavy precipitation potential led to the development of a heavy precipitation climatology. This research provides much needed statistical data involving monthly and yearly precipitation normals and identification of the spatial distribution of heavy precipitation across middle Tennessee. The main purpose of this research is to determine whether different types of meteorological processes generate significant variability in heavy precipitation amounts. Three inch amounts in a 24-hour period constitute a heavy precipitation event. Cooperative observer data for 43 stations across middle Tennessee were used to analyze daily precipitation data during the period 1961-1990. The heavy precipitation events that occurred were categorized as either synoptic, frontal, meso-high, or tropical. Daily Weather Maps were used to categorize these events by analysis of the surface and 500 millibar upper air patterns. There were 246 heavy precipitation events encompassing 322 days. Six null and alternate hypotheses were developed to test the spatial distribution of heavy precipitation. The heavy precipitation events were tested using an f-test and a two-sample t-test for independent samples. The t-tests helped determine the significance of the spatial distribution of heavy precipitation across middle Tennessee. Results gained from this study include the determination that there are significant spatial differences in the heavy precipitation. Although, synoptic and tropical processes exhibit little variation in precipitation amounts, frontal and meso-high induced heavy precipitation events are highly variable with widely scattered precipitation measurements. Statistical results from this research are intended to assist operational meteorologists with heavy precipitation pattern recognition.
1. Introduction
After acquiring hydrometeorological responsibilities for middle Tennessee, as well as the increased emphasis on hydrometeorology by the National Weather Service, the authors perceived the need to develop a precipitation climatology. Determining the normals and extremes of precipitation across the area and identifying weather patterns that produce heavy precipitation across middle Tennessee will assist in precipitation forecasting (including the assessment of flood potential). With the major population centers of middle Tennessee concentrated along rivers, climatology has shown that past heavy precipitation events have produced significant flooding at many locations. With the creation of the Weather Forecast Office at Nashville, the office has the responsibility to mitigate the loss of life and property caused by flooding across its area. Another important reason for developing a precipitation climatology is to determine what causes a heavy precipitation event in middle Tennessee.
2. Background
a. Topography
The Highland Rim ranges from 183 meters in elevation along the Tennessee River to 305 meters on its eastern edge, and rises 91 to 122 meters above the Central Basin, a rolling plain of 183 meters average elevation (NOAA 1994). A crescent of hills reaching 305 meters lies south of Nashville. The Cumberland Plateau, with an average elevation of 610 meters above sea level, extends roughly northeast to southwest across eastern middle Tennessee in a belt 48 to 80 km wide.
The Nashville area extends west to east across middle Tennessee from the Tennessee River to the Cumberland Plateau, and has significant variations in topography (Figure 1). The two major river systems, Tennessee and Cumberland, drain 80% of the land surface of Tennessee. Of the state's total area of 108,262 km2, 55% drains into the Tennessee River, 25% into the Cumberland River, 19% westward into several small Mississippi River tributaries, and 1% northward into an Ohio River tributary and southward into an Alabama River tributary. Except for the small amount of water that flows south, all streamflow that originates in Tennessee eventually flows into the Mississippi River and past Memphis.
b. Normal Rainfall
Owenby et. al. (1992) defined climatological normals as the arithmetic mean of a climatological element computed over a long time period. International agreements eventually led to the decision that the appropriate time period would be three consecutive decades (Guttman 1989).
Figure 2 indicates that, on average, the wettest month of the year across the area (using averaged data from all cooperative stations) is March, with 5.76 inches. December is second with 5.30 inches, and October is the driest with 3.38 inches. Gaffin and Lowery (1996) characterized dry and wet monthly periods for west Tennessee. For middle Tennessee, similar findings were concluded. Climatologically, precipitation is somewhat uniform throughout the year, although the five-month period from June through October (summer into autumn) is considered the dry season, with only a third of the total annual rainfall occurring. The seven month period from November through May (late autumn through spring) is considered the wet season, when two-thirds of the annual precipitation occurs.
Normal precipitation increases from less than 48 inches over Davidson County (Nashville), to more than 57 inches over southwest middle Tennessee, around Waynesboro (Wayne County). Amounts also increase from less than 53 inches over the extreme northern foothills of the Cumberland Plateau, around Celina (Clay County), to more than 62 inches over the southern plateau, around Monteagle (Marion County) (Figure 1). The pattern of larger annual rainfall amounts to the south and east across middle Tennessee results from several factors. Most synoptic weather systems generally move from west to east across middle Tennessee, with cold fronts aligned southwest to northeast. The Gulf of America contributes to increased moisture, particularly across southern middle Tennessee, which is closer to this source. The higher precipitation amounts in the east are likely caused by the orographic effects of the Cumberland Plateau.
3. Data and Analysis
The data used in this study were acquired from the National Climatic Data Center (NCDC) in Asheville, North Carolina. Monthly and annual rainfall normals were used in this study using data from 43 cooperative stations across the area which had continuous records covering the 30-year period 1961-1990 (Figure 3). These values were obtained from the Climatography of the United States Series #81, published by NCDC.
Hourly precipitation data for the 43 cooperative stations covering the same 30-year period were also obtained from NCDC. The stations were selected based on their spatial representation across the 46,000 km2 area, as well as their continuous precipitation reports over the 30-year period. The Daily Weather Map series was used to classify weather patterns which produce heavy precipitation. Again, the heavy precipitation events were divided into 4 categories: synoptic, frontal, meso-high, and tropical. Maddox et. al. (1979) did the pioneering work of categorizing these event types, with subsequent research by Junker (1992), and Gaffin and Lowery (1996).
To determine a heavy precipitation event in middle Tennessee, a climatology of such events occurring during 24-hour periods was established. Huff (1967, 1989, 1990) performed comprehensive studies involving time and frequency distributions of heavy rainstorms in Illinois. Using charts from the Rainfall Frequency Atlas of the U.S. (1991) and heavy precipitation guidelines for middle Tennessee (Federal Meteorological Handbook No. 11 1991), it was determined that a three-inch precipitation amount occurring within a 24-hour period would constitute a heavy precipitation event for the purposes of this study. Using this value, 246 heavy precipitation events were documented for the period 1961-1990.
4. Results
The data used in this study were examined in order to determine statistical procedures to test hypotheses concerning the spatial variability of precipitation. The precipitation categories described in section 2 are depicted in sample histograms shown in Figures 4, 5, 6, and 7. Analysis of these histograms shows there were spatial differences with these heavy precipitation events. Especially significant were those involving the tropical event shown in Figure 7. Here, several stations across the study area reported precipitation amounts under one-half inch, although the majority of middle Tennessee recorded precipitation amounts of three inches or greater. Such spatial differences led to the development of a set of statistical hypotheses.
First, to complete a precipitation climatology for middle Tennessee, it was determined that 24-hour precipitation values from the aforementioned 43 cooperative stations would be used for the period 1961-1990. The stations were selected to provide an extensive spatial representation of the precipitation patterns across middle Tennessee (Figure 3). Two hundred and forty-six heavy precipitation events covering 322 days were analyzed. The storm total precipitation was calculated for each event and station. Daily Weather Maps were used to classify the meteorological processes (synoptic, frontal, meso-high, and tropical) which produced each event.
| Table 1. Heavy precipitation event types by season for middle Tennessee | |||||
|---|---|---|---|---|---|
| Event | Spring | Summer | Autumn | Winter | Total |
| Synoptic | 42 | 31 | 34 | 33 | 140 |
| Frontal | 14 | 36 | 14 | 5 | 69 |
| Meso-high | 3 | 21 | 4 | 0 | 28 |
| Tropical | 0 | 3 | 6 | 0 | 9 |
| Total | 59 | 91 | 58 | 38 | 246 |
| Table 2. Heavy precipitation event types by month for middle Tennessee | ||||||||||||
|---|---|---|---|---|---|---|---|---|---|---|---|---|
| Event | Jan | Feb | Mar | Apr | May | Jun | Jul | Aug | Sep | Oct | Nov | Dec |
| Synoptic | 11 | 8 | 14 | 14 | 14 | 9 | 19 | 3 | 16 | 8 | 8 | 16 |
| Frontal | 1 | 1 | 5 | 3 | 5 | 13 | 14 | 9 | 9 | 4 | 1 | 3 |
| Meso-high | 0 | 0 | 0 | 1 | 2 | 3 | 9 | 9 | 4 | 0 | 0 | 0 |
| Tropical | 0 | 0 | 0 | 0 | 0 | 0 | 1 | 2 | 5 | 1 | 0 | 0 |
| Total | 12 | 9 | 19 | 18 | 21 | 25 | 43 | 23 | 34 | 13 | 9 | 19 |
| Table 3. Frequency of heavy precipitation events by month as a function of number of years between events | ||||||||||||
|---|---|---|---|---|---|---|---|---|---|---|---|---|
| Event | Jan | Feb | Mar | Apr | May | Jun | Jul | Aug | Sep | Oct | Nov | Dec |
| Synoptic | 2.7 | 3.8 | 2.1 | 2.1 | 2.1 | 3.3 | 1.6 | 10 | 1.9 | 3.8 | 3.8 | 1.9 |
| Frontal | 30 | 30 | 6 | 10 | 6 | 2.3 | 2.1 | 3.3 | 3.3 | 7.5 | 30 | 10 |
| Meso-high | >30 | >30 | >30 | 30 | 15 | 10 | 3.3 | 3.3 | 7.5 | >30 | >30 | >30 |
| Tropical | >30 | >30 | >30 | >30 | >30 | >30 | 30 | 15 | 6 | 30 | >30 | >30 |
Variations in heavy precipitation type are shown for the four meteorological processes. Tables 1 and 2 show this distribution by season and month. Synoptic events occur most consistently throughout the year. Frontal events tend to predominate during spring, summer, and into autumn, with only 6 events occurring during late autumn and winter (November-February). Meso-high events were recorded only between April and September, while tropical events occurred only during July through October. Table 3 shows the monthly frequency of heavy precipitation events as a function of number of years per event. Again, the data is based on the period 1961-1990.
The spatial variability of precipitation for a given event can be measured by the standard deviation of precipitation values for each station. A relationship frequently exists between the standard deviation and the mean of a sample, such that the larger the mean, the larger the standard deviation (Sincich 1985). A measure of this relationship is the coefficient of variation (CV), which is found by dividing the mean by the standard deviation (Levin 1984).
This research will test the null hypothesis that heavy precipitation events will equal in type and in mean CV for the four heavy precipitation processes. In other words, the spatial distribution of heavy precipitation amounts are independent of the process. Specifically, 1) the mean CV (representing the average spatial variability of precipitation) for frontal events equals that for meso-high events; 2) the mean CV for frontal events equals that for synoptic events; 3) the mean CV for frontal events equals that for tropical events; 4) the mean CV for meso-high events equals that for synoptic events; 5) the mean CV for meso-high events equals that for tropical events, and; 6) the mean CV for synoptic events equals that for tropical events.
The alternate hypotheses state the heavy precipitation events will differ in type and in mean CV for the four heavy precipitation processes. In other words, the spatial distribution of heavy precipitation amounts are dependent on the process.
The first step was to perform the appropriate statistical test. This procedure involved computing descriptive statistics on the six pairs (Table 4). Prior to carrying out a difference of means test, an f-test was performed for each comparison to determine whether to use the pooled or separate variance estimate in the corresponding t-test. Simply put, the f- and t-tests are used to compare two means (Mendelhall 1991). Disagreement with the null hypothesis is indicated by a large value of "f" and/or "t." The null hypothesis here is that the variance of the CV is equal in each comparison of meteorological processes. The null and alternate hypotheses for the f-test are:
Ho:  FRONTAL = MESO-HIGH FRONTAL = MESO-HIGH |
Ha: FRONTAL  MESO-HIGH MESO-HIGH |
|
| Ho: FRONTAL = SYNOPTIC |
Ha: FRONTAL SYNOPTIC |
|
| Ho: FRONTAL = TROPICAL |
Ha: FRONTAL  TROPICAL TROPICAL |
|
| Ho: MESO-HIGH = SYNOPTIC |
Ha: MESO-HIGH SYNOPTIC |
|
| Ho: MESO-HIGH = TROPICAL |
Ha: MESO-HIGH TROPICAL |
|
| Ho: SYNOPTIC = TROPICAL |
Ha: SYNOPTIC TROPICAL |
where is the population variance of the CV.
| Table 4. Descriptive statistics for the four heavy precipitation processes. | |||
|---|---|---|---|
| Event | Event days | Mean CV | Standard deviation of CV |
| Synoptic | 183 | 1.0578 | 0.8968 |
| Frontal | 89 | 1.4409 | 1.0306 |
| Meso-high | 34 | 1.8305 | 0.7703 |
| Tropical | 15 | 1.2524 | 0.7909 |
The level of confidence was then selected. Since there are multiple comparisons being made involving the four heavy precipitation processes, the alpha value for rejecting the null hypothesis was set to the more stringent level of 0.01, rather than the more conventional 0.05 (Earickson et. al. 1994, Watson et. al. 1993). The level of confidence is used to determine the confidence interval, a range of numbers within which the data must fall in order to be accepted.
The null hypothesis was rejected for frontal versus meso-high events, and for frontal versus synoptic events. The null hypotheses were accepted for the remaining four comparisons. From the results of the f-test (Table 5), the proper t-test was selected. Since the null hypotheses were rejected for the first two comparisons, the appropriate two-sample t-test for independent samples was chosen for population variances being unequal. The remaining four comparisons accepted the null hypotheses. In these cases, the appropriate two-sample t-test for independent samples was chosen for population variances being equal. Since the degree of freedom computed for all six comparisons produced high values, the confidence limits ranged from -2.58 to 2.58 (Earickson et. al. 1994). The t-test used this confidence interval to accept/reject each hypothesis.
| Table 5. Values and critical f-statistics used to accept/reject f-test null hypotheses | |||
|---|---|---|---|
| Null hypothesis (Ho) | Value of f-statistic | Critical f-statistic | Hypothesis result |
| FRONTAL = MESO-HIGH |
1.80 | 1.7 | Rejected |
| FRONTAL = SYNOPTIC |
1.31 | 1.3 | Rejected |
| FRONTAL = TROPICAL |
1.70 | 2.2 | Accepted |
| MESO-HIGH = SYNOPTIC |
0.74 | 1.6 | Accepted |
| MESO-HIGH = TROPICAL |
0.95 | 2.0 | Accepted |
| SYNOPTIC = TROPICAL |
1.30 | 2.1 | Accepted |
The null and alternate hypotheses are:
Ho:  FRONTAL = MESO-HIGH FRONTAL = MESO-HIGH |
Ha: FRONTAL MESO-HIGH |
|
| Ho: FRONTAL = SYNOPTIC |
Ha: FRONTAL SYNOPTIC |
|
| Ho: FRONTAL = TROPICAL |
Ha: FRONTAL TROPICAL |
|
| Ho: MESO-HIGH = SYNOPTIC |
Ha: MESO-HIGH SYNOPTIC |
|
| Ho: MESO-HIGH = TROPICAL |
Ha: MESO-HIGH TROPICAL |
|
| Ho: SYNOPTIC = TROPICAL |
Ha: SYNOPTIC TROPICAL |
where is the population mean of the CV. Results of the t-test are shown in table 6.
| Table 6. Results of t-test for the six heavy precipitation process comparisons | ||||
|---|---|---|---|---|
| Null hypothesis (Ho) | Difference of means | Standard error of the difference of means | T-test statistic | Hypothesis results |
| FRONTAL = MESO-HIGH |
-0.389 | 0.170 | -2.29 | Accepted |
| FRONTAL = SYNOPTIC |
0.383 | 0.126 | 3.04 | Rejected |
| FRONTAL = TROPICAL |
0.189 | 0.279 | 0.68 | Accepted |
| MESO-HIGH = SYNOPTIC |
0.773 | 0.162 | 4.77 | Rejected |
| MESO-HIGH = TROPICAL |
0.578 | 0.240 | 2.41 | Accepted |
| SYNOPTIC = TROPICAL |
-0.195 | 0.236 | -0.82 | Accepted |
5. Discussion
The 246 heavy precipitation events were classified according to the previous climatologies over the central and eastern U.S. by Maddox et. al. (1979) and Crysler et. al. (1982). Maddox et. al. (1979) studied 150 heavy rainfall occurrences and identified 3 primary meteorological causes, which were classified as synoptic, frontal, and meso-high. Junker (1992) and Gaffin and Lowery (1996) also identified these processes, but included tropical as well. Since tropical systems sometimes produce heavy rainfall in middle Tennessee, this process will be included as a fourth classification.
A description of each process is provided. Although the descriptions are pulled from several sources, they accurately describe the processes as they occur in middle Tennessee. Since the authors were only able to study Daily Weather Maps to gather synoptic and mesoscale data for each system, only the surface and 500 mb characteristics are provided. Upper air patterns at other levels are not available.
Synoptic events were identified by Maddox et. al. (1979), Junker (1992), and Gaffin and Lowery (1996) as heavy rain events resulting from an intense synoptic scale system, or a slow-moving system. Junker (1992) further states that one of the primary ingredients for a synoptic event is the slow east/northeast movement of a strong 500 millibar (mb) trough. Heavy precipitation associated with such a system usually occurs in the warm sector ahead of the cold front and 500 mb trough. Maddox et. al. (1979) found that deep moisture is usually present with precipitable water values around 1.5 inches. Junker (1992) further showed that synoptic events are most common across the southern U.S. from fall through early summer. Doswell, et. al. (1996) indicates that there is an unmistakable connection between synoptic-scale weather systems and deep, moist convection. Doswell (1987) also suggests that the convection is via the moistening and destabilization created by the modest but persistent synoptic-scale vertical ascent ahead of shortwave troughs.
Frontal events were defined by Maddox et. al. (1979) as heavy rain occurring along or just north (near the 500 mb ridge) of a slow-moving or stationary surface front usually oriented west to east. These events are primarily nocturnal. Bonner (1966) also documented the nocturnal maximum in the low-level jet as the forcing mechanism for frontal heavy precipitation events. Junker (1992) and Maddox et. al. (1979) found that upper-level winds usually parallel the front, allowing convective cells to train over an area, producing the heavy precipitation.
The mesoscale convective complex (MCC) and mesoscale convective system (MCS) have been shown by Maddox (1980), Fritch and Maddox (1981), and Maddox et. al. (1981) to develop nocturnally along a low-level jet where extensive moisture transport occurs. Warm, moist air forced over a front will produce the heaviest rainfall on the cool side of the front, also primarily at night. Doswell et. al. (1996) further states that the tendency for flash floods and heavy precipitation to occur after dark suggests that the convection can persist well into the night. The activity usually ends late the following morning. Redevelopment, however, may occur during the late afternoon. This allows the synoptic flow and diurnal heating to reaccumulate the needed ingredients for another round of convection.
Gaffin and Lowery (1996) and Maddox et. al. (1979) define meso-high induced heavy precipitation occurrences as being associated with quasi-stationary thunderstorm outflow boundaries, which are generated by previous thunderstorm activity. The heaviest precipitation usually occurs near the 500 mb ridge, and on the cool side of the surface boundary, usually to the south or southwest of the meso-high center. Maddox et. al. (1979) studied mesoscale heavy precipitation occurrences and found that meso-high events occurred predominantly east of a slow-moving frontal band. Doswell et. al. (1996) also notes that mesoscale processes, such as orographic lift, are important mechanisms, and must be considered.
Mesoscale processes associated with MCS's can produce heavy precipitation a number of ways. They often produce large pools of thunderstorm outflow that persist for several hours after the convection itself has dissipated. These outflow boundaries can maintain their integrity over great distances. Such outflow boundaries often play a vital role in the initiation of subsequent convection, which may develop into a slow-moving MCS as described by Chappell (1986) and Trapasso and Powell (1986).
Tropically induced heavy precipitation was also classified in this study. Schoner and Molansky (1956) and Junker (1992) state that the heaviest rainfall associated with a hurricane usually falls along the immediate coast, although a lesser maximum may occur inland. Junker also notes that the heaviest precipitation amounts usually occur slightly to the right of the storm track. The amount and extent of precipitation depends on the storm's forward speed, circulation size, and the storm's interaction with the westerlies. However, many storms are asymmetric, and some, because of their structure, have more convection north and west of the storm.
A good example of intrusion of tropical moisture into a region of strong synoptic forcing was the landfall of Hurricane Agnes. This storm produced heavy precipitation and widespread flooding that cost a number of lives and millions of dollars along the east coast of the U.S. (Dimego and Bosart 1982a and 1982b, Bosart and Dean 1991). Further examples of intrusion of tropical moisture into middle Tennessee were the landfalls of Hurricanes Camille and Frederic. Again, both storms produced widespread flooding that caused many deaths and millions of dollars in damage along the gulf and southeast coasts (Sugg et. al. 1971, Powell 1982). (In fact, Nashville's greatest one-day rainfall ever (6.60 inches) resulted as the remnants of Hurricane Frederic pushed inland. Rainfall intensity records for 3 hours (4.12 inches), 6 hours (5.17 inches), aand 12 hours (6.37 inches) were also set.) Junker (1992) indicates that when a hurricane, or the remains of a hurricane, interact with a system in the westerlies, a secondary precipitation maximum is possible, sometimes exceeding that at landfall. Although tropical systems rarely affect middle Tennessee, they tend to produce the largest precipitation amounts of the four processes described.
6. Conclusions
The purpose of this study was to establish a heavy precipitation climatology for middle Tennessee. Heavy precipitation processes were classified as synoptic, frontal, meso-high, and tropical. Two statistical tests were performed in order to determine the presence of any spatial variability among these four meteorological processes. The analyses of temporal and spatial variability reveal several useful conclusions.
The values derived from the t-test also serve important implications for assessing the potential for flooding when forecasting a particular heavy precipitation process. Maddox et. al. (1979, 1980) and Junker (1992) have shown that heavy precipitation amounts occurring across a large area and over a long time period will likely produce flooding. The results of the t-test show that synoptic and tropical processes produce the most uniform precipitation amounts, and would therefore be more likely than the frontal and meso-high processes to produce widespread flooding in middle Tennessee. (Please note that the same conclusions cannot be applied to flash flooding events, which are more localized, and more dependent on rainfall intensity.)
It should be the goal of every meteorologist to give as much advance as possible before the onset of any flooding. A thorough knowledge of the heavy precipitation climatology for his/her forecast area will greatly assist in this endeavor.
7. References
Bonner, W.D., 1966. Climatology on the low-level jet. Mon. Wea. Rev., 96, 833-850.
Bosart, L.F. and D.B. Dean, 1991: The Agnes rainstorm of June 1972: Surface feature culminating in inland storm development. Wea. Forecasting, 6, 515-537.
Chappell, C.F., 1986: Quasi-stationary convective events. Initialized mesoscale meteorology and forecasting. P.S. Ray, ed. Amer. Meteor. Soc., 289-310.
Crysler, K.A., R.A. Maddox, L.R. Hoxit, and B.M. Muller, 1982: Diurnal distribution of very heavy precipitation over the central and eastern United States. Nat'l. Wea. Dig., 7, 33-37.
Dimego, G.J. and L.F. Bosart, 1982a: The transformation of tropical storm Agnes into an extratropical cyclone. Part I: The observed fields and vertical motion computations. Mon. Wea. Rev., 110, 412-433.
_____, 1982b: The transformation of tropical storm Agnes into an extratropical cyclone. Part II: Moisture, vorticity, and kinetic energy budgets. Mon. Wea. Rev., 110, 412-433.
Doswell, C.A., III, 1987: The distinction between large-scale and initialized mesoscale contribution to severe convection. A case study example. Wea. Forecasting, 2, 3-16.
_____, H.E. Brooks, and R.A. Maddox, 1996: Flash flood forecasting. An ingredients-cased methodology. Wea. Forecasting, 11, 560-581.
Fritch, J.M. and R.A. Maddox, 1981: Convectively driven mesoscale convective systems aloft. Part I: Observations. J. Appl. Meteor., 20, 9-19.
Gaffin, D.M.,and J.C. Lowery, 1996: A rainfall climatology of the NWSFO Memphis county warning area. NOAA Technical Memorandum NWS SR-175.
Guttman, N.B., 1989. Statistical descriptors of climate. Bull. Amer. Meteor. Soc., 70, 602-607.
Hoxit, L.R., R.A. Maddox, and C.F. Chappell, 1978: On the nocturnal maximum of flash floods in the central and eastern U.S. Preprints, Conf. On Weather Forecasting and Analysis and Aviation Meteorology, Silver Springs, MD. Amer. Meteor. Soc., 52-57.
Huff, F.A., 1967: Time distribution of rainfall in heavy storms. Water Resources Research, 3, 1007-1019.
_____, and J.C. Angel, 1989b: Frequency distributions of heavy rainstorms in Illinois. Illinois State Water Survey Circular, 172, 36 p.
_____, 1990: Time distributions of heavy rainstorms in Illinois. Illinois State Water Survey Circular, 173, 37 p.
Junker, N.W., 1992: Heavy rain forecasting manual. National Weather Service Training Manual 8-60.
Levin, R.I., 1984. Statistics for Management, New York. 3rd ed., 862 p.
Maddox, R.A., 1980: Mesoscale convective complexes. Bull. Amer. Meteor. Soc., 61, 1374-1387.
_____, C.F. Chappell, and L.R. Hoxit, 1979: Synoptic and mesoalpha scale aspects of flash flood events. Bull. Amer. Meteor. Soc., 60,115-123.
_____, D.J. Perkey, and J.M. Fritch, 1981: Evolution of upper tropospheric features during the development of mesoscale convective complexes. J. Atmos. Sci., 38, 1644-1674.
Mendenhall, W. and R. Beaver, 1991: Introduction to Probability and Statistics. PWS-Kent Publishing Company, Boston, Massachusetts, 716 pp.
National Climatic Data Center, 1991: Rainfall Frequency Atlas of the U.S., 1-35.
NOAA, 1991: Federal Meteorological Handbook No. 11: Doppler Radar Observations. Part C: WSR-88D Products and Algorithms. Office of Federal Coordinator of Meteorological Observations and Supporting Research, Rockville, MD, 2-98-3-36. [Available from the Office of the Federal Coordinator for Meteorological Observations and Supporting Research, Rockville, MD 20852.]
NOAA, 1994: WFO Nashville, Tennessee River Flood Manual. 1-10.
Owenby, J.R., and D.S. Ezell, 1992: Monthly station normals of temperature, precipitation, and heating and cooling degree days 1961-1990. Climatography of the United States, No. 81, 1-6.
Powell, M.D., 1982: The transition of the Hurricane Frederick boundary-layer wind field from the open Gulf of America to landfall. Mon. Wea. Rev., 110, 1912-1932.
Schoner, R.W., and S. Molansky, 1956: Rainfall associated with hurricanes (and other topical disturbances). National Hurricane Research Project No. 3. U.S. Weather Bureau.
SPSS Statistical Applications Program. Version 7.5. 1997. 5 p. Internet, 10 Jul 1998.
Sugg, A., L.G. Pardue, and R.L. Carrodus, 1971: Memorable hurricanes of the United States since 1873. NOAA Technical Memorandum NWS SR-56. 1-12.
Trapasso, L.M. and G.E. Powell, 1986: A simplified analysis for the detection of mesoscale outflow boundaries. Geophysical Perspectives, 58, 49-57.
Watson, C.J., P. Billingsly, D.J. Croft, D.V. Huntsberger, 1993: Statistics for Management and Economics. New York. MacMillan Publishing. 5th ed., 432-437.
Acknowledgements
The authors thank Rusty Pfost, Meteorologist-in-Charge, WFO Miami, and Mike Callahan, Service Hydrologist, WFO Louisville, for their review and very helpful suggestions. Very special thanks are deserved by Jamie Kousky, NCEP Climate Prediction Center, who patiently copied 161 daily weather maps, and the Western Kentucky University Climate Center, which provided the remaining climatological information used in this study.
Authors
Timothy Troutman is the NOAA Weather Radio and Dissemination Meteorologist at the National Weather Service, Southern Region Headquarters in Fort Worth, Texas. He has held this position since August, 2000. Primary duties include program management of the NOAA Weather Radio and Dissemination program for the Southern Region of the National Weather Service. Prior to this assignment, he worked as a senior forecaster at the National Weather Service Forecast Office at Melbourne, Florida, and previously as a forecaster at the National Weather Service Office in Old Hickory, Tennessee. He began his National Weather Service career at the Weather Service Office in Evansville, Indiana in 1989. Timothy is a graduate of Western Kentucky University, with a Bachelors Degree in Broadcast Communications in 1989, and a Master of Science Degree in Hydrometeorology in 1999.
Mark Rose is a meteorologist at the Weather Forecast Office in Old Hickory, Tennessee. He previously served as a Navy weather observer (1988-1991) before attending Memphis State University. He graduated in 1994 with a Bachelor of Science degree in Geography, with a concentration in Meteorology, and a minor in Mathematics. Mr. Rose joined the National Weather Service at Montgomery, AL in May, 1994, and was transferred to Old Hickory in June, 1995. Mr. Rose has authored or co-authored many technical papers, including publications in Weather and Forecasting and National Weather Digest.
L. Michael Trapasso is a Professor in the Department of Geography and Geology at Western Kentucky University, and is the Director of the College Heights Weather Station. His primary duties include teaching atmospheric science courses, and running the weather station. His received his Ph.D. from Indiana State University in 1980, and has been active in the field ever since. His professional memberships are many, but include the International Society of Biometeorology, the American Meteorological Society, and the Association of American Geographers. His research interests lie in the fields of applied climatology, human biometeorology, forensic meteorology, and environmental perception.
Dr. Stuart A. Foster is an Associate Professor in the Department of Geography and Geology at Western Kentucky University. He serves as the State Climatologist for Kentucky, and is the Director of the Kentucky Climate Center, where he oversees public service, education outreach, and applied research activities. He teaches courses in geographic techniques, including geographic information systems. His professional memberships include the Association of American Geographers and the American Association of State Climatologists. His research interests include applied climatology and combine geographic information systems with exploratory data analysis.
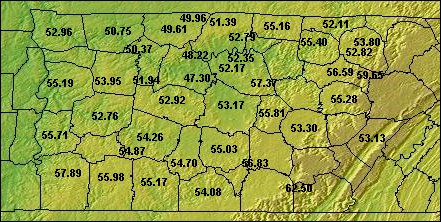
Figure 1. Topographic map for middle Tennessee (Source: National Geophysical Data Center). Numbers indicate normal annual precipitation.
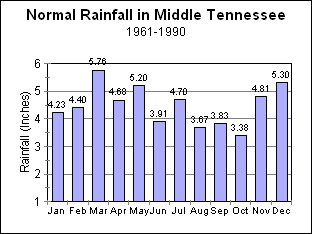
Figure 2. Normal monthly distribution of precipitation across middle Tennessee.
Figure 3. The area of responsibility of the Weather Forecast Office at Nashville at the time of the study. Numbers represent the locations of the 43 cooperative stations used. The city and county of each station are listed below.
 # City             County
==============================
 1 Bethpage         Sumner
 2 Carthage         Smith
 3 Celina           Clay
 4 Centerville      Hickman
 5 Cheatham Dam     Cheatham
 6 Clarksville      Montgomery
 7 Columbia         Maury
 8 Cookeville       Putnam
 9 Dickson          Dickson
10 Dover            Stewart
11 Fayetteville     Lincoln
12 Franklin         Williamson
13 Gainesboro       Jackson
14 Kingston Springs Cheatham
15 Lafayette        Macon
16 Lawrenceburg     Lawrence
17 Lebanon (7N)     Wilson
18 Lebanon (3W)     Wilson
19 Lewisburg        Marshall
20 Linden           Perry
21 Livingston       Overton
22 McMinnville      Warren
23 Monteagle        Marion
24 Monterey         Putnam
25 Mount Pleasant   Maury
26 Murfreesboro     Rutherford
27 Nashville        Davidson
28 Neapolis         Maury
29 Old Hickory      Wilson
30 Orlinda          Robertson
31 Pikeville        Bledsoe
32 Portland         Sumner
33 Pulaski          Giles
34 Shelbyville      Bedford
35 Smithville       De Kalb
36 Sparta           White
37 Springfield      Robertson
38 Statesville      Wilson
39 Tullahoma        Coffee
40 Waverly          Humphreys
41 Waynesboro       Wayne
42 Winchester       Franklin
43 Woodbury         Cannon
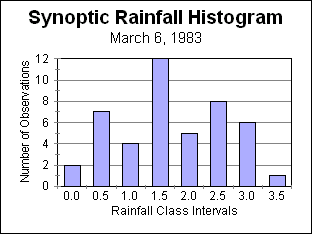
Figure 4. Synoptic event histogram for March 6, 1983.
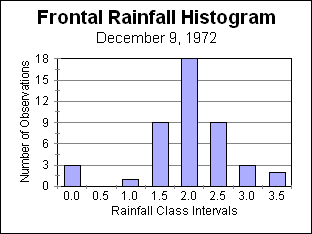
Figure 5. Frontal event histogram for December 9, 1972.
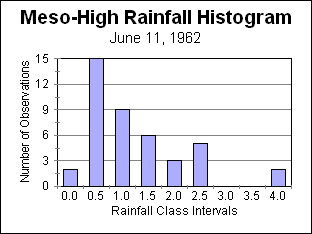
Figure 6. Meso-high event histogram for June 11, 1962.
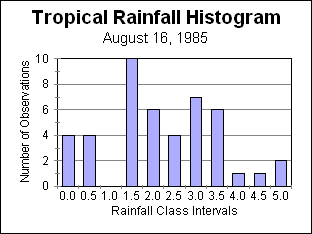
Figure 7. Tropical event histogram for August 16, 1985.

