Mark A. Rose
WFO Nashville, TN
Timothy W. Troutman
WFO Melbourne, FL
1. Introduction
Numerous large hail events (hail diameter 3/4 inch or more) were studied across the Nashville County Warning Area (CWA) in Middle Tennessee during 1995-1998 in order to determine the relationship between Vertically Integrated Liquid (VIL) Density and hail size. This relationship can be utilized operationally. The methodology used in deriving this comparison is provided to assist other NWS offices in developing VIL Density/hail size correlations.
2. VIL and VIL Density
VIL is a function of reflectivity, and converts reflectivity data into an equivalent liquid water content value based on studies of drop-size distribution and empirical studies of reflectivity factor and liquid water content (Amburn 1996). The general equation for VIL as used with the WSR-88D is:
VIL = SUM 3.44 x 10⁻⁶ [(Zi + Zi+1)/2]4/7 dh
and has units of kg m-2. Zi and Zi+1 are radar reflectivity at the bottom and top of the layer dh, whose thickness (dh) is in meters.
VIL Density is simply the VIL divided by the echo top (m) and multiplied by 1000 in order to express the result as g m-3. The importance of VIL Density is its use in quickly identifying thunderstorms with high reflectivities relative to their height. Such thunderstorms often contain hail cores, and as VIL Density increases, the hail core tends to be deeper, more intense, and the resulting hail sizes tend to be larger (Amburn 1996).
3. Methodology
During the years 1995-1998, 301 severe hail events occurring within the Nashville CWA were analyzed. VIL, echo top, and hail size were gathered for each event in order to calculate VIL Density and compare with hail size.
In order to select the echo top, the WSR-88D function was used. The echo top selected was always located on the same pixel as the maximum VIL. The echo top and VIL values used were in increments of 5 units. (A VIL in the range of 45-49 kg m-2 was reported as 45 kg m-2. An echo top in the range of 35-39 kft was reported as 35 kft.) Only storms for which severe hail was reported were used. Thus, in this study, it is unknown whether large values of VIL or VIL Density may be associated with hail less than 3/4 in diameter.
Severe hail events from all seasons were used. Severe hail was observed in thunderstorms with VILs as low as 15 kg m-2 and echo tops as low as 10 kft, and in thunderstorms with VILs as high as 80 kg m-2 and echo tops as high as 50 kft. A comparison was then made between VIL Density and hail size. Linear regression was used to fit a straight line to the two variables to assist in interpreting results.
Many of the cases used in this study were gathered from WSR-88D data in which Volume Coverage Pattern 21 (not VCP 11) was used. VCP 21 samples fewer elevation angles than VCP 11. Because of the gaps in the scan strategy, VCP 21 performs less thoroughly than VCP 11 in the estimation of VILs and echo tops (Federal Meteorological Handbook No. 1, Part C 1991).
Also, all hail sizes used in this study were obtained using storm verification data. These data are collected to assist with warning verification and are not necessarily complete as supporting scientific studies. It is not known whether the hail sizes reported with each event represent the largest hail which occurred.
4. Results
It was hypothesized that a relationship between VIL Density and hail size exists. The results here confirm earlier studies which indicate that, in cases of large hail, there is a strong positive correlation between VIL Density and hail size.
VIL Density, especially when compared with hail size, does provide useful information. For the 301 large hail cases, 81% had a VIL Density of at least 3.5 g m-3. Interestingly, Amburn (1996) identifies the VIL Density of 3.5 g m-3 as correctly identifying over 90% of the severe hail cases in his Oklahoma study. Also, the average VIL Density associated with 3/4 inch hail (the smallest of the severe categories) was 4.1 g m-3. The VIL Density of 1.6 g m-3 correctly identified all 301 severe hail events, 3.3 g m-3 identified all hail occurrences of 1.75 in and larger, and 3.6 g m-3 identified all hail occurrences of 2.75 in and larger.
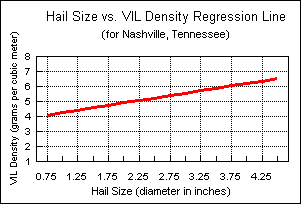
A regression line describing this relationship was developed as well (Figure 1). VIL Density can be estimated by applying known VIL and Echo Top values to the table below.
| Table 1. VIL Density Computation Worksheet for Nashville, TN | |||||||||
|---|---|---|---|---|---|---|---|---|---|
| Echo Top (in thousands of feet) | |||||||||
| VIL | 20 | 25 | 30 | 35 | 40 | 45 | 50 | 55 | 60 |
| 15 |
|
|
|
|
|
|
|
|
|
| 20 |
|
|
|
|
|
|
|
|
|
| 25 |
|
|
|
|
|
|
|
|
|
| 30 |
|
|
|
|
|
|
|
|
|
| 35 |
|
|
|
|
|
|
|
|
|
| 40 |
|
|
|
|
|
|
|
|
|
| 45 |
|
|
|
|
|
|
|
|
|
| 50 |
|
|
|
|
|
|
|
|
|
| 55 |
|
|
|
|
|
|
|
|
|
| 60 |
|
|
|
|
|
|
|
|
|
| 65 |
|
|
|
|
|
|
|
|
|
| 70 |
|
|
|
|
|
|
|
|
|
Figure 1 below can then be used during severe weather to indicate a thunderstorm's severe hail potential. VIL Density should, however, be used with a reliable minimum VIL threshold technique in such situations.
5. Conclusion
The data gathered for this study show a strong correlation between VIL Density and hail size. This relationship can be utilized operationally to assist in issuing severe thunderstorm warnings when used with the "VIL-of-the-day" or other minimum VIL threshold techniques.
Acknowledgements
The authors thank Scott Sharp, lead forecaster, NWSFO Raleigh, NC, Darrell Massie, lead forecaster, Henry Steigerwaldt, Science-and-Operations Officer, and Jerry Orchanian, Warning Coordination Meteorologist, NWSFO Nashville, for their reviews of this paper. Special thanks to Steve Amburn, Science-and-Operations Officer, NWSFO Tulsa, OK for his review and numerous suggestions.
REFERENCES
Amburn, S. and P. Wolf, 1996: VIL density as a hail indicator. Preprints, 18th Conf. on Severe Local Storms. Amer. Meteor. Soc., San Francisco, CA.
Federal Meteorological Handbook 11, 1991: Doppler Radar Meteorological Observations, Part C, Office of the Federal Coordinator for Meteorological Services and Supporting Research, U. S. Department of Commerce/NOAA, Washington, D. C.

