Welcome to FAQs about the National Weather Service’s new radar webpage located at radar.weather.gov and launched on December 17, 2020. We redesigned our radar viewer to improve our services to the public. On the new page, we provide more radar products and radar images are updated more frequently and at four times higher resolution than before. Our GIS-based webpage allows users to integrate our radar data into their own platforms. Learn more. If you have suggestions or feedback, please email nws.radarfeedback@noaa.gov. Last Updated: 9/6/23 for Version 2.0 updates.
How do I use the new map?
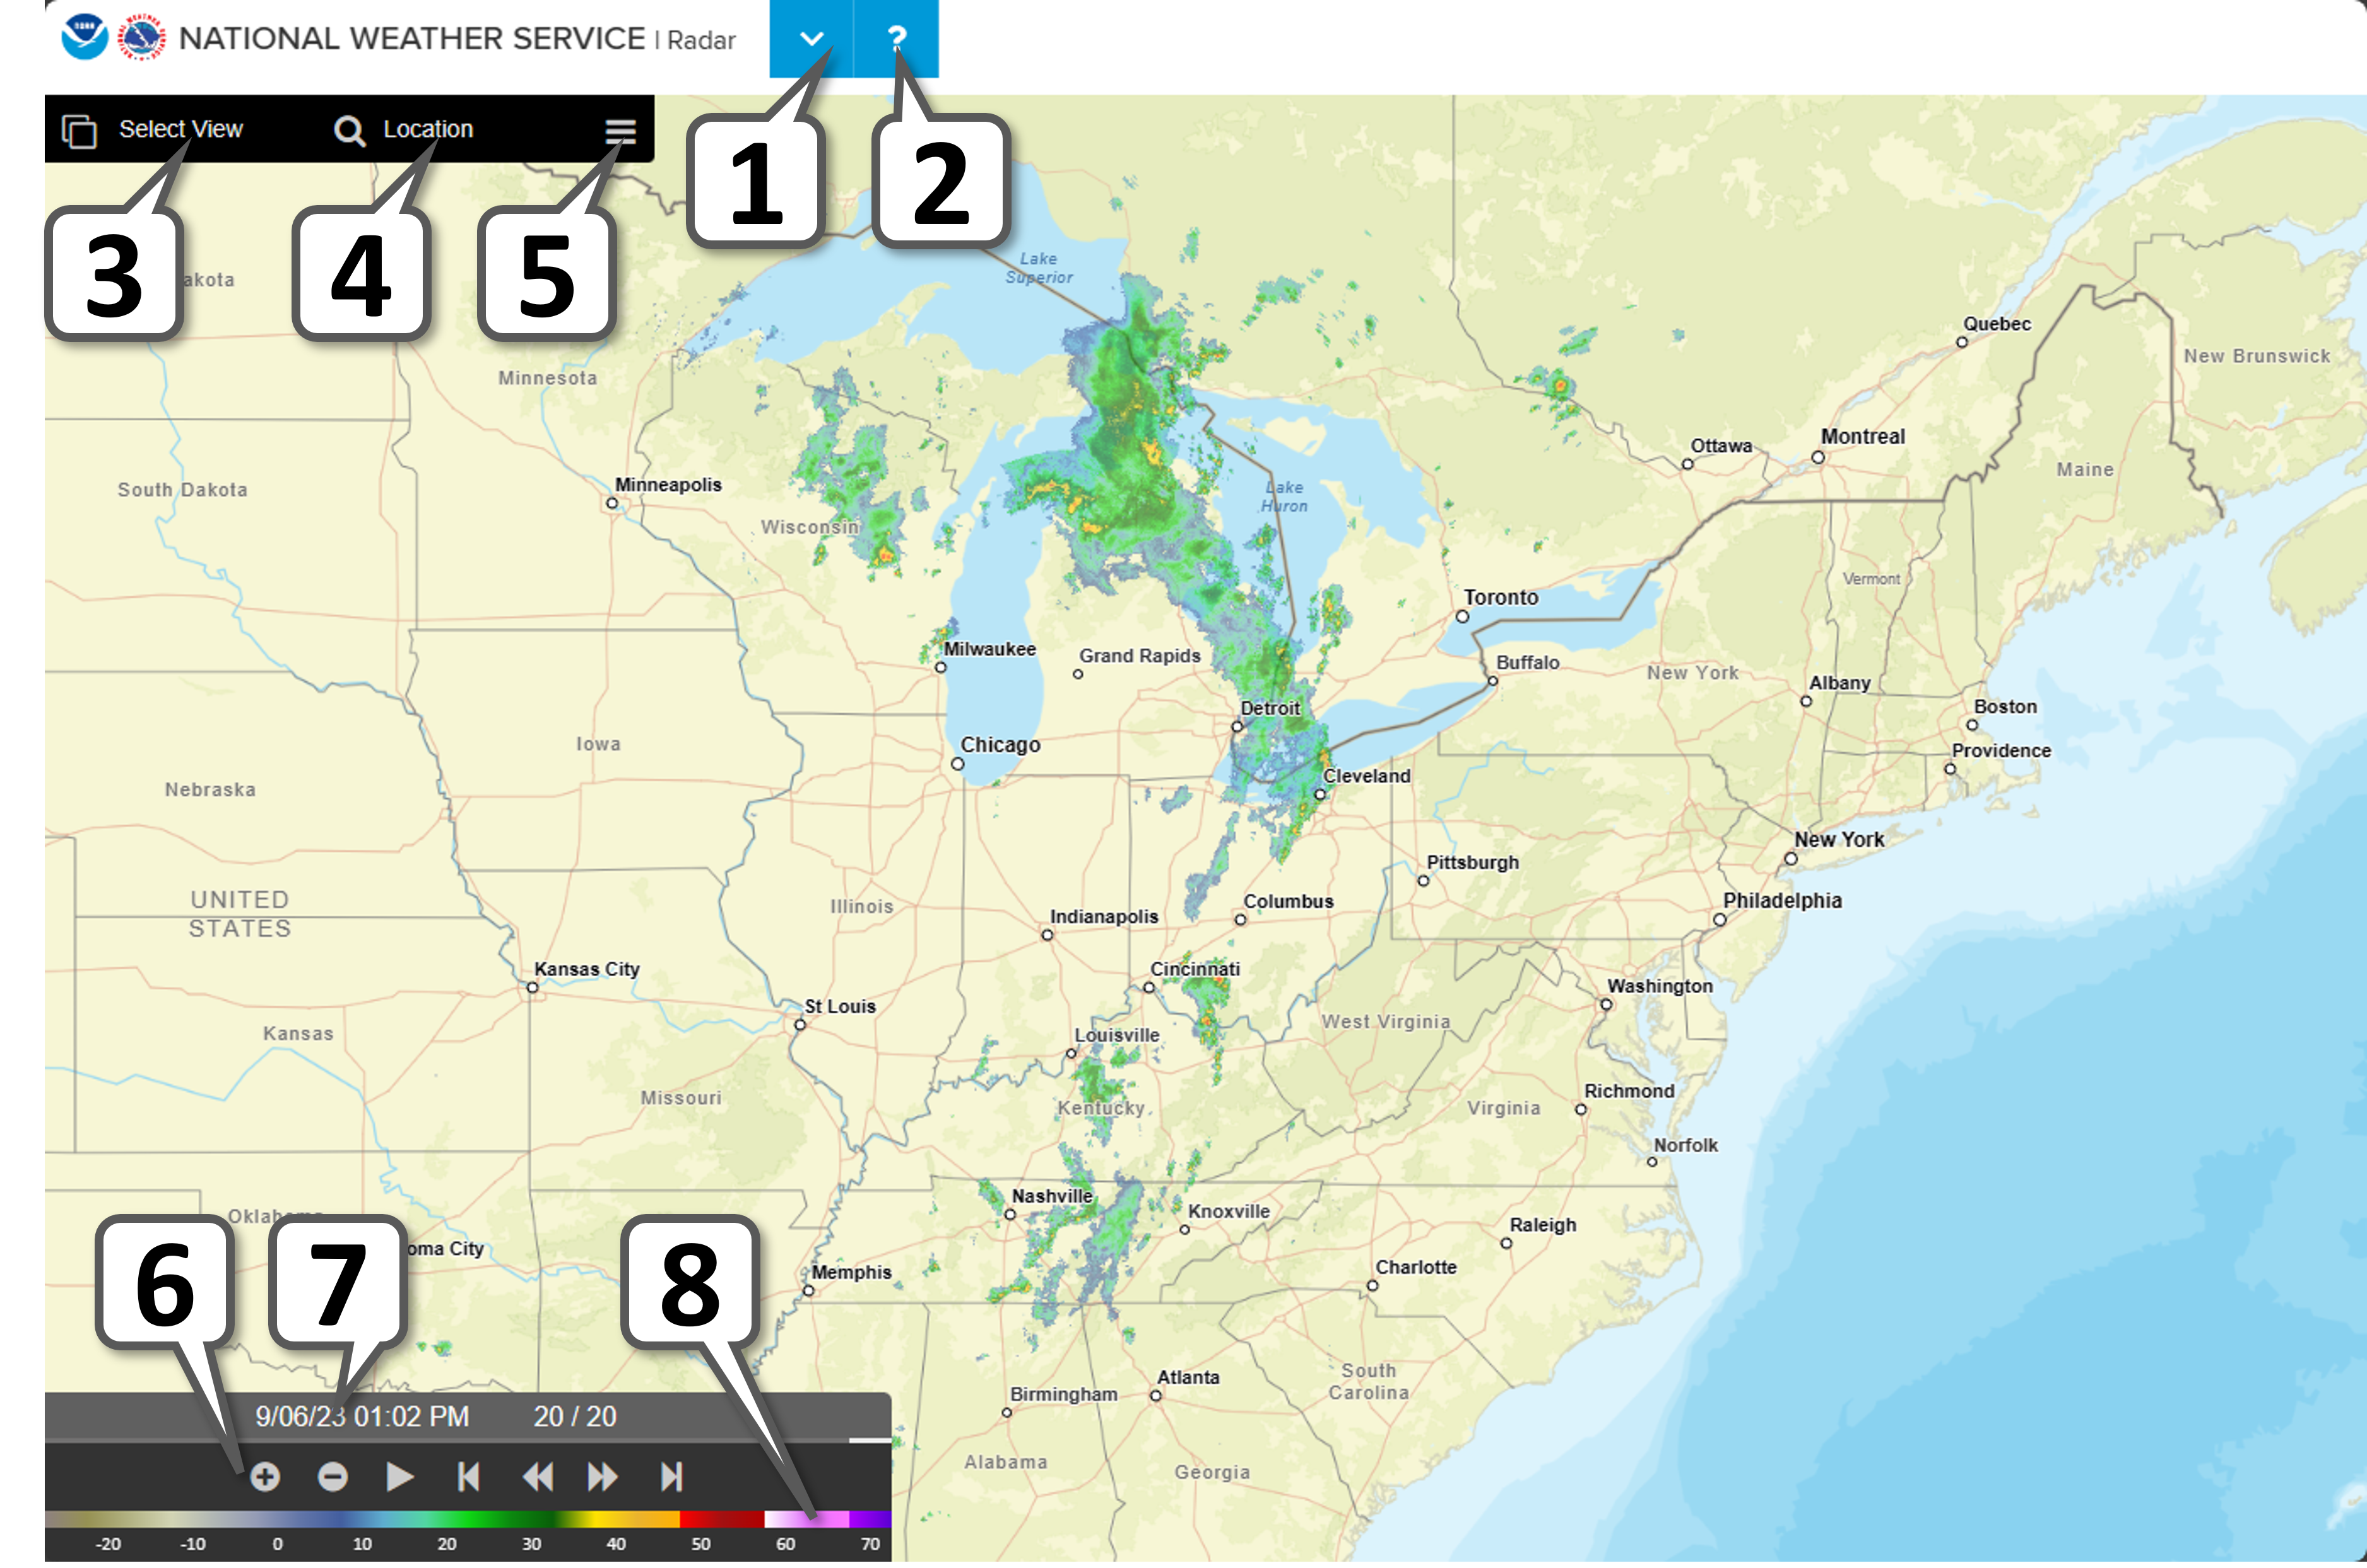
The primary features of the map are:
- Application menu customized for the radar site
- Common help for the National Weather Service sites
- Select a view to customize the map
- Search for a location on the map
- Additional map options
- Map controls (zoom and loop)
- Map time for the selected radar product(s)
- Map legend for the selected radar product(s)
How do I reset the map?
Select the map options  and then choose "Reset Map."

What will no longer be available?
Radar overlays for file downloads:
- Topo, counties, rivers, highways, cities
- Warnings
- Legend
The following radar products were removed per SCN 23-61:
- National Mosaics -
- Raw Base Reflectivity (BREF_RAW)
- Raw Composite Reflectivity (CREF_RAW)
- WSR-88D
- [N0X] Dual-Pol Differential Reflectivity (BDZD)
- [EET] High Resolution Echo Tops (BEET)
- [N0S] Storm Relative Motion (BSRM)
- [STP] Storm Total Precip (BSTP)
- [N0U] Base Velocity (BVEL)
- [HVL] High Resolution VIL (HVIL)
- TDWR
- [NET] Echo Tops (BNET)
- [NVL] VIL (BVIL)
- [NCR] Composite Reflectivity (CREF)
See changes in downloads for more information.
How do I display warnings?
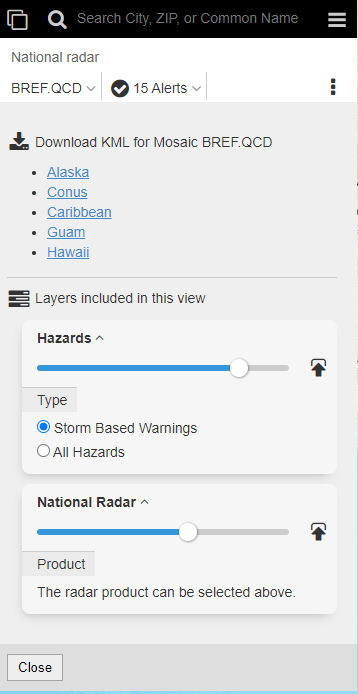
Storm-based warnings display by default on the "National radar mosaic" and "Radar station products" views. You can select to display all warnings on these views by using the view options (three vertical dots).
What products are available?
For national mosaics (Conus, Alaska, Hawaii, Guam and Puerto Rico):
- BREF.QCD (QCd Base Reflectivity)
A display of echo intensity measured in dBZ (with ground clutter / non-precipitation echoes removed). Scientists use these products to detect precipitation, evaluate storm structure, locate boundaries, and determine hail potential. Data values are actual reflectivity values (uses the 0.5 degree elevation) in dBZ.
- CREF.QCD (QCd Composite Reflectivity)
Composite Reflectivity is a display of maximum reflectivity for the total volume within the range of the radar. These products reveal the highest reflectivities in all echoes, examine storm structure features, and determine the intensity of storms. With ground clutter / non-precipitation echoes removed. Data values are in dBZ.
- PCPN.TYP (Precipitation Type)
Algorithm which classifies radar echoes into one of seven categories: 1) warm stratiform rain, 2) cool stratiform rain, 3) convective rain, 4) tropical/stratiform rain mix, 5) tropical/convective rain mix, 6) hail, and 7) snow. The primary use of the SPT is for automatic selection of Z-R relationships and for computing Surface Precipitation Rates (SPRs) from the Seamless Hybrid Scan Reflectivity (SHSR) mosaic.

TC: Tropical Convective TS: Tropical Stratiform CS: Cool Stratiform H: Hail C: Convective S: Snow WS: Warm Stratiform
- NEET.V18 (Echo Tops)
An image of the echo top heights color-coded in user-defined increments in thousands of feet. Scientists use this product for a quick estimation of the most intense convection and higher echo tops, as an aid in identification of storm structure features, and for pilot briefing purposes.

For WSR-88D (NWS, DOD, FAA):
- SR_BREF (Super Resolution Base Reflectivity)
A display of echo intensity measured in dBZ. Scientists use these products to detect precipitation, evaluate storm structure, locate boundaries, and determine hail potential. Data values are actual reflectivity values in dBZ of the 0.5 degree elevation scan.
- SR_BVEL (Super Resolution Base Velocity)
A measure of the radial component of the wind either toward the radar (negative values) or away from the radar (positive values). Cool colors (green) represent negative values and warm colors (red) represent positive values. Scientists use these products to estimate wind speed and direction, locate boundaries, locate severe weather signatures, and identify suspected areas of turbulence. Data values are actual velocity values in knots of the 0.5 degree elevation scan.

- BDHC (N0H) (Dual-Pol Precipitation Type)
Hydrometeor Classification is a computer algorithm output that determines the most likely classification of the targets in the radar volume. The product displays the predefined categories that were most likely the cause of the radar echo at that location.

BI: Biological GC: Clutter IC: Ice Crystals DS: Dry Snow WS: Wet Snow RA: Rain HR: Heavy Rain BD: Big Drops GR: Graupel HA: Hail-Rain UK: Unknown
- BOHA (OHA) (One Hour Precipitation Accumulation)
A display of estimated one-hour precipitation accumulation on a 1.1-nm x 1-degree grid using the Precipitation Processing System (PPS) algorithm. This product assesses rainfall intensities for flash flood warnings, urban flood statements, and special weather statements. These are in inches and uses a dynamic scale, based on precipitation rate.

- BDSA (DTA) (Storm Total Precipitation)
The estimated storm total precipitation accumulation on a 1.1-nm x 1-degree grid continuously updated since the precipitation event began. This product uses the PPS algorithm. Scientists use this product to locate flood potential over urban or rural areas, estimate total basin runoff, and provide rainfall data 24 hours a day. These are in inches and uses a dynamic scale, based on precipitation rate.

For TDWR (FAA):
- BREF (TZL) (Long Range Base Reflectivity)
A display of echo intensity measured in dBZ. These products are used to detect precipitation, evaluate storm structure, locate boundaries, and determine hail potential. Digital Reflectivity data are measured at an elevation angle of 0.6 degrees with a maximum range of 225 nm.
- BREF (TZ0) (Short Range Reflectivity)
A display of echo intensity measured in dBZ. These products are used to detect precipitation, evaluate storm structure, locate boundaries, and determine hail potential. The three lowest elevations angles are available, with a maximum range of 48 nm.
- BVEL (TV0) (Short Range Velocity)
A measure of the radial component of the wind either toward the radar (negative values) or away from the radar (positive values). Cool colors (green) represent negative values and warm colors (red) represent positive values. These products are used to estimate wind speed and direction, locate boundaries, locate severe weather signatures, and identify suspected areas of turbulence. The three lowest elevations angles are available, with a maximum range of 48 nm.
How do I get information on other available OGC GIS Services?
Please visit CloudGIS web services for details on the different OGC compliant services offered.
How do I generate a KML file?
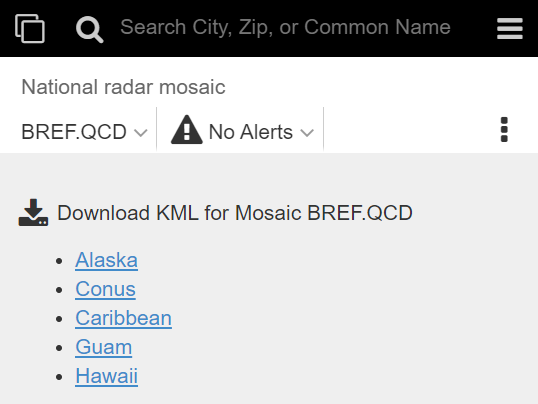
KML is based on the selected view. Select the view options (three vertical dots), and click the link to download the KML if available.
Where can I download files?
Radar geoTIFS are available at https://mrms.ncep.noaa.gov/data/RIDGEII. Warnings can be retrieved from the OGC WMS Services at https://opengeo.ncep.noaa.gov/geoserver. Please see the product availability list above or SCN 23-61 to see the radar products available to be downloaded and the naming conventions.
Why do I get a blank/no image when loading a radar?
This is normally caused by a radar being offline due to maintenance or a repair needed. You can confirm by comparing it to the "National radar mosaic" view or visiting the radar status site. The radar icons for local radar also show which radars are offline. Red radars are down, while blue radars are up and functioning.

To see information about radars may be down, click on a down radar and then look in the radar select/customization dropdown under the radar identifier to see this information (example below).

There also may be an issue where the radar application does not display. If this is the case a user may try to reset their web browsers cache. This can be done in different ways, some of which are listed below depending on your web browser:
- Windows and Linux browsers: CTRL + F5
- Apple Safari: SHIFT + Reload toolbar button
- Chrome and Firefox for Mac: CMD + SHIFT + R
- iPhone/iPad: Settings > Safari > Advanced > Website Data > Edit > weather.gov (delete)
How do I save my preferences?
As you use the radar site, the browser address bar will automatically update with the unique URL that will preserve the options you selected. Simply use your browser bookmark feature to save it for your next visit. On mobile devices, you can also save the bookmark as an icon on the home screen.
Important Note: If an old bookmark was saved to a product that has been removed in the Version 2.0 update the bookmark will default to the Base Reflectivity product.
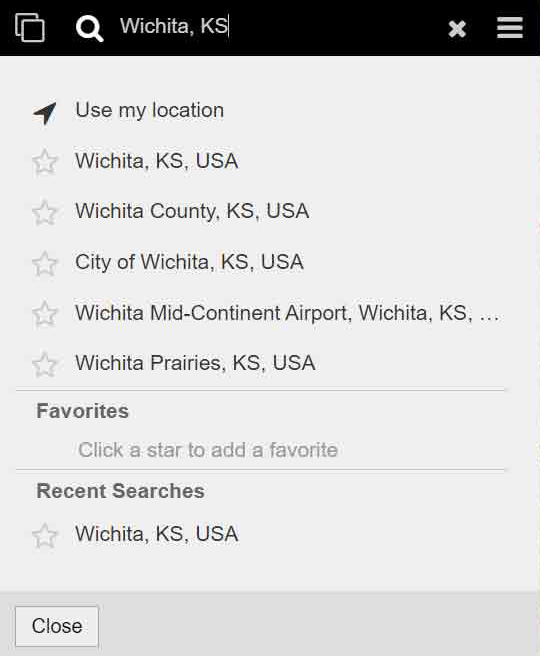
How do I display radar for my location?
If you click the map the site will automatically select the "Weather for your location" view, which includes radar, warnings, and the forecast. You can also search for a specific location by name, zip code, or using geolocation if enabled on your device.
How do I consume OGC compliant service in my own application?
The OGC compliant services are available from the IDPGIS GeoServer.
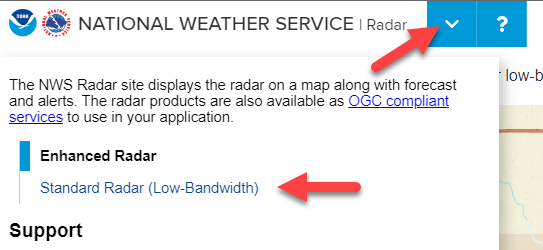
How can I get standard radar/animated GIF's (for low bandwidth users)?
Link to the standard radar images: CONUS Standard Radar Page.
Standard radar pages can also be accessed by clicking the blue arrow (the application menu) just to the left of the "?" at the top of the page and selecting "Standard Radar (low-bandwidth)". If a local radar is being viewed on the Enhanced page, this action will take the user directly to the Standard radar page for that radar rather than the CONUS view.
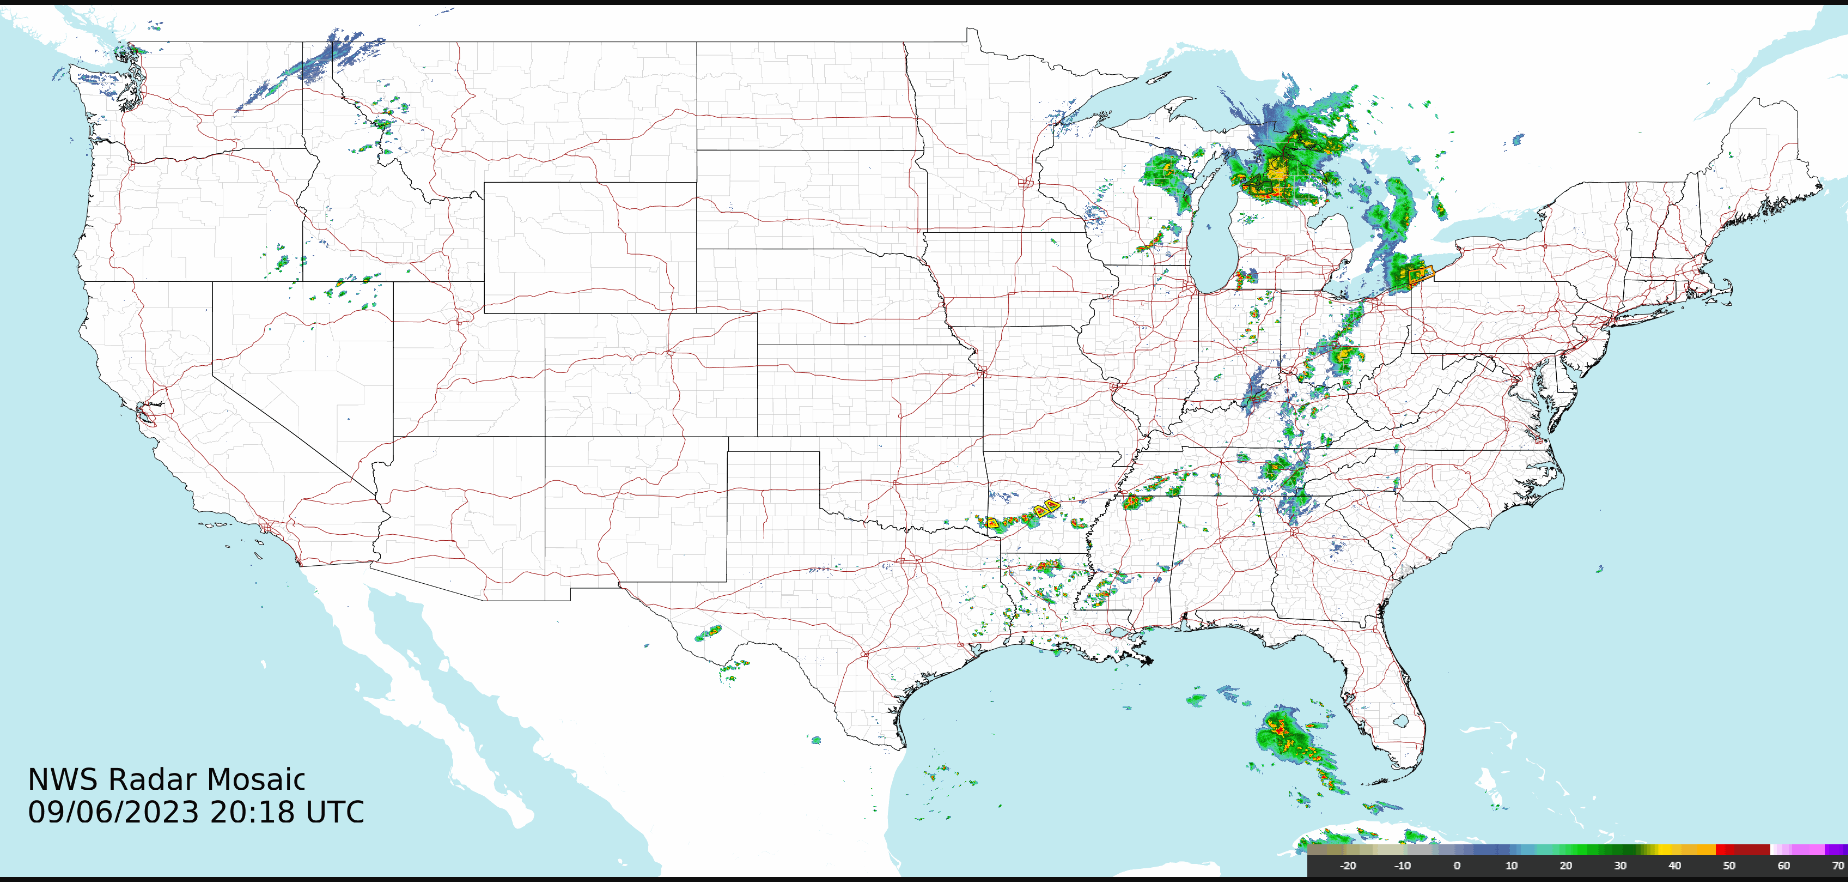
The animated LARGE CONUS Standard Edition is available at this link.
Video tutorials
These tutorials were developed in 2020 with Version 1.0 of RIDGE II.

