National Weather Service United States Department of Commerce

 
3 Day (72 Hour) Snow/Sleet Amount Potential
Official NWS Forecast Snowfall Totals
The "Point" map is the official NWS snowfall forecast in inches during the time period shown on the graphic. This snowfall amount is determined by NWS forecasters to be the most likely outcome based on evaluation of data from computer models, satellite, radar, and other observations. Note that forecast snow amounts also includes sleet.

The "Range" map is the 25th percentile (lower number) to 75th percentile (higher number) of possible snowfall amounts based on the National Blend of Models (NBM) output during the time period of the graphic. The official NWS snowfall forecast influences this range of values either up or down depending upon how closely they match.
High End Amount

1 in 10 Chance (10%) of Higher Snowfall

Maximum Potential Snow Accumulation What's this?
Low End Amount

9 in 10 Chance (90%) of Higher Snowfall

Minimum Potential Snow Accumulation What's this?
Percent Chance That Snowfall Amounts Will Be Greater Than...
Hover over thumbnails below to view larger image.
What's this?
>=0.1"
>=0.1"
>=1"
>=1"
>=2"
>=2"
>=4"
>=4"
>=6"
>=6"
>=8"
>=8"
>=12"
>=12"
>=18"
>=18"
Probability Graphic
Snowfall Totals by Location
These tables show the Snowfall forecast for individual locations. The tables provide the same information as the maps on this web page, just shown in a different way. All of these values are valid for the same time period as depicted on the graphics.
Location Low-End
Amount
Expected
Amount
High-End
Amount
Chance of Seeing More Than
3 Day (72 Hour) Snow/Sleet Amount Potential
Official NWS Forecast Snowfall Totals
The "Point" map is the official NWS snowfall forecast in inches during the time period shown on the graphic. This snowfall amount is determined by NWS forecasters to be the most likely outcome based on evaluation of data from computer models, satellite, radar, and other observations. Note that forecast snow amounts also includes sleet.

The "Range" map is the 25th percentile (lower number) to 75th percentile (higher number) of possible snowfall amounts based on the National Blend of Models (NBM) output during the time period of the graphic. The official NWS snowfall forecast influences this range of values either up or down depending upon how closely they match.
High End Amount

1 in 10 Chance (10%) of Higher Snowfall

Maximum Potential Snow Accumulation What's this?
Low End Amount

9 in 10 Chance (90%) of Higher Snowfall

Minimum Potential Snow Accumulation What's this?
Percent Chance That Snowfall Amounts Will Be Greater Than...
Hover over thumbnails below to view larger image.
What's this?
>=0.1"
>=0.1"
>=1"
>=1"
>=2"
>=2"
>=4"
>=4"
>=6"
>=6"
>=8"
>=8"
>=12"
>=12"
>=18"
>=18"
Probability Graphic
3 Day (72 Hour) Snow/Sleet Amount Potential
Official NWS Forecast Snowfall Totals
The "Point" map is the official NWS snowfall forecast in inches during the time period shown on the graphic. This snowfall amount is determined by NWS forecasters to be the most likely outcome based on evaluation of data from computer models, satellite, radar, and other observations. Note that forecast snow amounts also includes sleet.

The "Range" map is the 25th percentile (lower number) to 75th percentile (higher number) of possible snowfall amounts based on the National Blend of Models (NBM) output during the time period of the graphic. The official NWS snowfall forecast influences this range of values either up or down depending upon how closely they match.
High End Amount

1 in 10 Chance (10%) of Higher Snowfall

Maximum Potential Snow Accumulation What's this?
Low End Amount

9 in 10 Chance (90%) of Higher Snowfall

Minimum Potential Snow Accumulation What's this?
Percent Chance That Snowfall Amounts Will Be Greater Than...
Hover over thumbnails below to view larger image.
What's this?
>=0.1"
>=0.1"
>=1"
>=1"
>=2"
>=2"
>=4"
>=4"
>=6"
>=6"
>=8"
>=8"
>=12"
>=12"
>=18"
>=18"
Probability Graphic
3 Day (72 Hour) Snow/Sleet Amount Potential
Official NWS Forecast Snowfall Totals
The "Point" map is the official NWS snowfall forecast in inches during the time period shown on the graphic. This snowfall amount is determined by NWS forecasters to be the most likely outcome based on evaluation of data from computer models, satellite, radar, and other observations. Note that forecast snow amounts also includes sleet.

The "Range" map is the 25th percentile (lower number) to 75th percentile (higher number) of possible snowfall amounts based on the National Blend of Models (NBM) output during the time period of the graphic. The official NWS snowfall forecast influences this range of values either up or down depending upon how closely they match.
High End Amount

1 in 10 Chance (10%) of Higher Snowfall

Maximum Potential Snow Accumulation What's this?
Low End Amount

9 in 10 Chance (90%) of Higher Snowfall

Minimum Potential Snow Accumulation What's this?
Percent Chance That Snowfall Amounts Will Be Greater Than...
Hover over thumbnails below to view larger image.
What's this?
>=0.1"
>=0.1"
>=1"
>=1"
>=2"
>=2"
>=4"
>=4"
>=6"
>=6"
>=8"
>=8"
>=12"
>=12"
>=18"
>=18"
Probability Graphic
3 Day (72 Hour) Ice Accumulation Potential
Official NWS Forecast Ice Accumulation Totals
The "Point" map is the official NWS ice accumulation forecast in inches during the time period shown on the graphic. This ice accumulation amount is determined by NWS forecasters to be the most likely outcome based on evaluation of data from computer models, satellite, radar, and other observations.

The "Range" map is the 25th percentile (lower number) to 75th percentile (higher number) of possible ice accumulation amounts based on the Weather Prediction Center (WPC) Super Ensemble output during the time period of the graphic. The official NWS ice accumulation forecast influences this range of values either up or down depending upon how closely they match.
High End Amount

1 in 10 Chance (10%) of Higher Ice Accumulation

Maximum Potential Snow Accumulation What's this?
Low End Amount

9 in 10 Chance (90%) of Higher Ice Accumulation

Minimum Potential Snow Accumulation What's this?
Percent Chance That Ice Accumulation Amounts Will Be Greater Than...
Hover over thumbnails below to view larger image.
What's this?
>=0.01"
>=0.01"
>=0.1"
>=0.1"
>=0.25"
>=0.25"
>=0.5"
>=0.5"
>=0.75"
>=0.75"
>=1"
>=1"
>=1.25"
>=1.25"
>=1.5"
>=1.5"
Probability Graphic
Ice Accumulation Totals by Location
These tables show the ice accumulation forecast for individual locations. The tables provide the same information as the maps on this web page, just shown in a different way. All of these values are valid for the same time period as depicted on the graphics.
Location Low-End
Amount
Expected
Amount
High-End
Amount
Chance of Seeing More Than
3 Day (72 Hour) Ice Accumulation Potential
Official NWS Forecast Ice Accumulation Totals
The "Point" map is the official NWS ice accumulation forecast in inches during the time period shown on the graphic. This ice accumulation amount is determined by NWS forecasters to be the most likely outcome based on evaluation of data from computer models, satellite, radar, and other observations.

The "Range" map is the 25th percentile (lower number) to 75th percentile (higher number) of possible ice accumulation amounts based on the Weather Prediction Center (WPC) Super Ensemble output during the time period of the graphic. The official NWS ice accumulation forecast influences this range of values either up or down depending upon how closely they match.
High End Amount

1 in 10 Chance (10%) of Higher Ice Accumulation

Maximum Potential Snow Accumulation What's this?
Low End Amount

9 in 10 Chance (90%) of Higher Ice Accumulation

Minimum Potential Snow Accumulation What's this?
Percent Chance That Ice Accumulation Amounts Will Be Greater Than...
Hover over thumbnails below to view larger image.
What's this?
>=0.01"
>=0.01"
>=0.1"
>=0.1"
>=0.25"
>=0.25"
>=0.5"
>=0.5"
>=0.75"
>=0.75"
>=1"
>=1"
>=1.25"
>=1.25"
>=1.5"
>=1.5"
Probability Graphic
3 Day (72 Hour) Ice Accumulation Potential
Official NWS Forecast Ice Accumulation Totals
The "Point" map is the official NWS ice accumulation forecast in inches during the time period shown on the graphic. This ice accumulation amount is determined by NWS forecasters to be the most likely outcome based on evaluation of data from computer models, satellite, radar, and other observations.

The "Range" map is the 25th percentile (lower number) to 75th percentile (higher number) of possible ice accumulation amounts based on the Weather Prediction Center (WPC) Super Ensemble output during the time period of the graphic. The official NWS ice accumulation forecast influences this range of values either up or down depending upon how closely they match.
High End Amount

1 in 10 Chance (10%) of Higher Ice Accumulation

Maximum Potential Snow Accumulation What's this?
Low End Amount

9 in 10 Chance (90%) of Higher Ice Accumulation

Minimum Potential Snow Accumulation What's this?
Percent Chance That Ice Accumulation Amounts Will Be Greater Than...
Hover over thumbnails below to view larger image.
What's this?
>=0.01"
>=0.01"
>=0.1"
>=0.1"
>=0.25"
>=0.25"
>=0.5"
>=0.5"
>=0.75"
>=0.75"
>=1"
>=1"
>=1.25"
>=1.25"
>=1.5"
>=1.5"
Probability Graphic
3 Day (72 Hour) Ice Accumulation Potential
Official NWS Forecast Ice Accumulation Totals
The "Point" map is the official NWS ice accumulation forecast in inches during the time period shown on the graphic. This ice accumulation amount is determined by NWS forecasters to be the most likely outcome based on evaluation of data from computer models, satellite, radar, and other observations.

The "Range" map is the 25th percentile (lower number) to 75th percentile (higher number) of possible ice accumulation amounts based on the Weather Prediction Center (WPC) Super Ensemble output during the time period of the graphic. The official NWS ice accumulation forecast influences this range of values either up or down depending upon how closely they match.
High End Amount

1 in 10 Chance (10%) of Higher Ice Accumulation

Maximum Potential Snow Accumulation What's this?
Low End Amount

9 in 10 Chance (90%) of Higher Ice Accumulation

Minimum Potential Snow Accumulation What's this?
Percent Chance That Ice Accumulation Amounts Will Be Greater Than...
Hover over thumbnails below to view larger image.
What's this?
>=0.01"
>=0.01"
>=0.1"
>=0.1"
>=0.25"
>=0.25"
>=0.5"
>=0.5"
>=0.75"
>=0.75"
>=1"
>=1"
>=1.25"
>=1.25"
>=1.5"
>=1.5"
Probability Graphic
Onset of Wintry Precipitation
End Timing of Wintry Precipitation
National Snowfall Reports/Analysis
Local Snow Reports
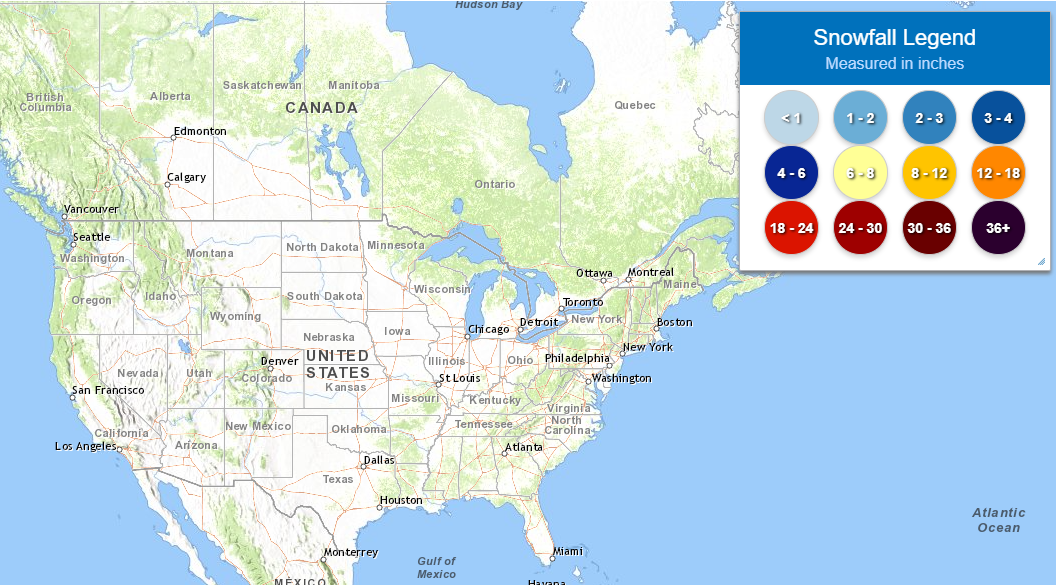
National Snow Reports
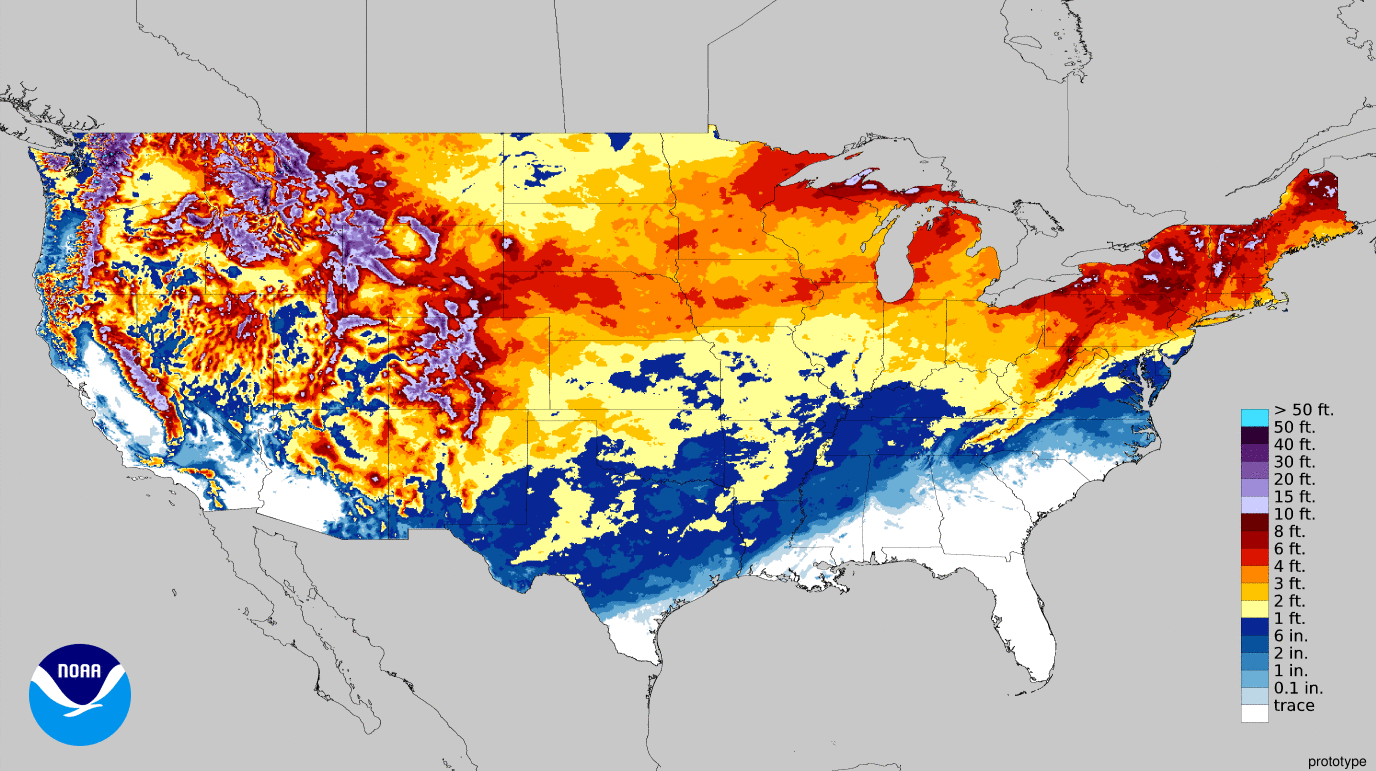
National Snowfall Analysis
Report Snow/Ice to the National Weather Service
mPING
Snow/Rain Reports via MPING
WPC Extended Winter Weather Outlook
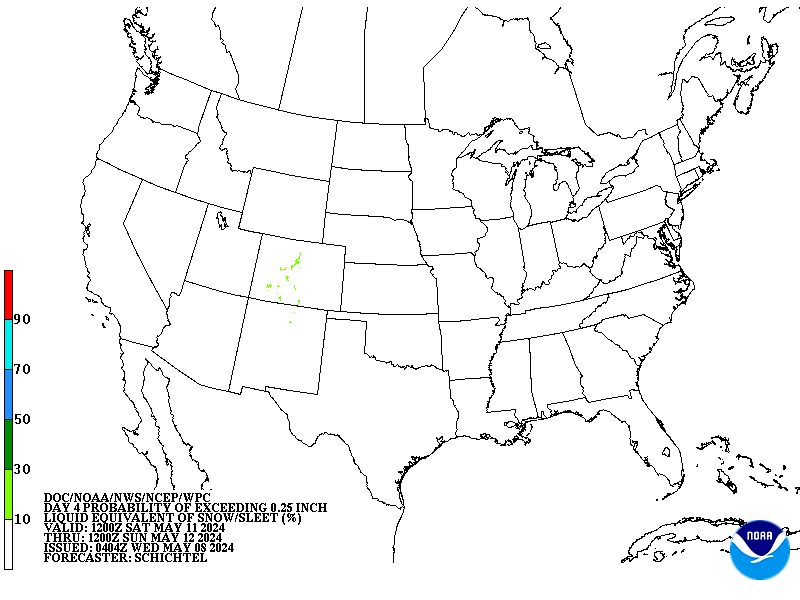
Day 4 Winter Weather Outlook
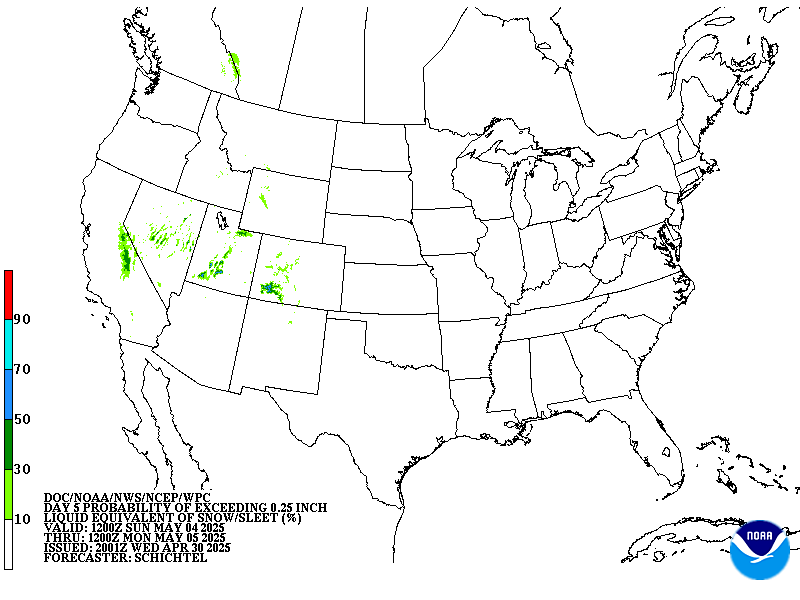
Day 5 Winter Weather Outlook
Day 6 Winter Weather Outlook
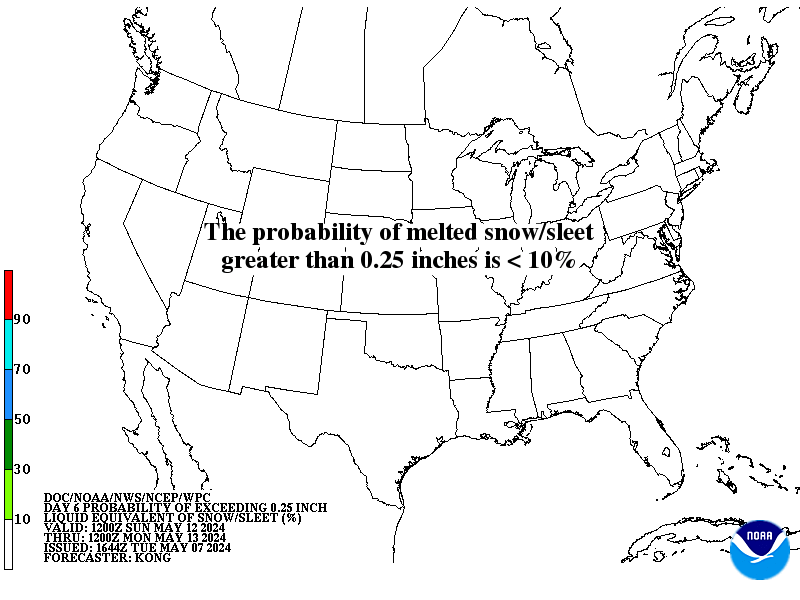
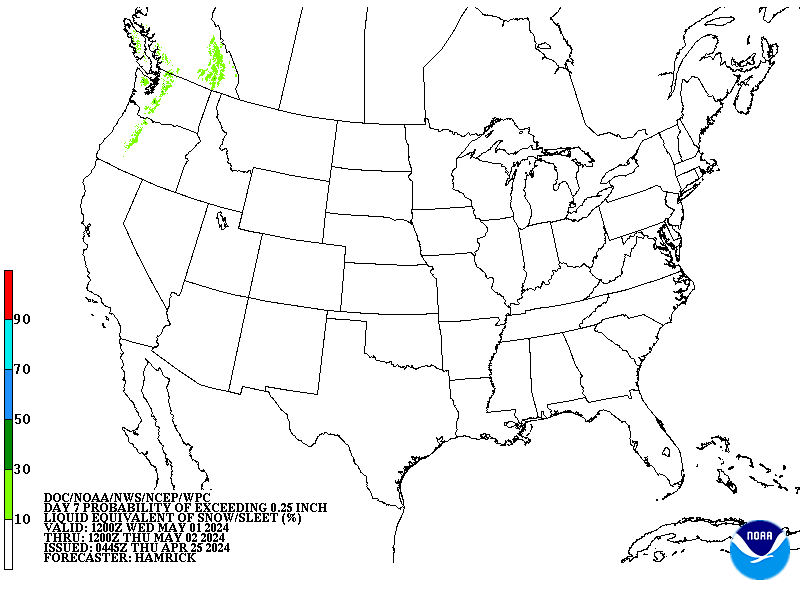
Day 7 Winter Weather Outlook

Click here for an interactive map

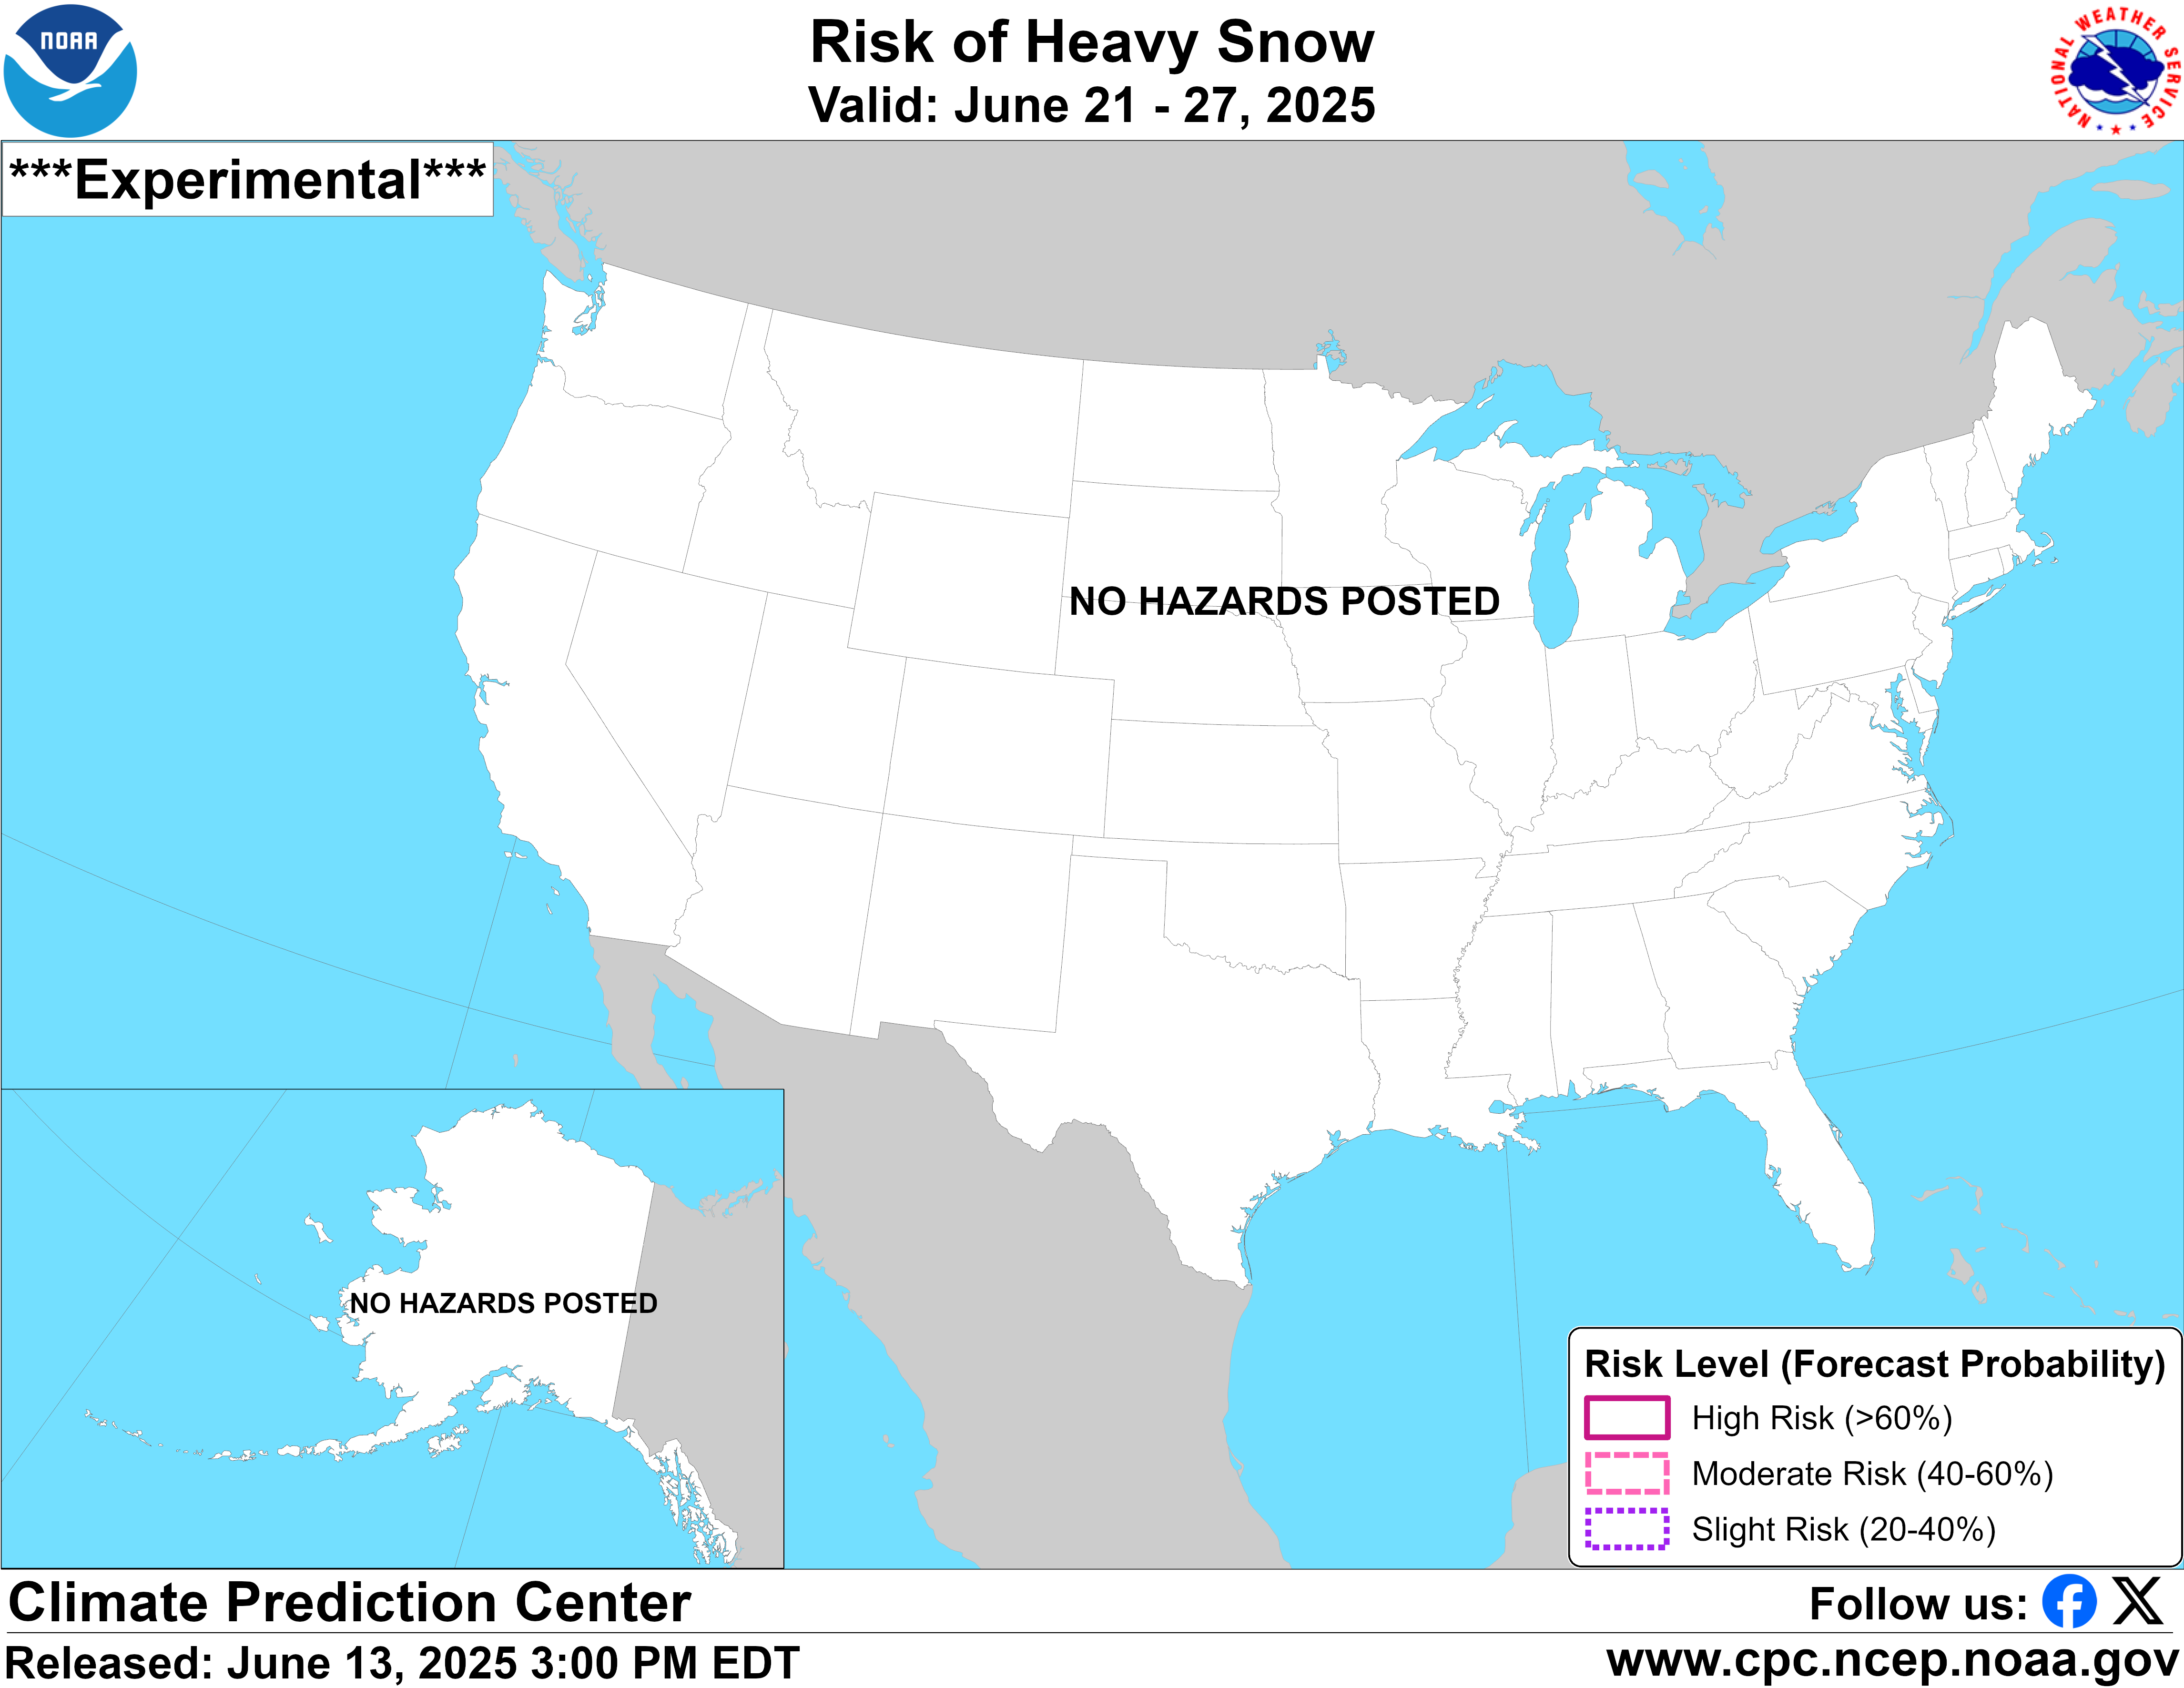
CPC Week-2 Experimental Heavy Snow Risk
CPC Temperature & Precipitation Maps
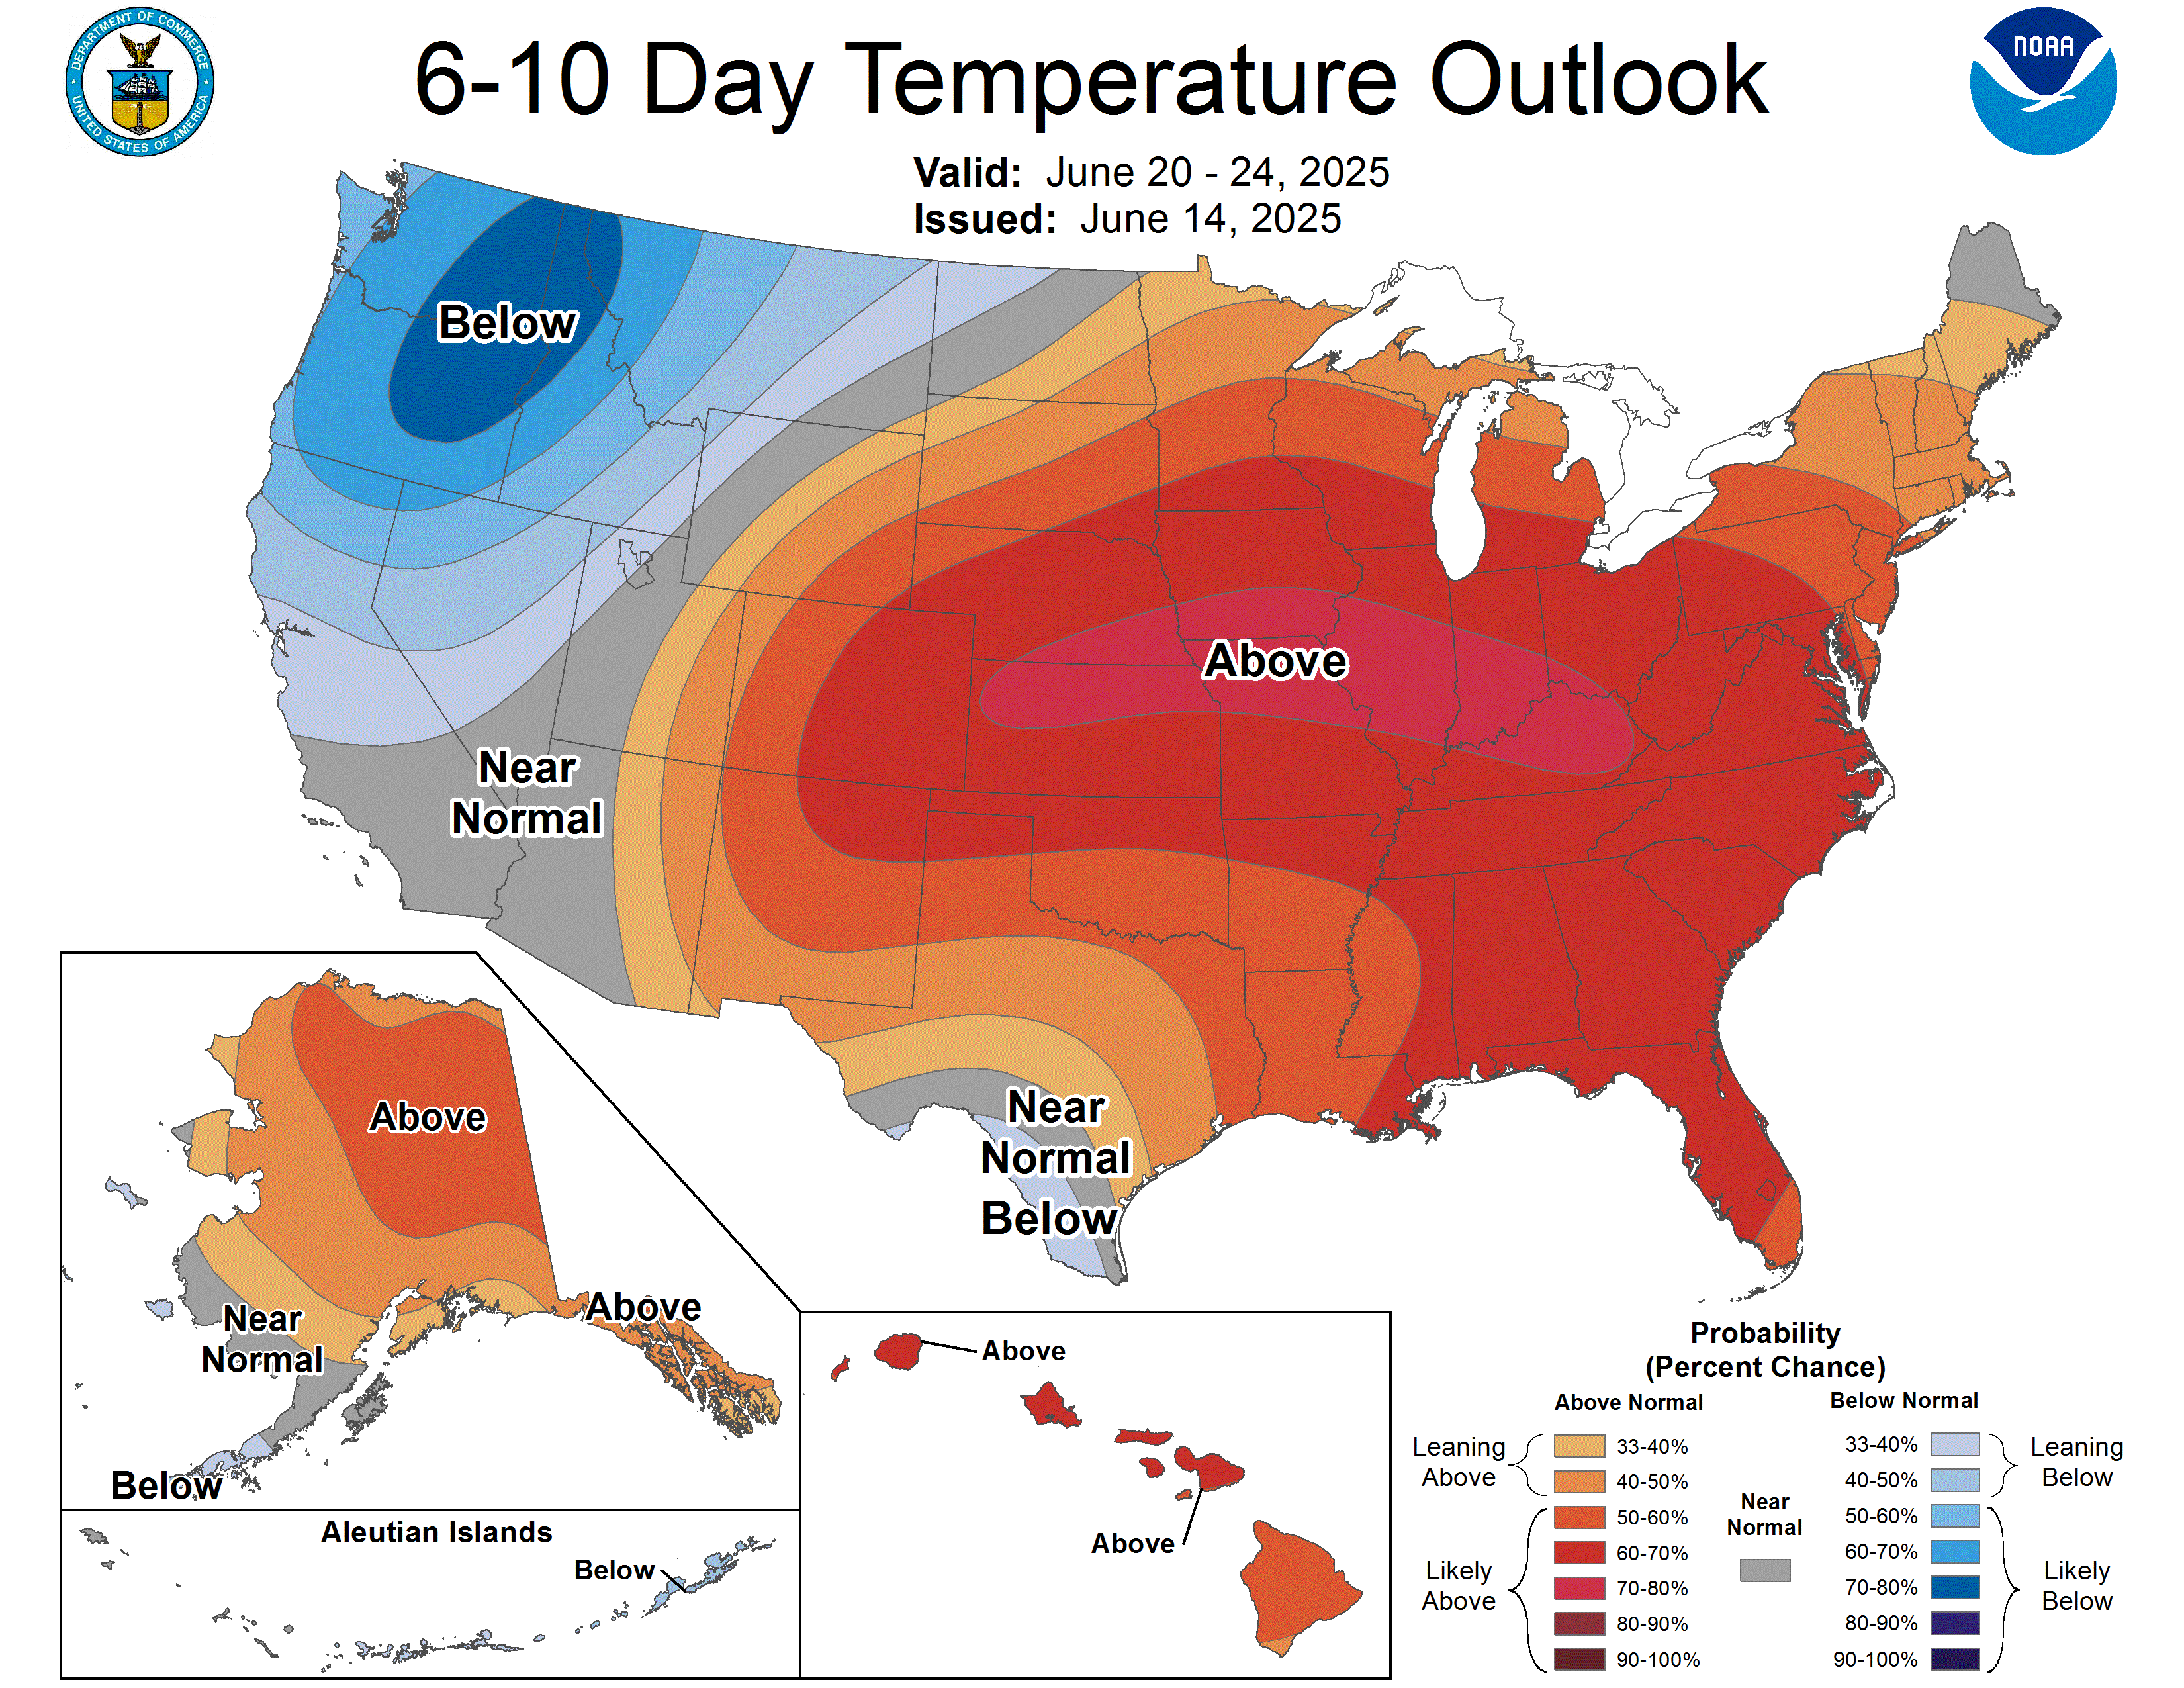
Days 6-10 Temperature
Days 6-10 Temperature Outlook
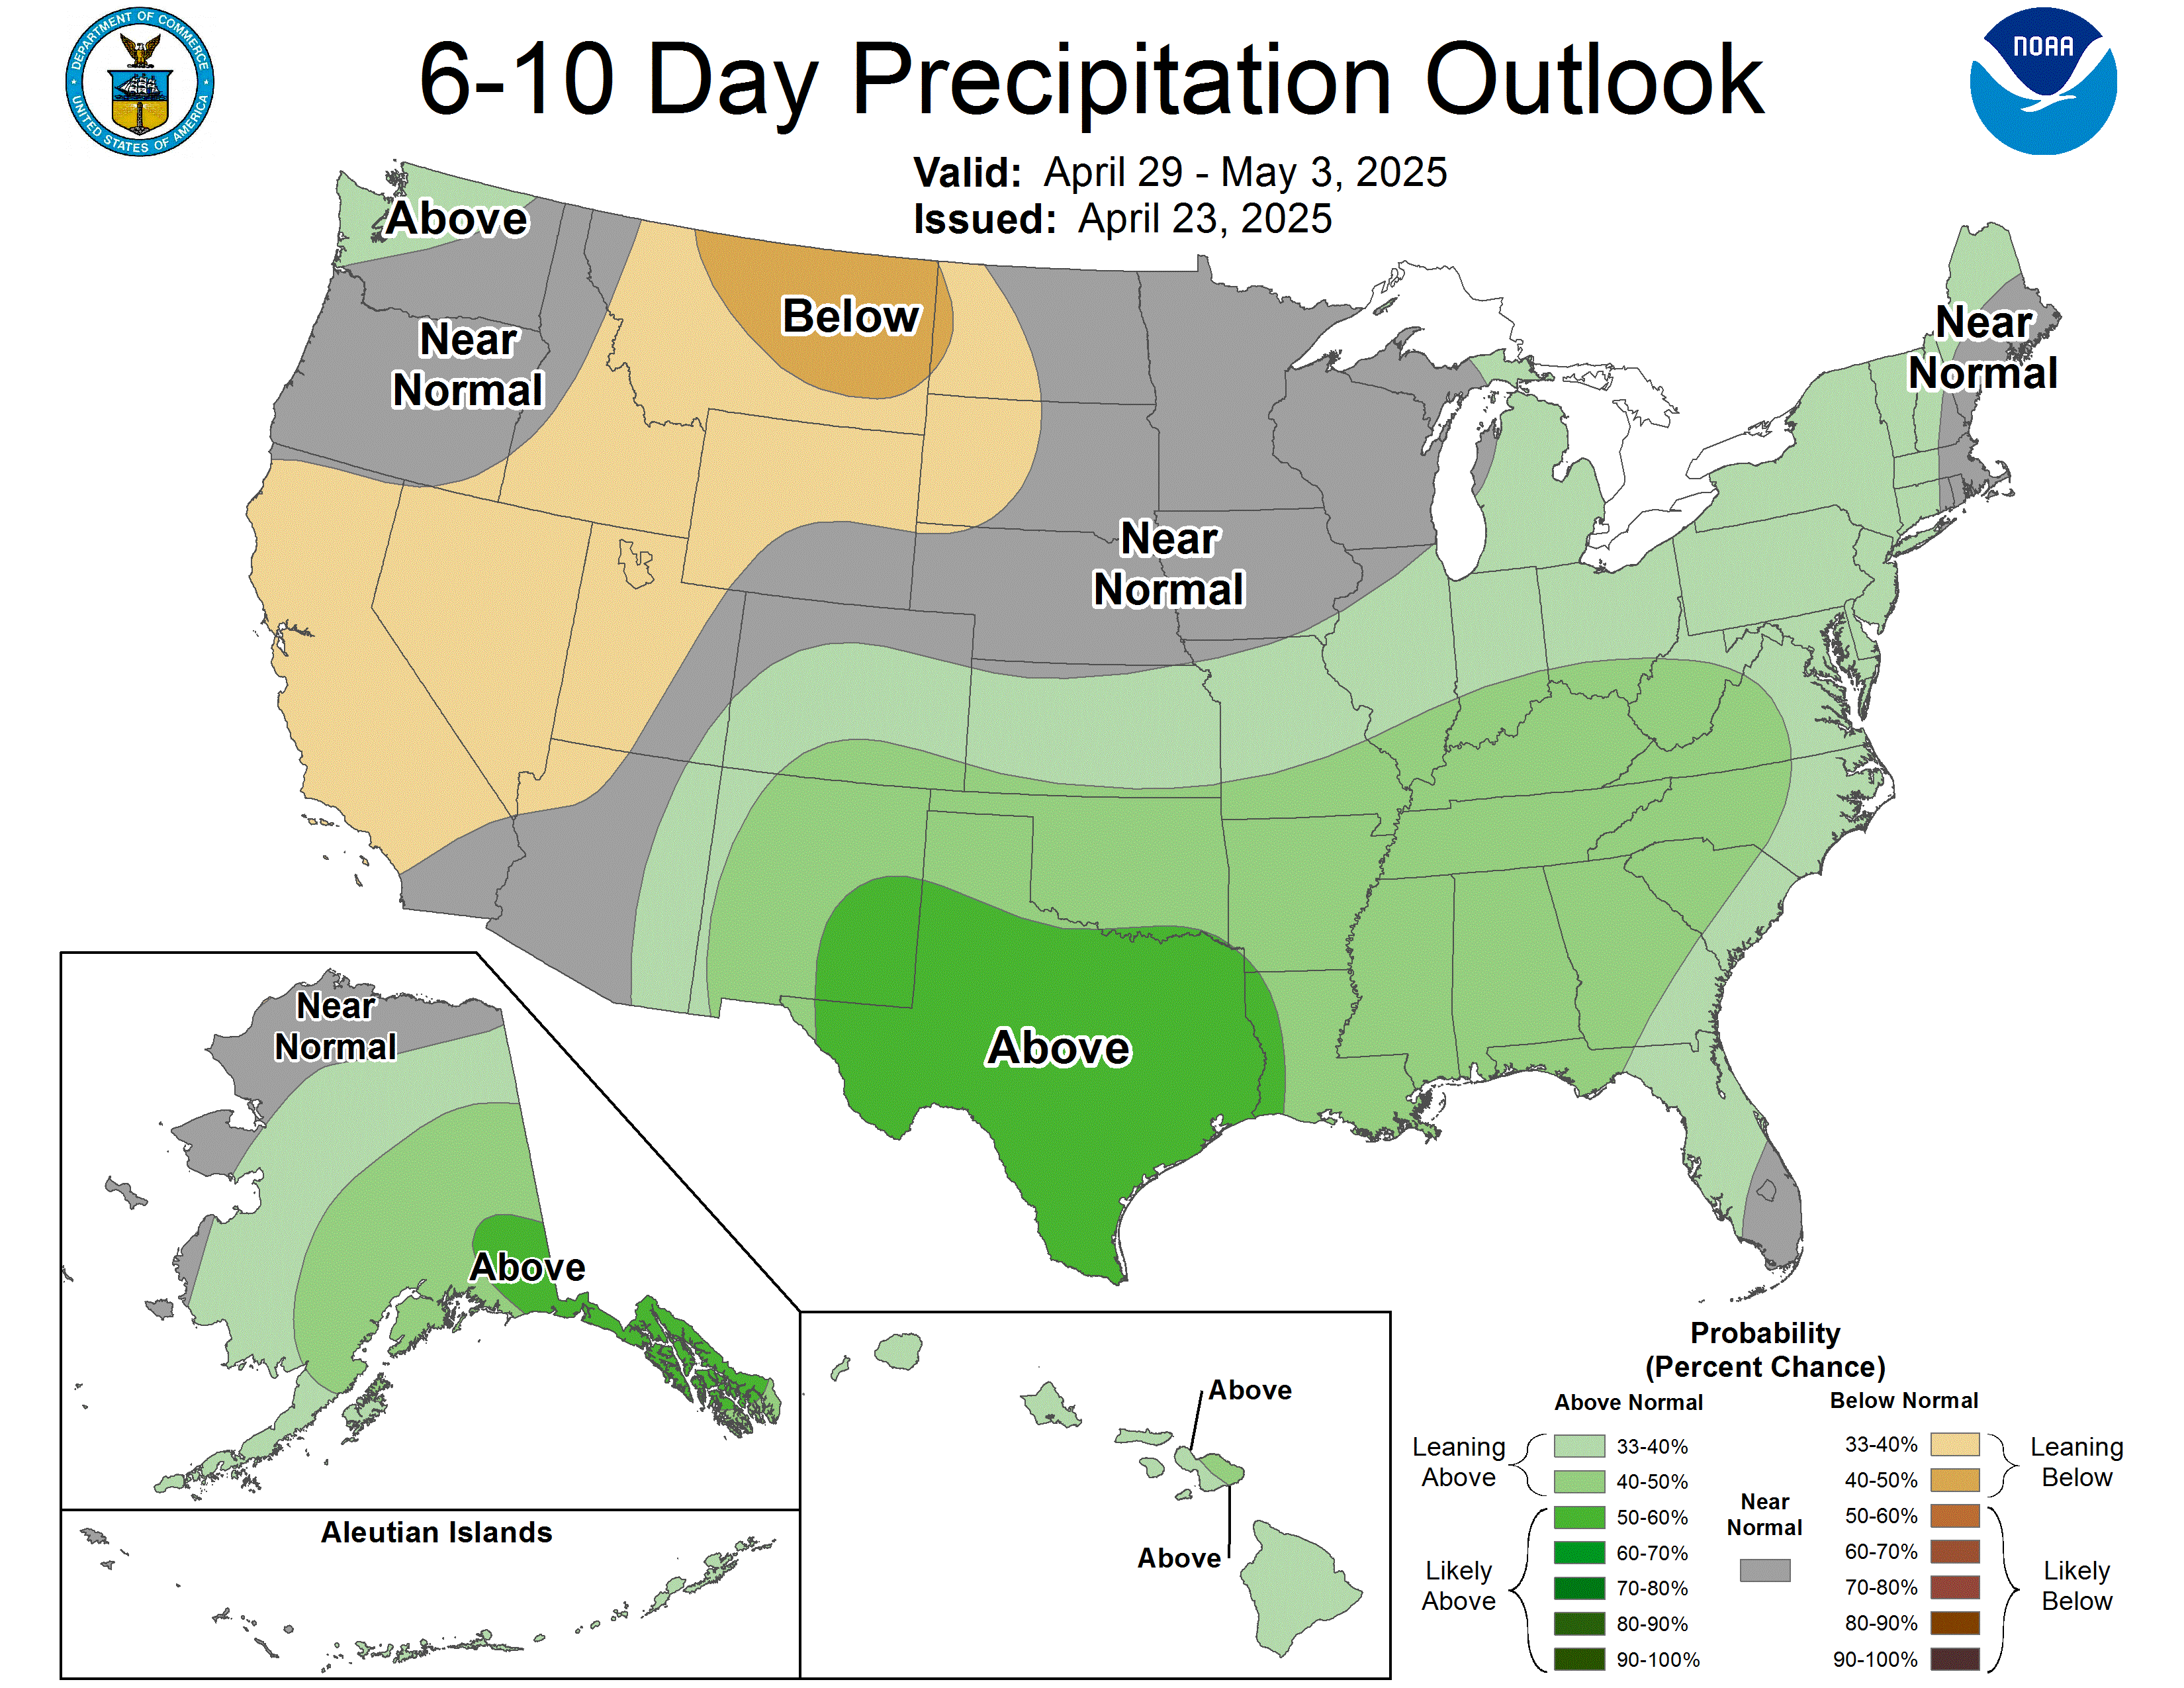
Days 6-10 Precipitation
Days 6-10 Precipitation Outlook
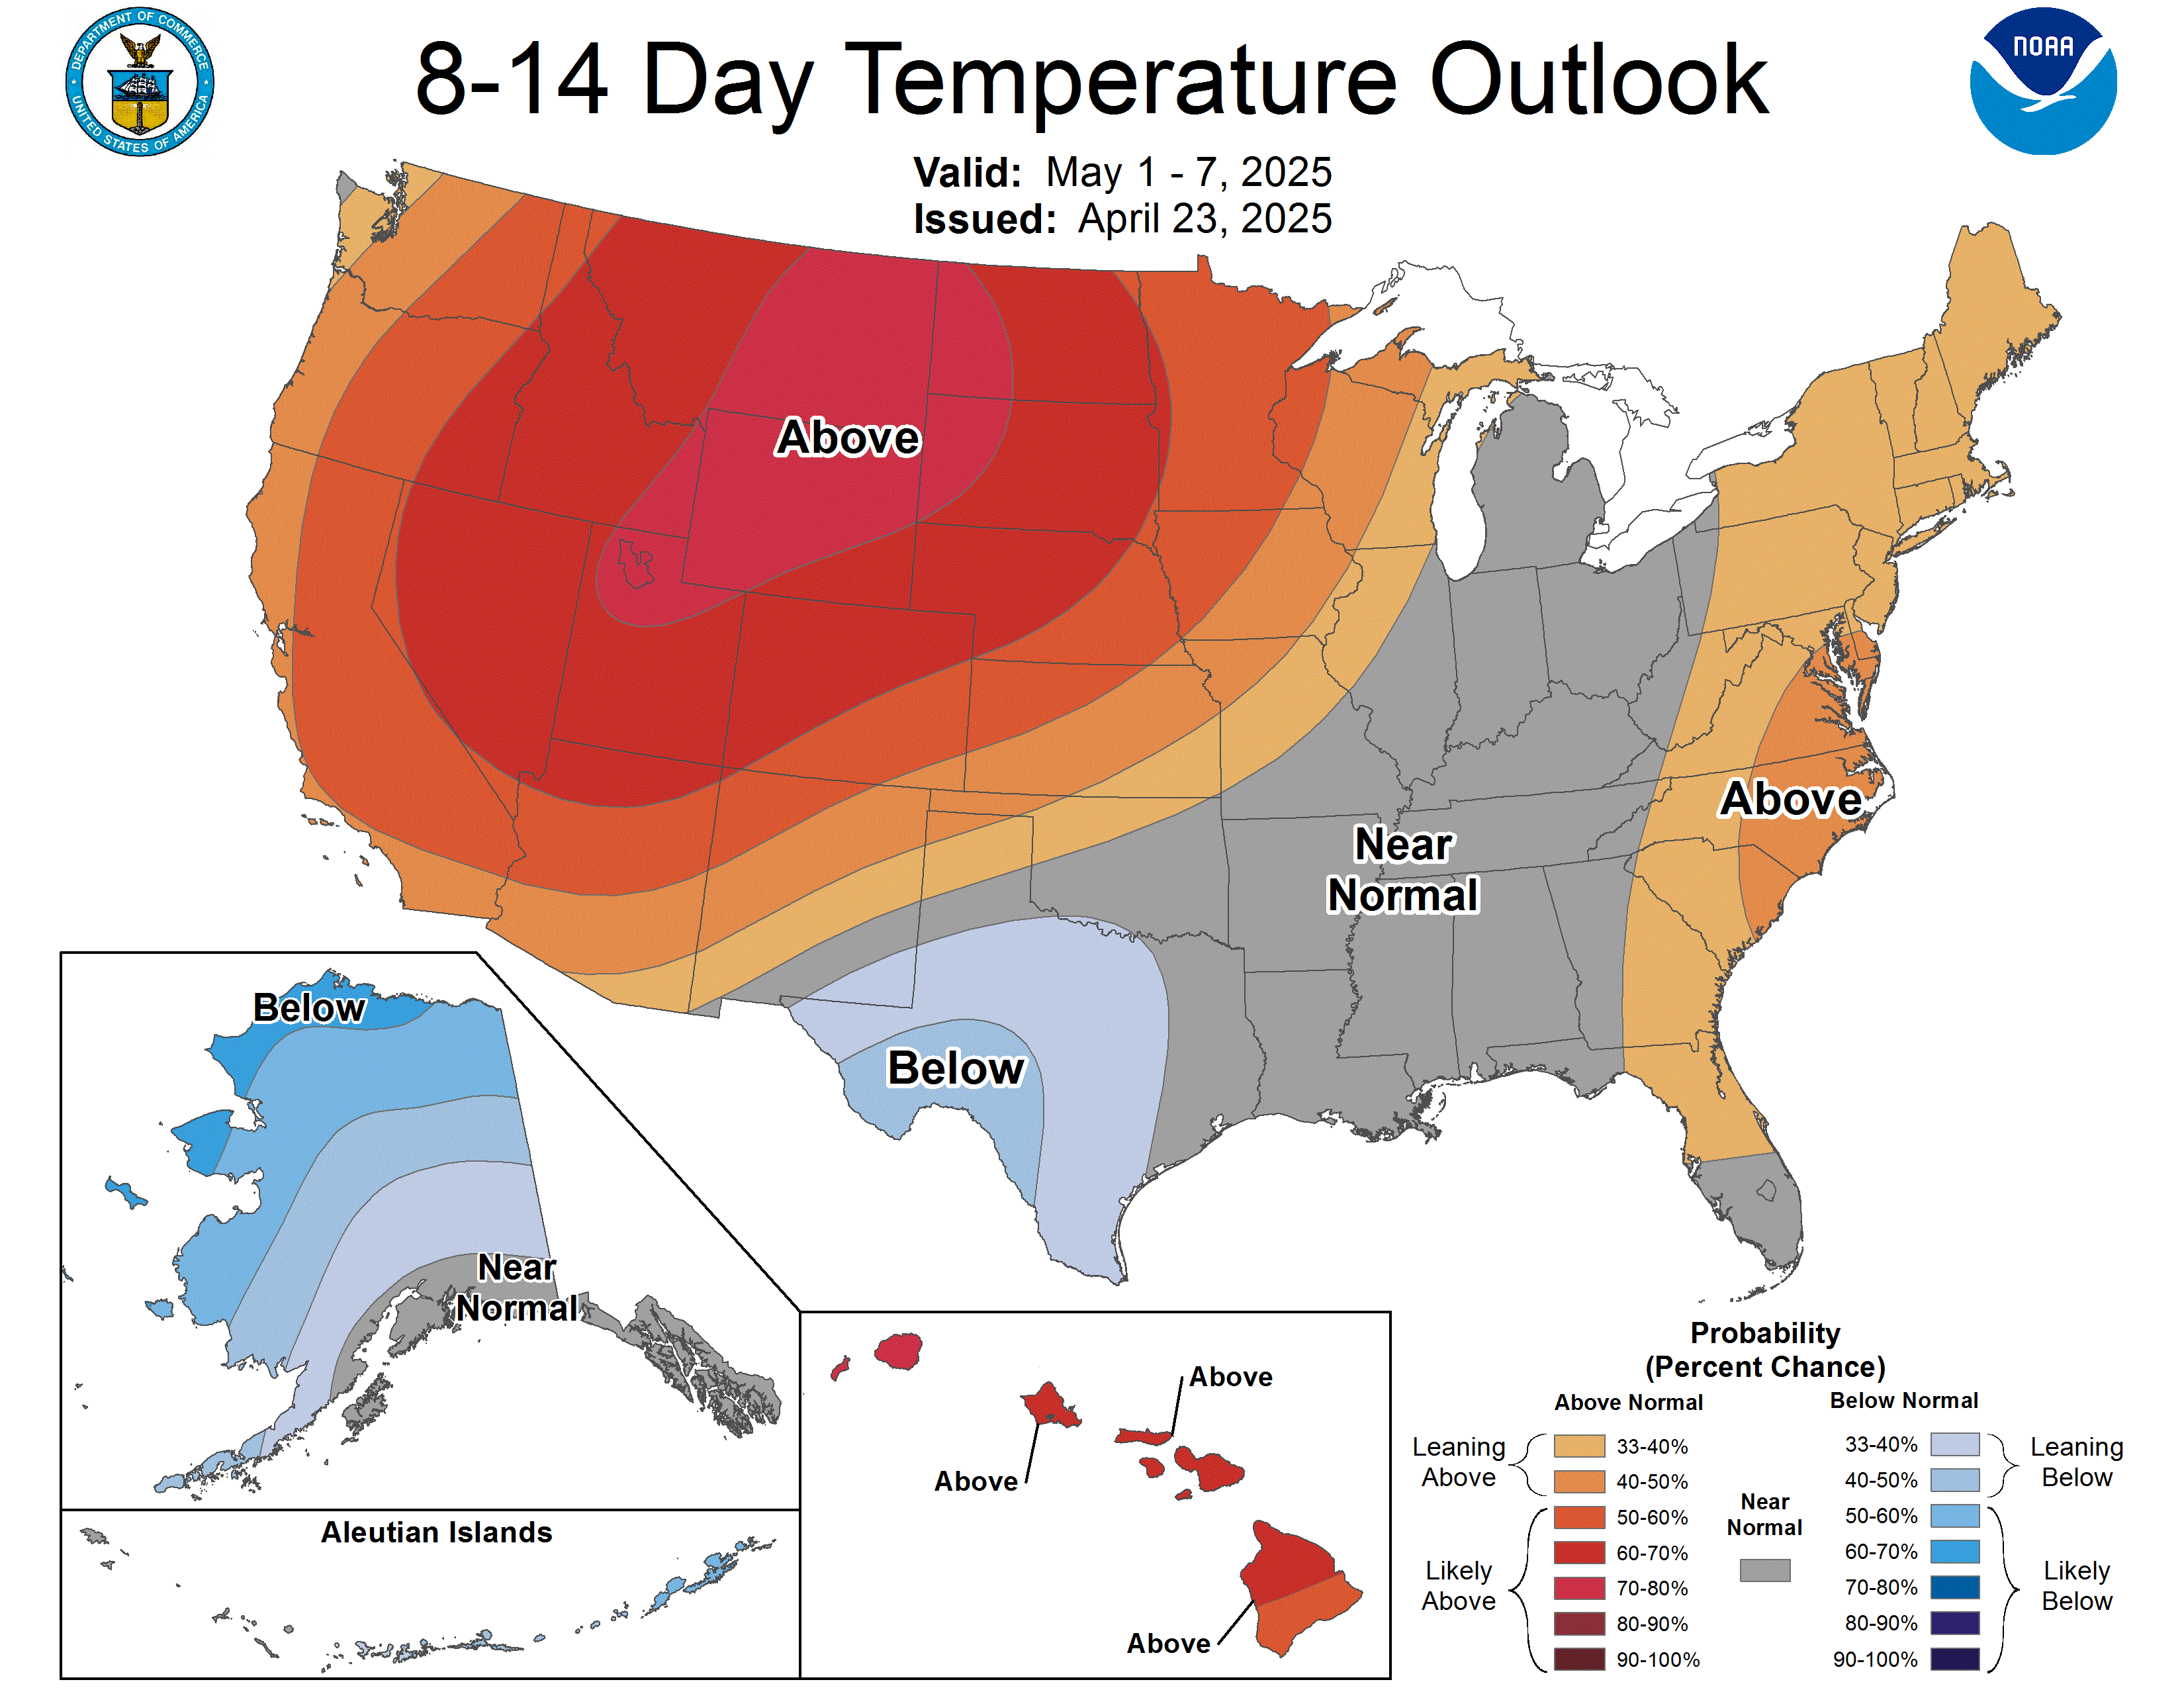
Days 8-14 Temperature
Days 8-14 Temperature Outlook
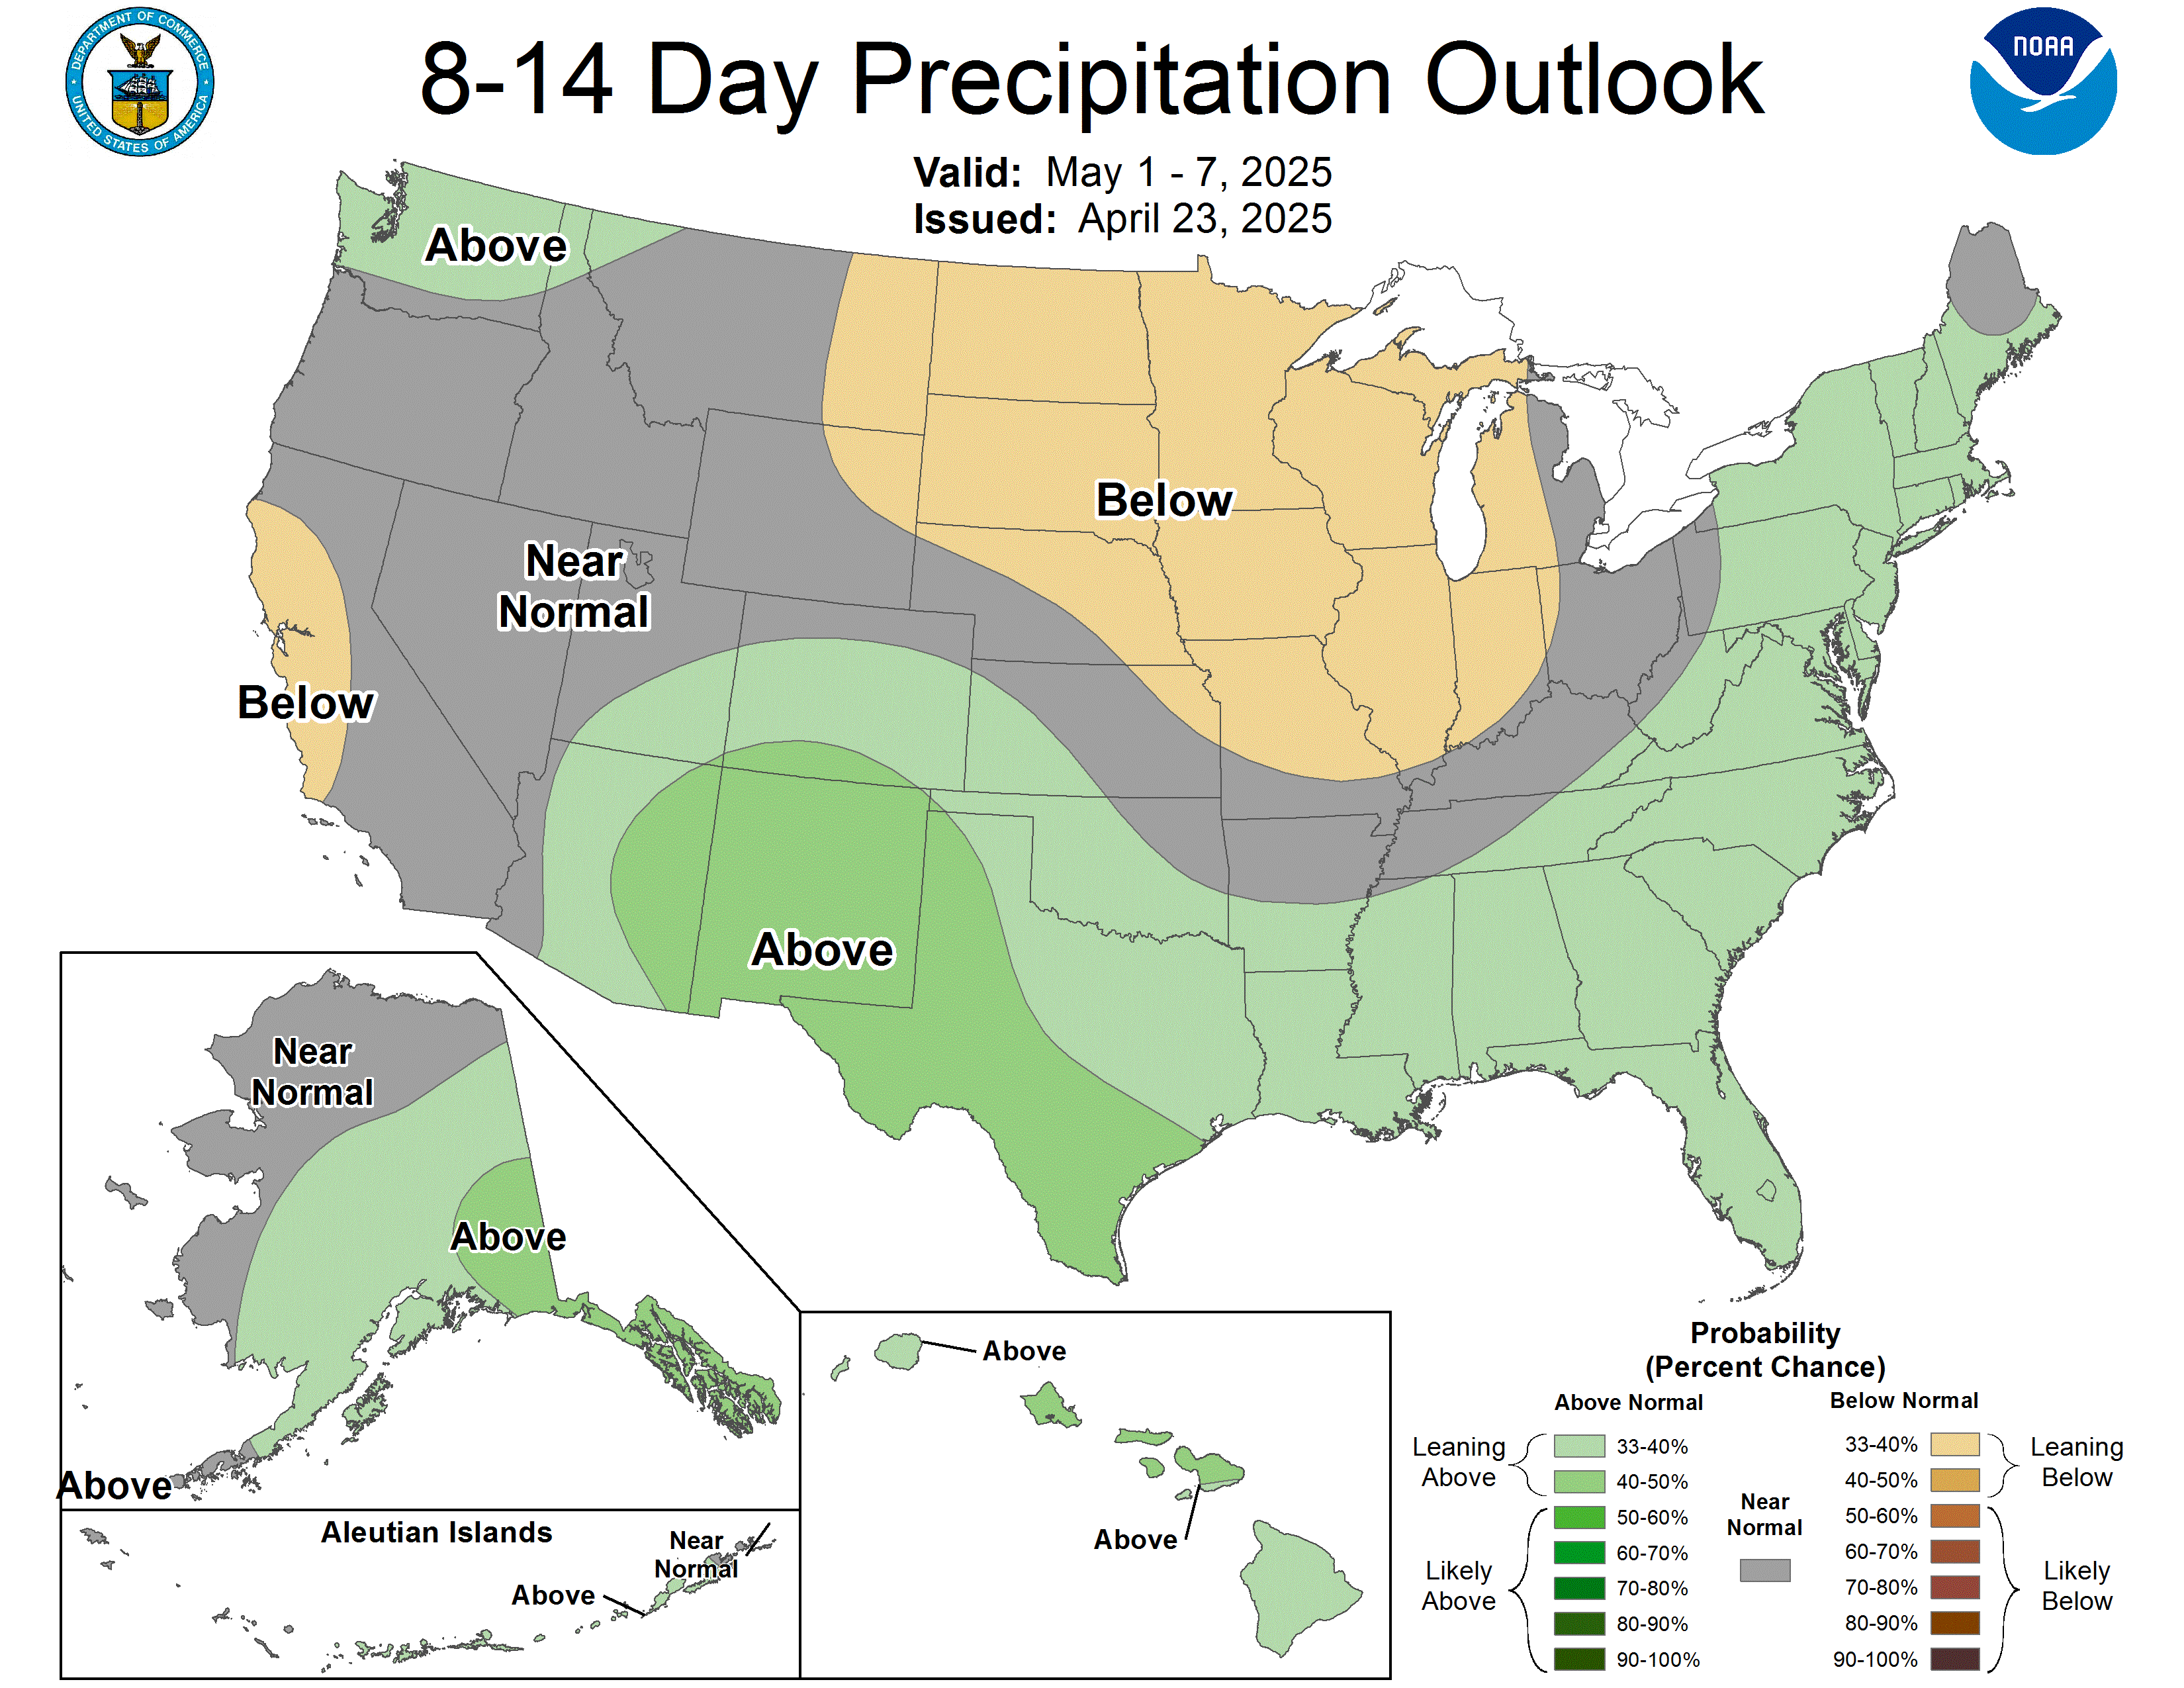
Days 8-14 Precipitation
Days 8-14 Precipitation Outlook
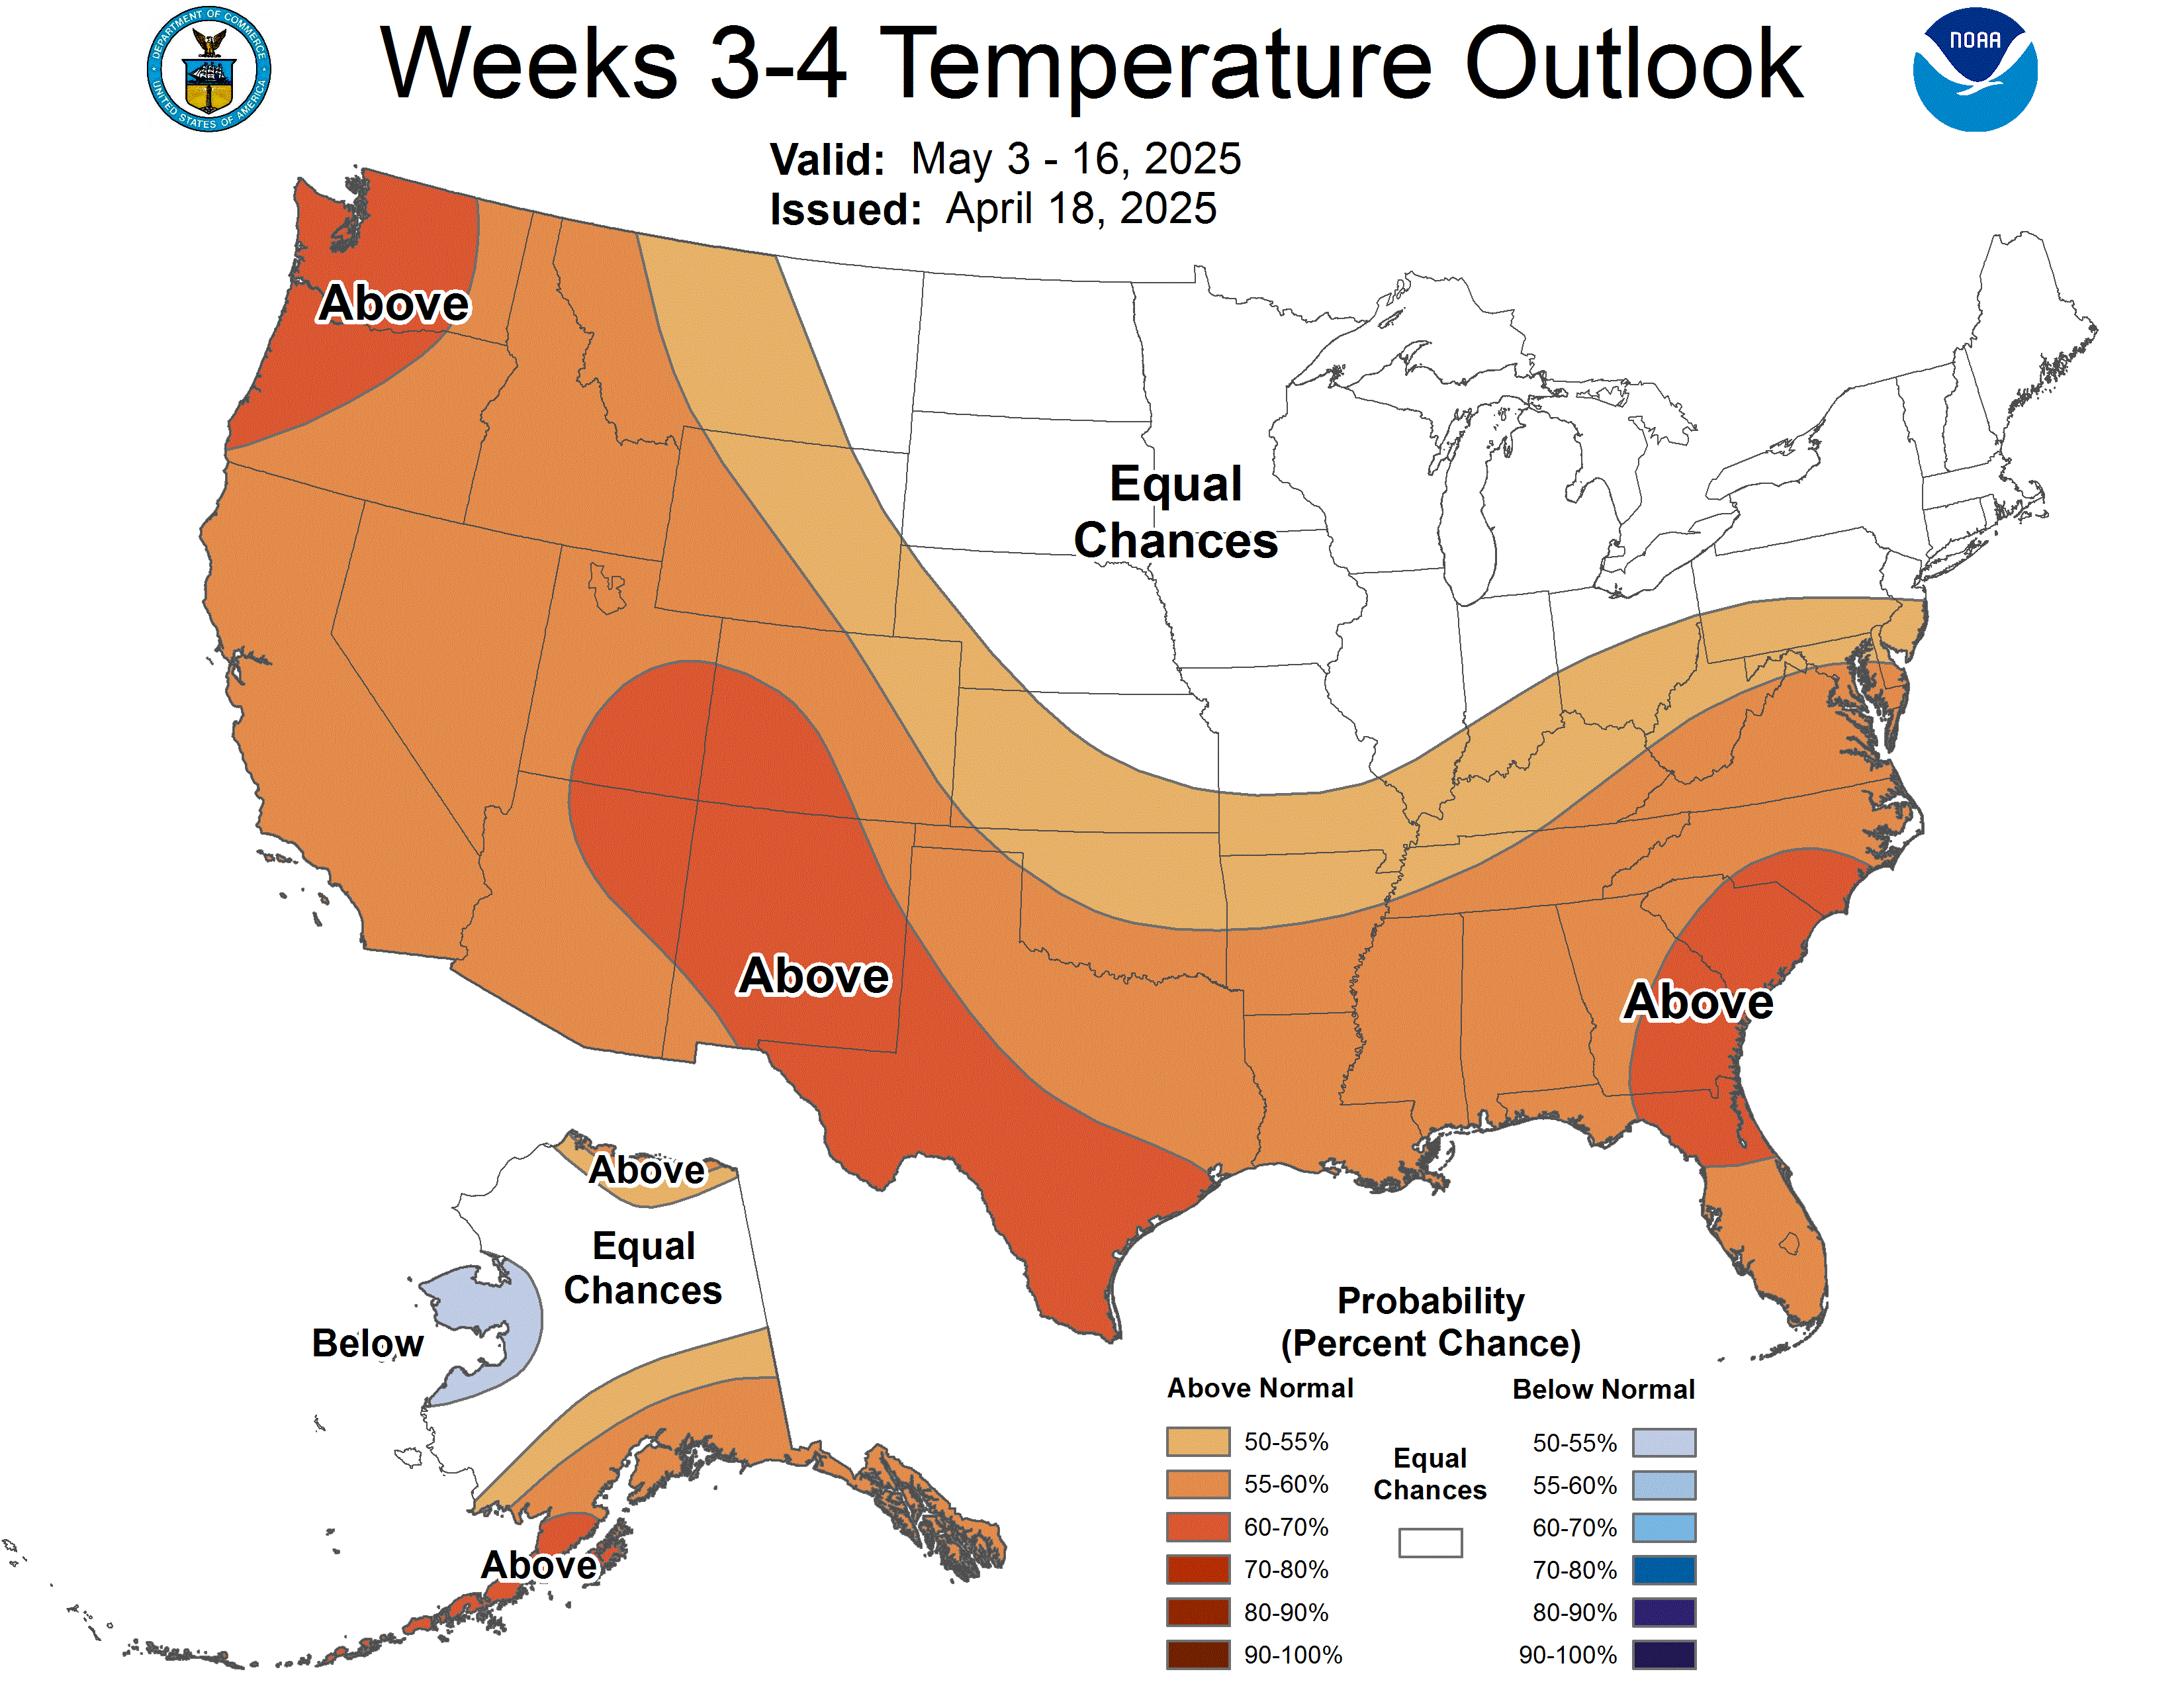
Week 3-4 Temperature
Week 3-4 Temperature Outlook
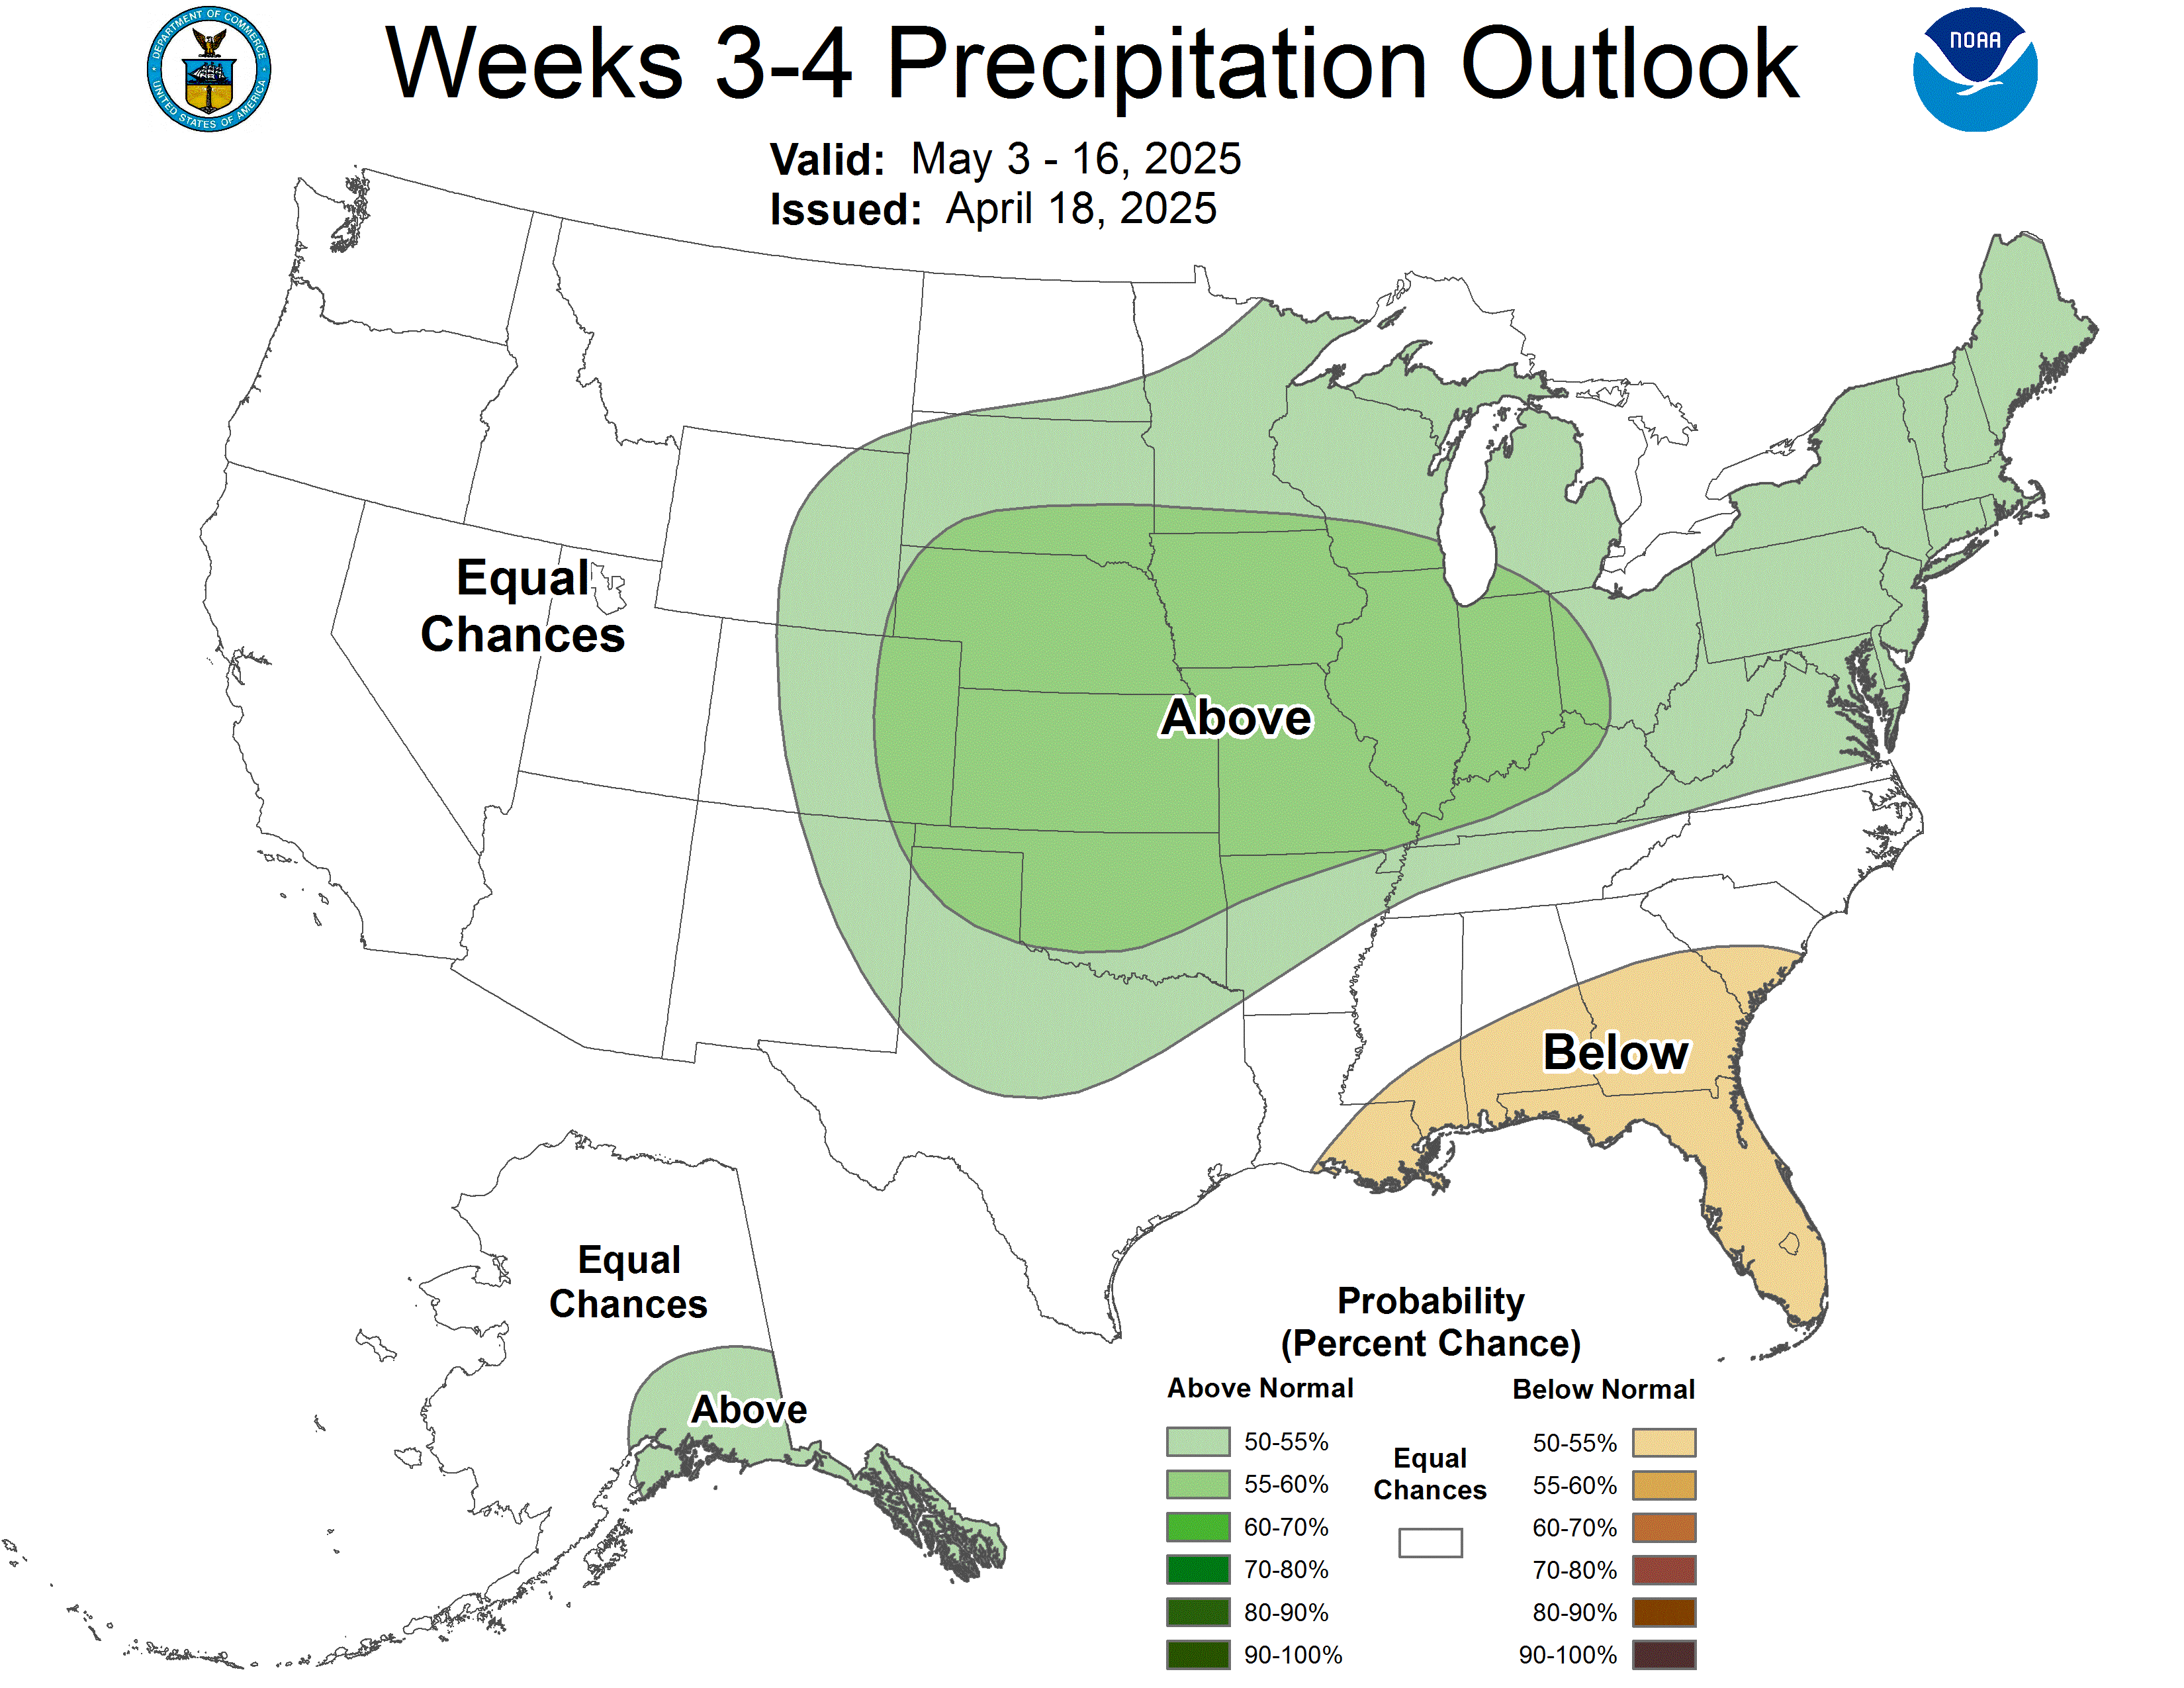
Week 3-4 Precipitation
Week 3-4 Precipitation Outlook