| Previous Month | Next Month |
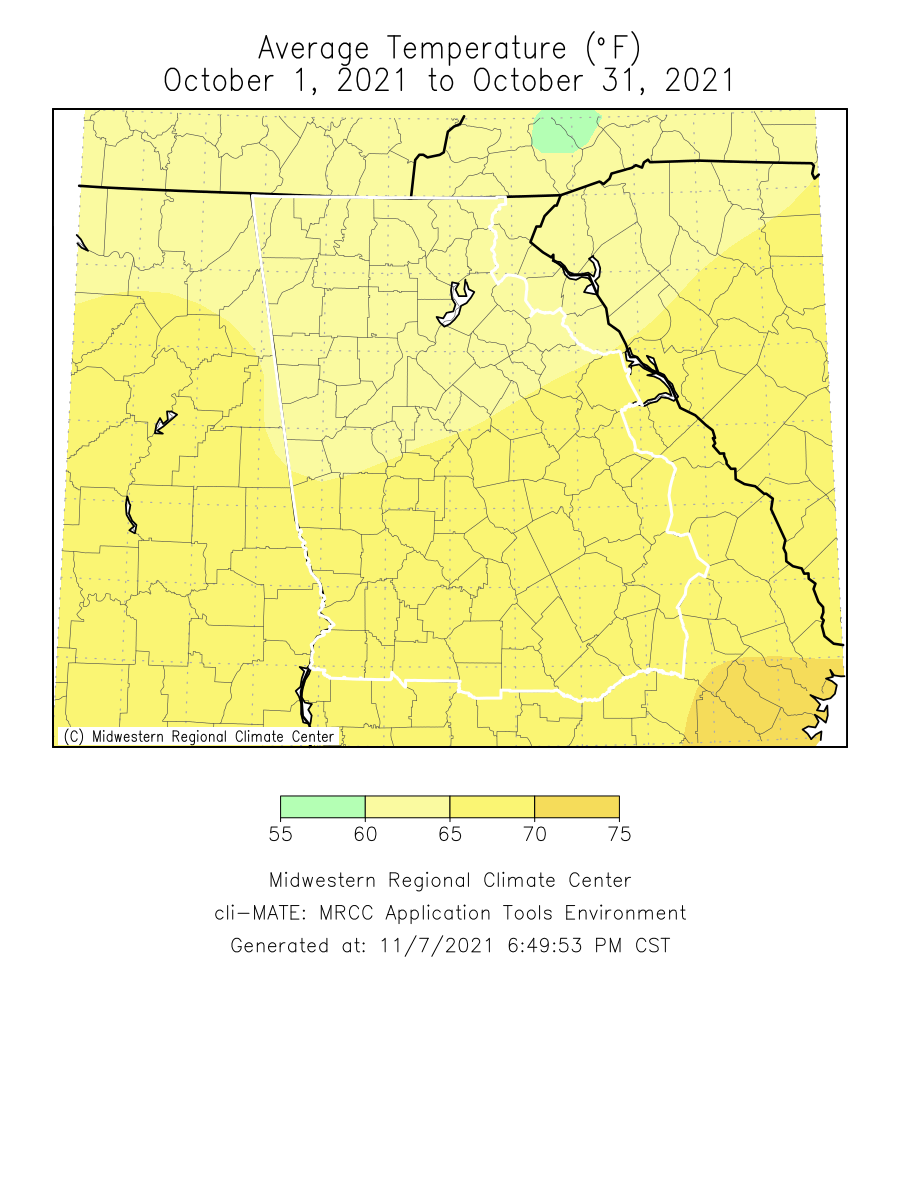
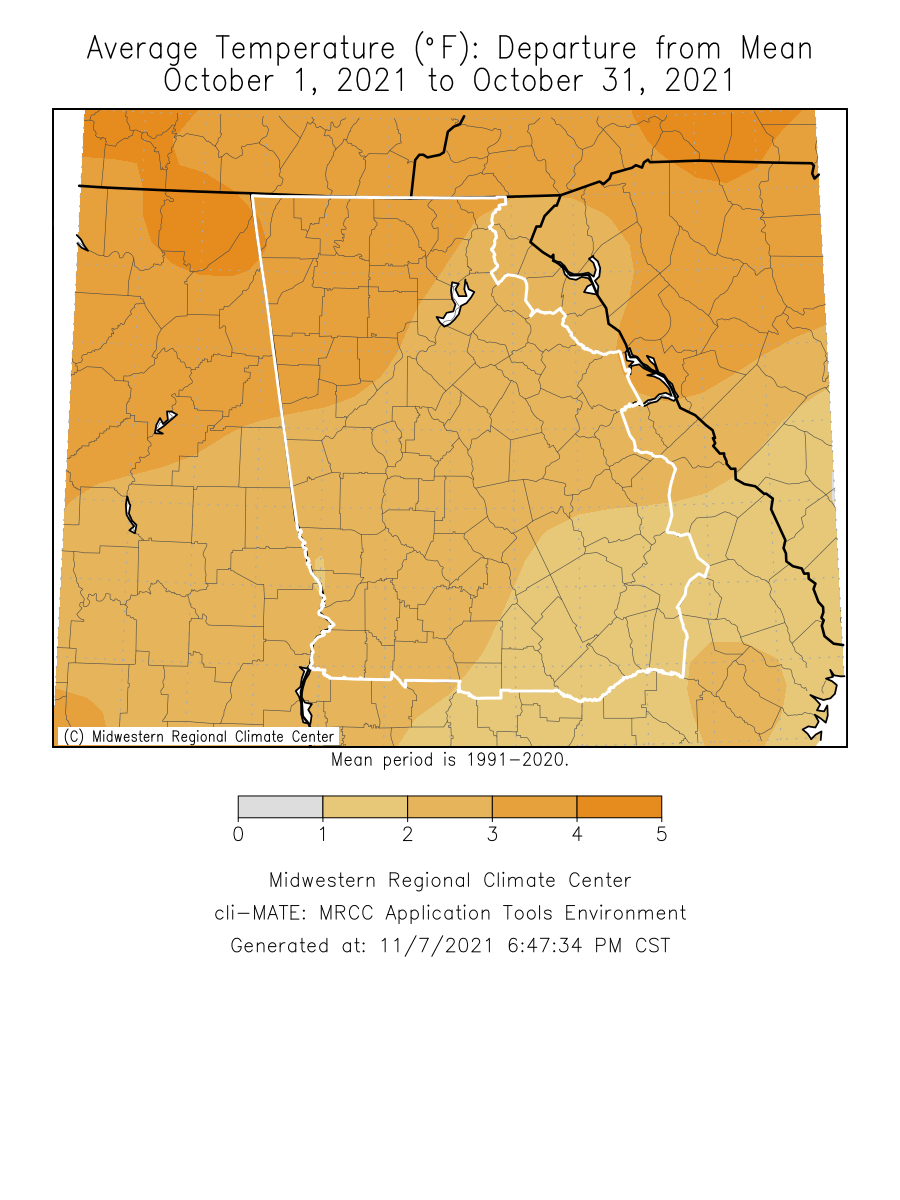
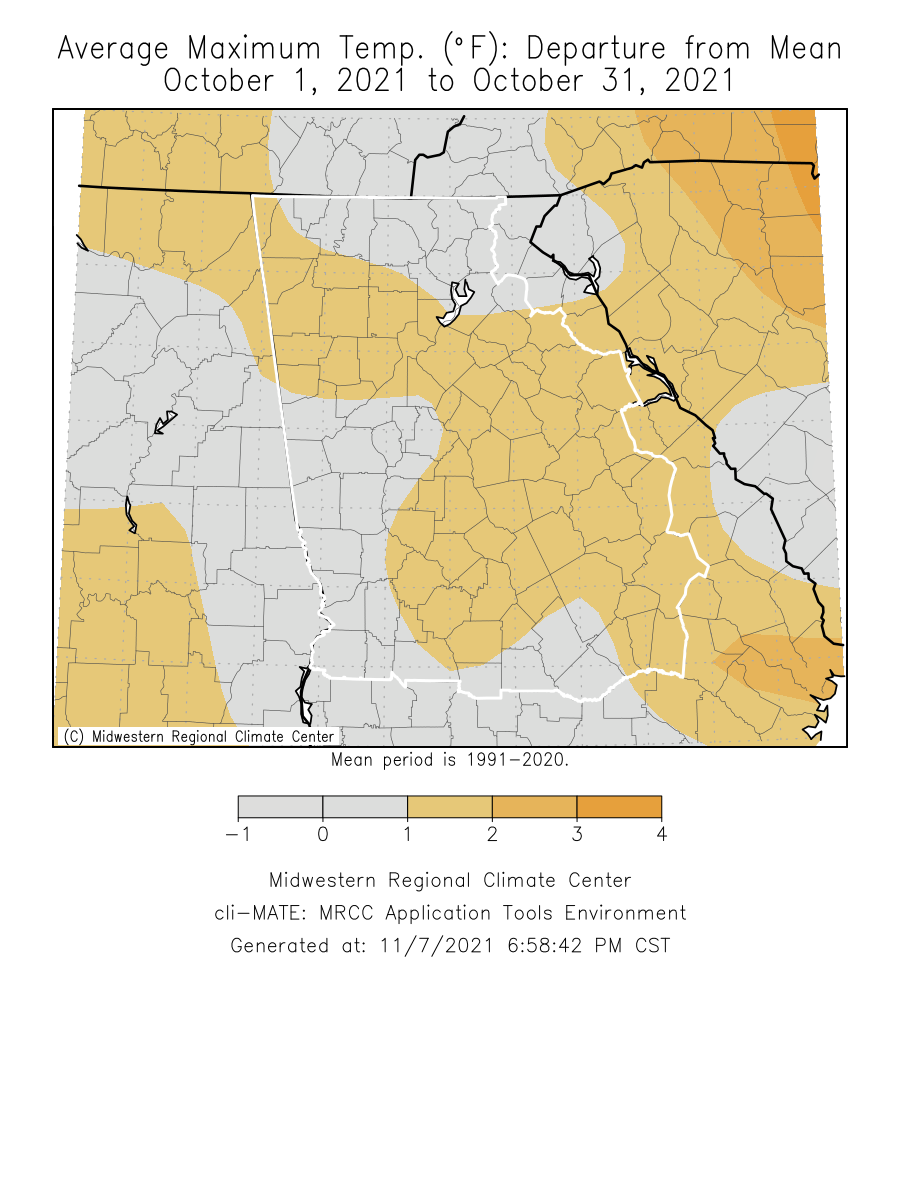
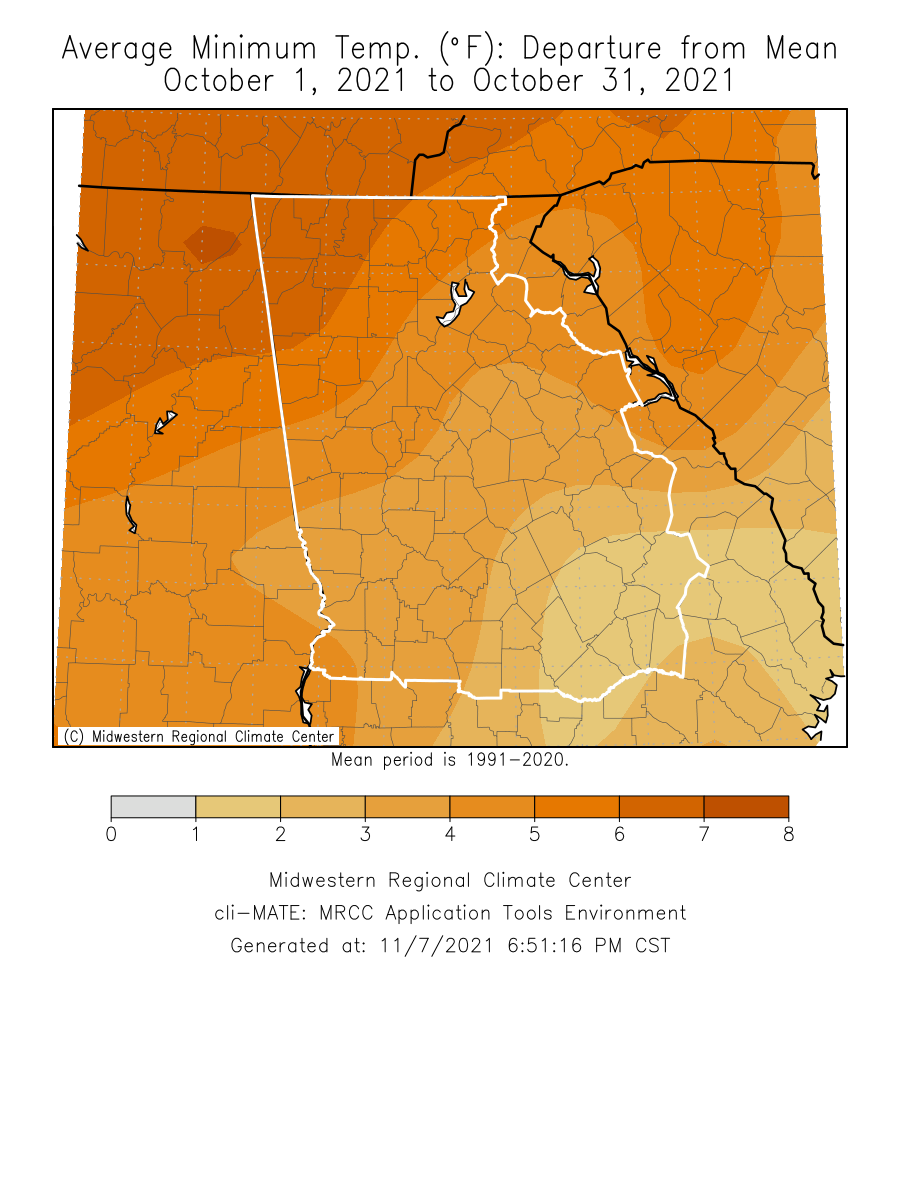
Temperatures through the month of October were around 0 to 3 degrees above normal. Precipitation through the month of October was within 2 inches of normal.
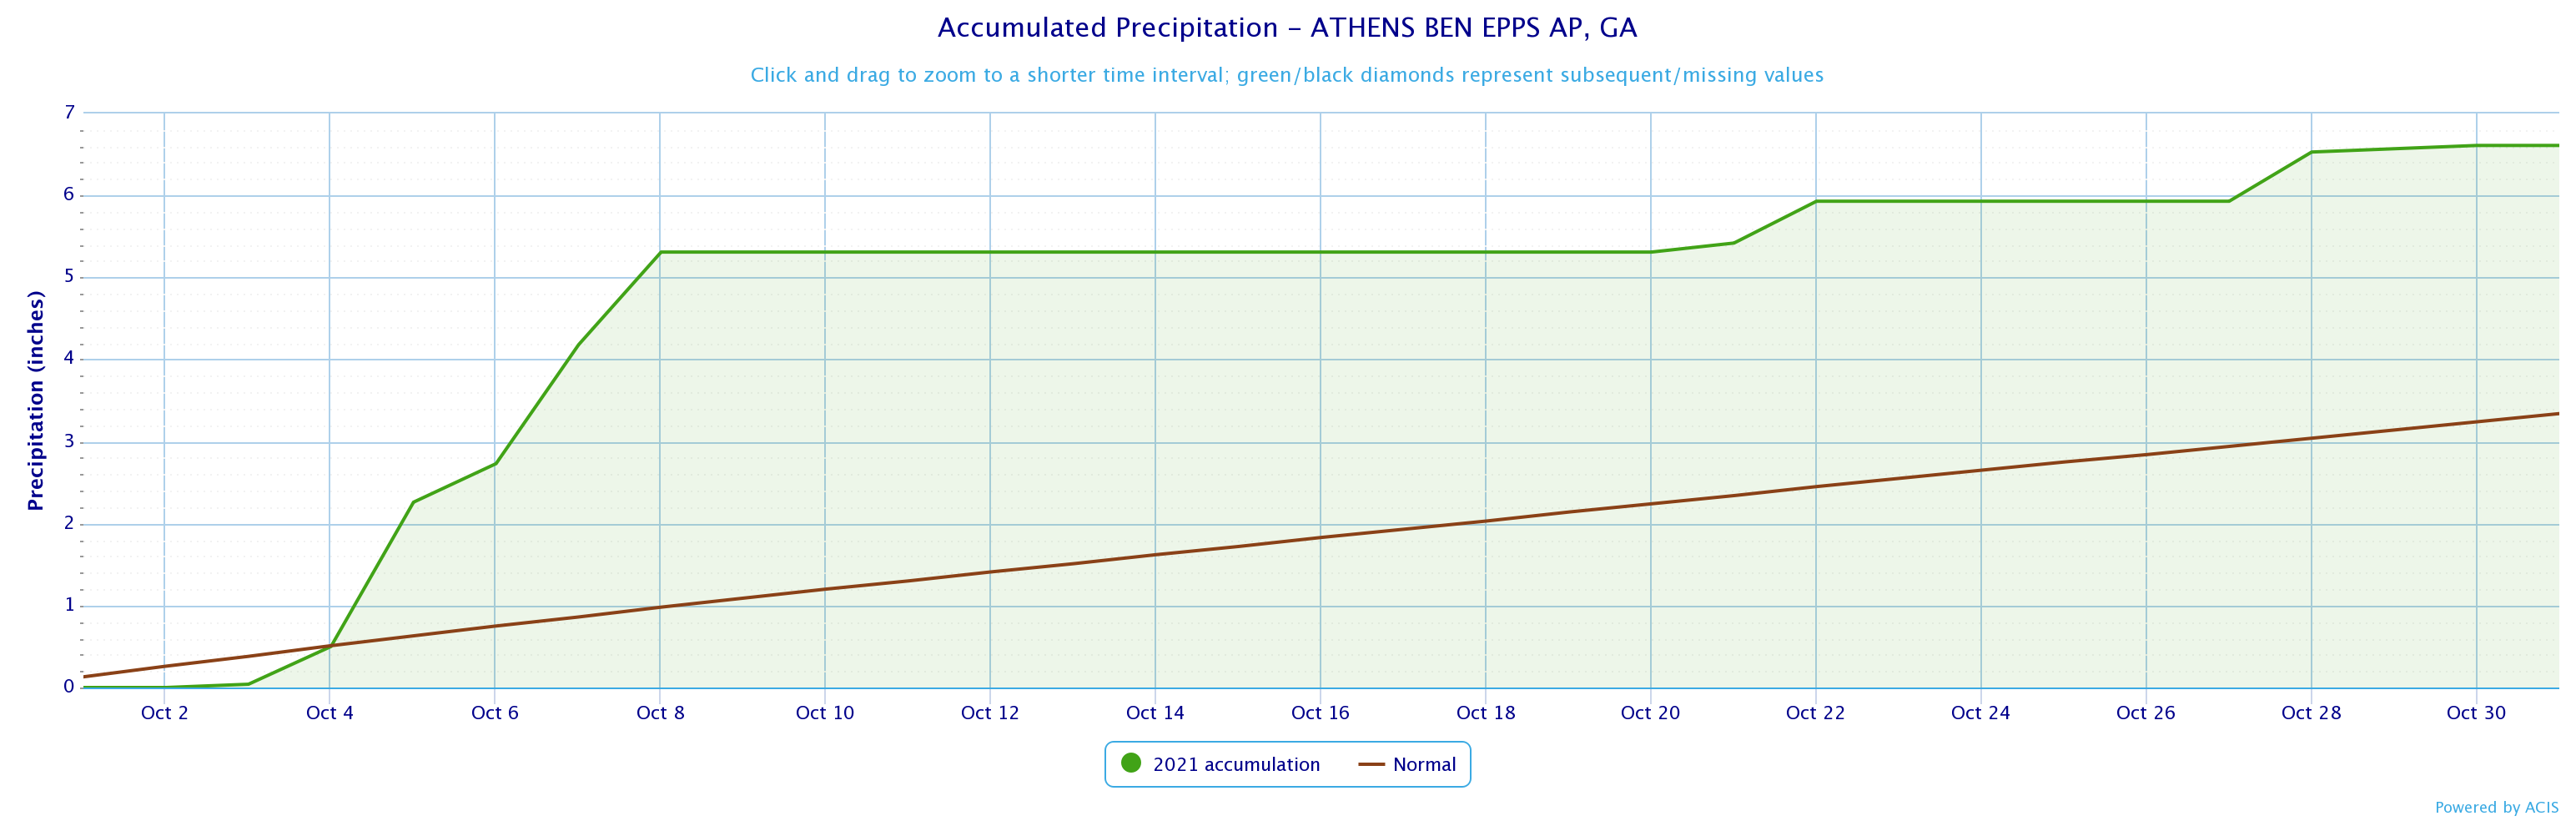
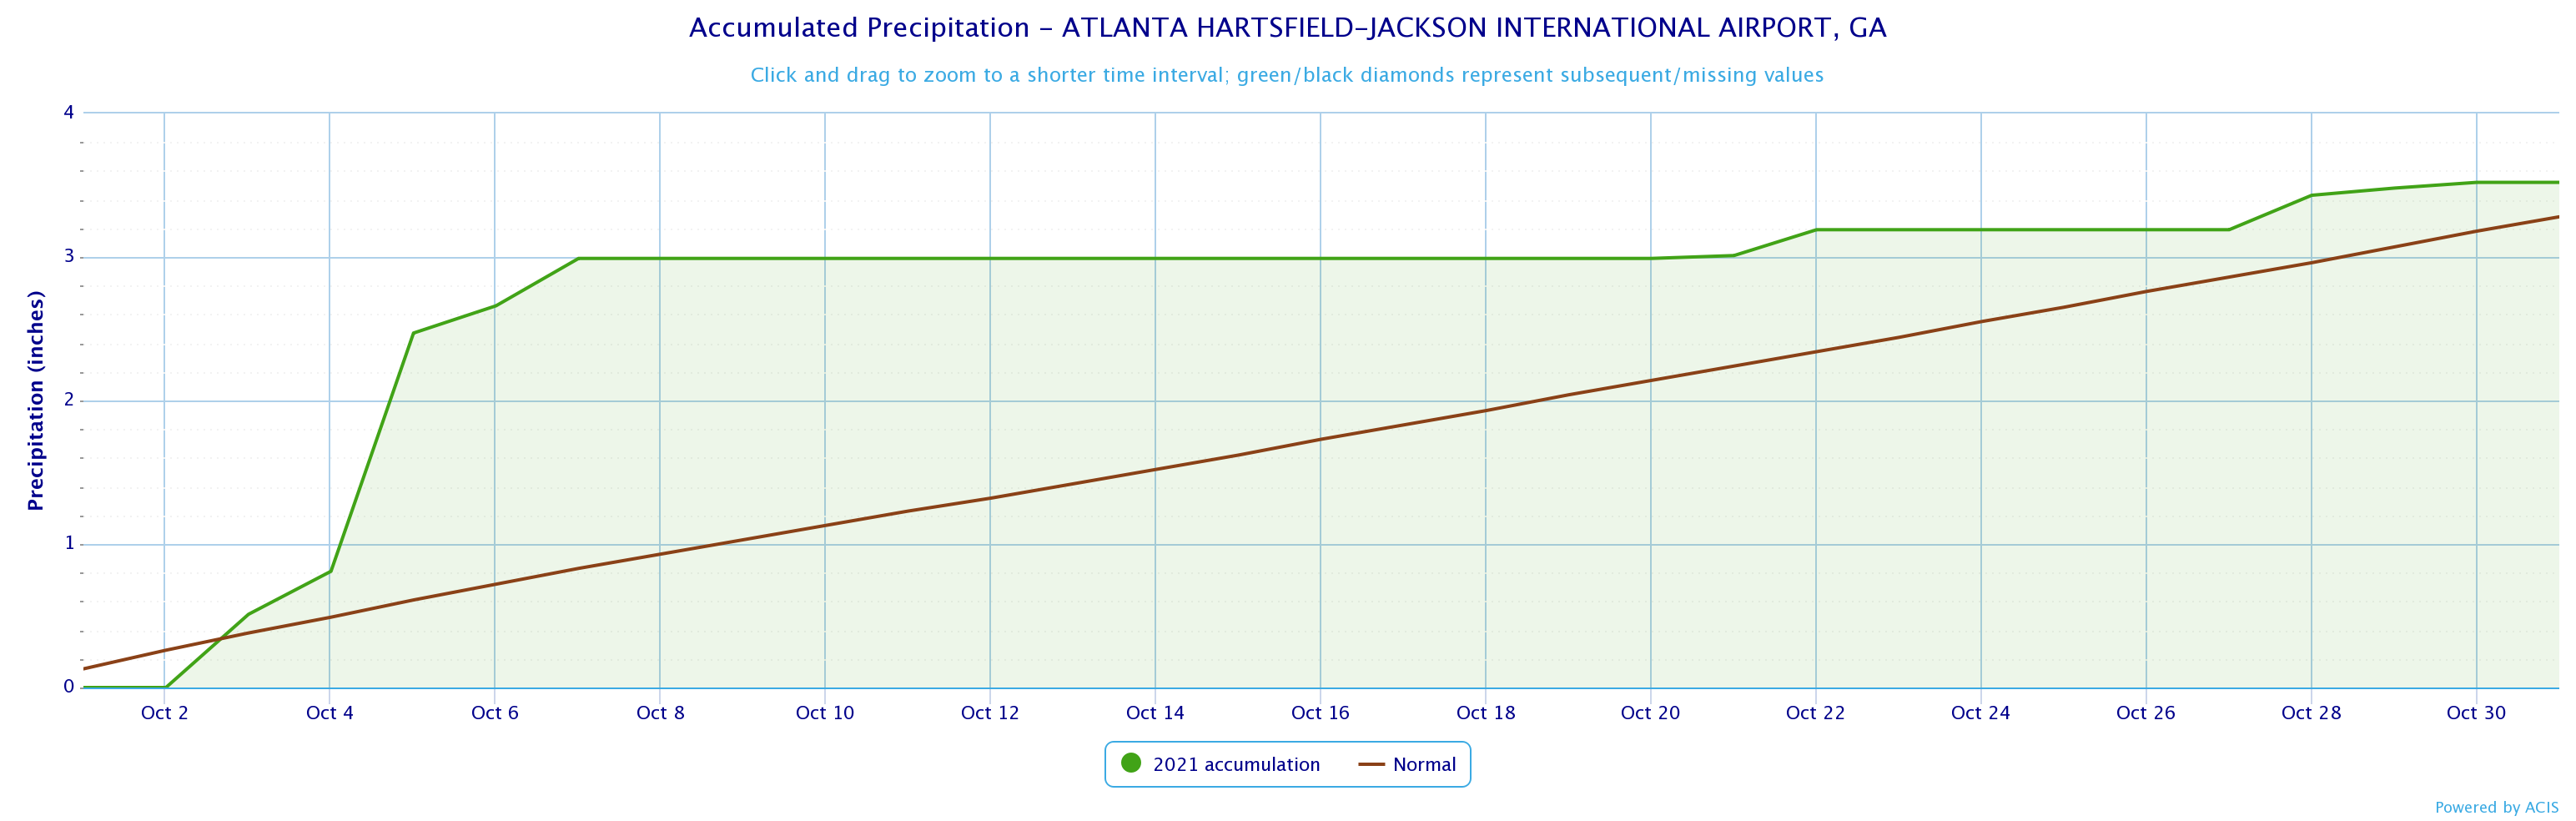
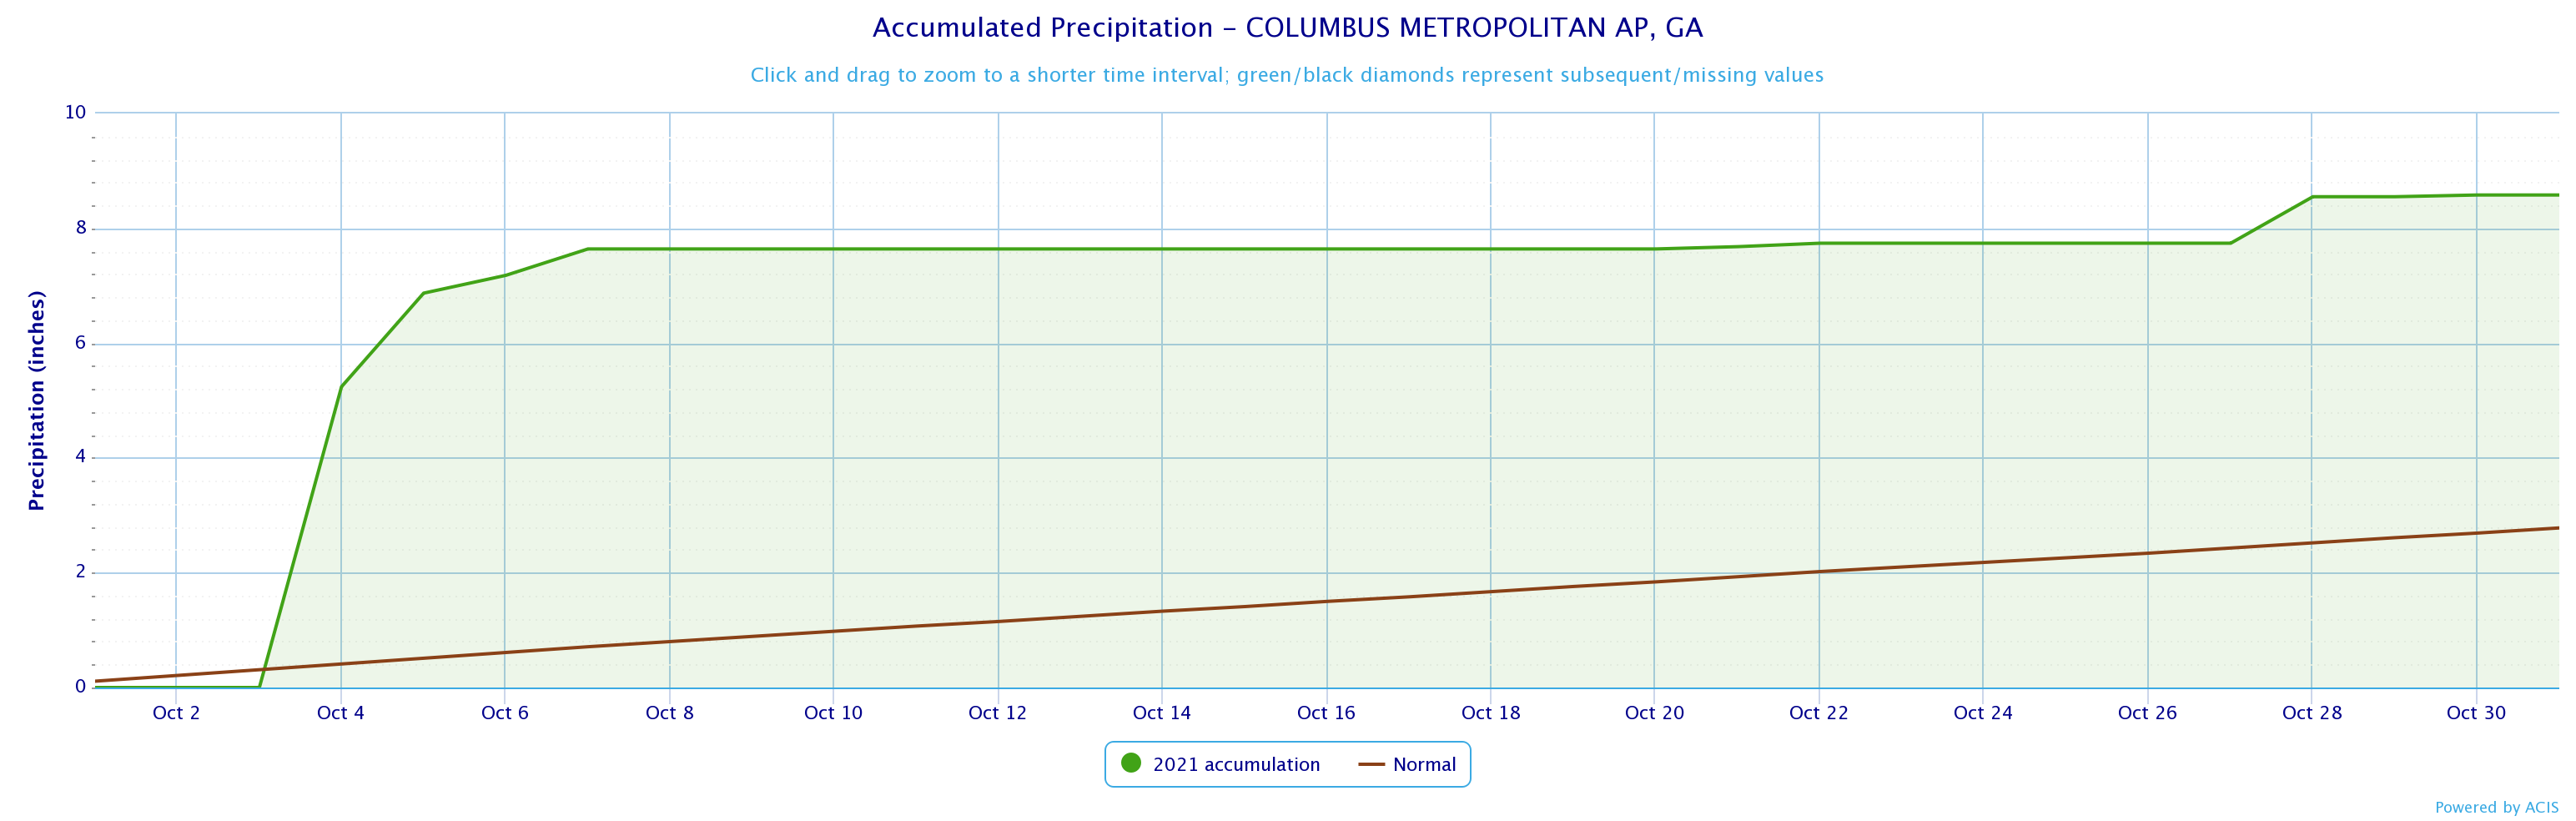
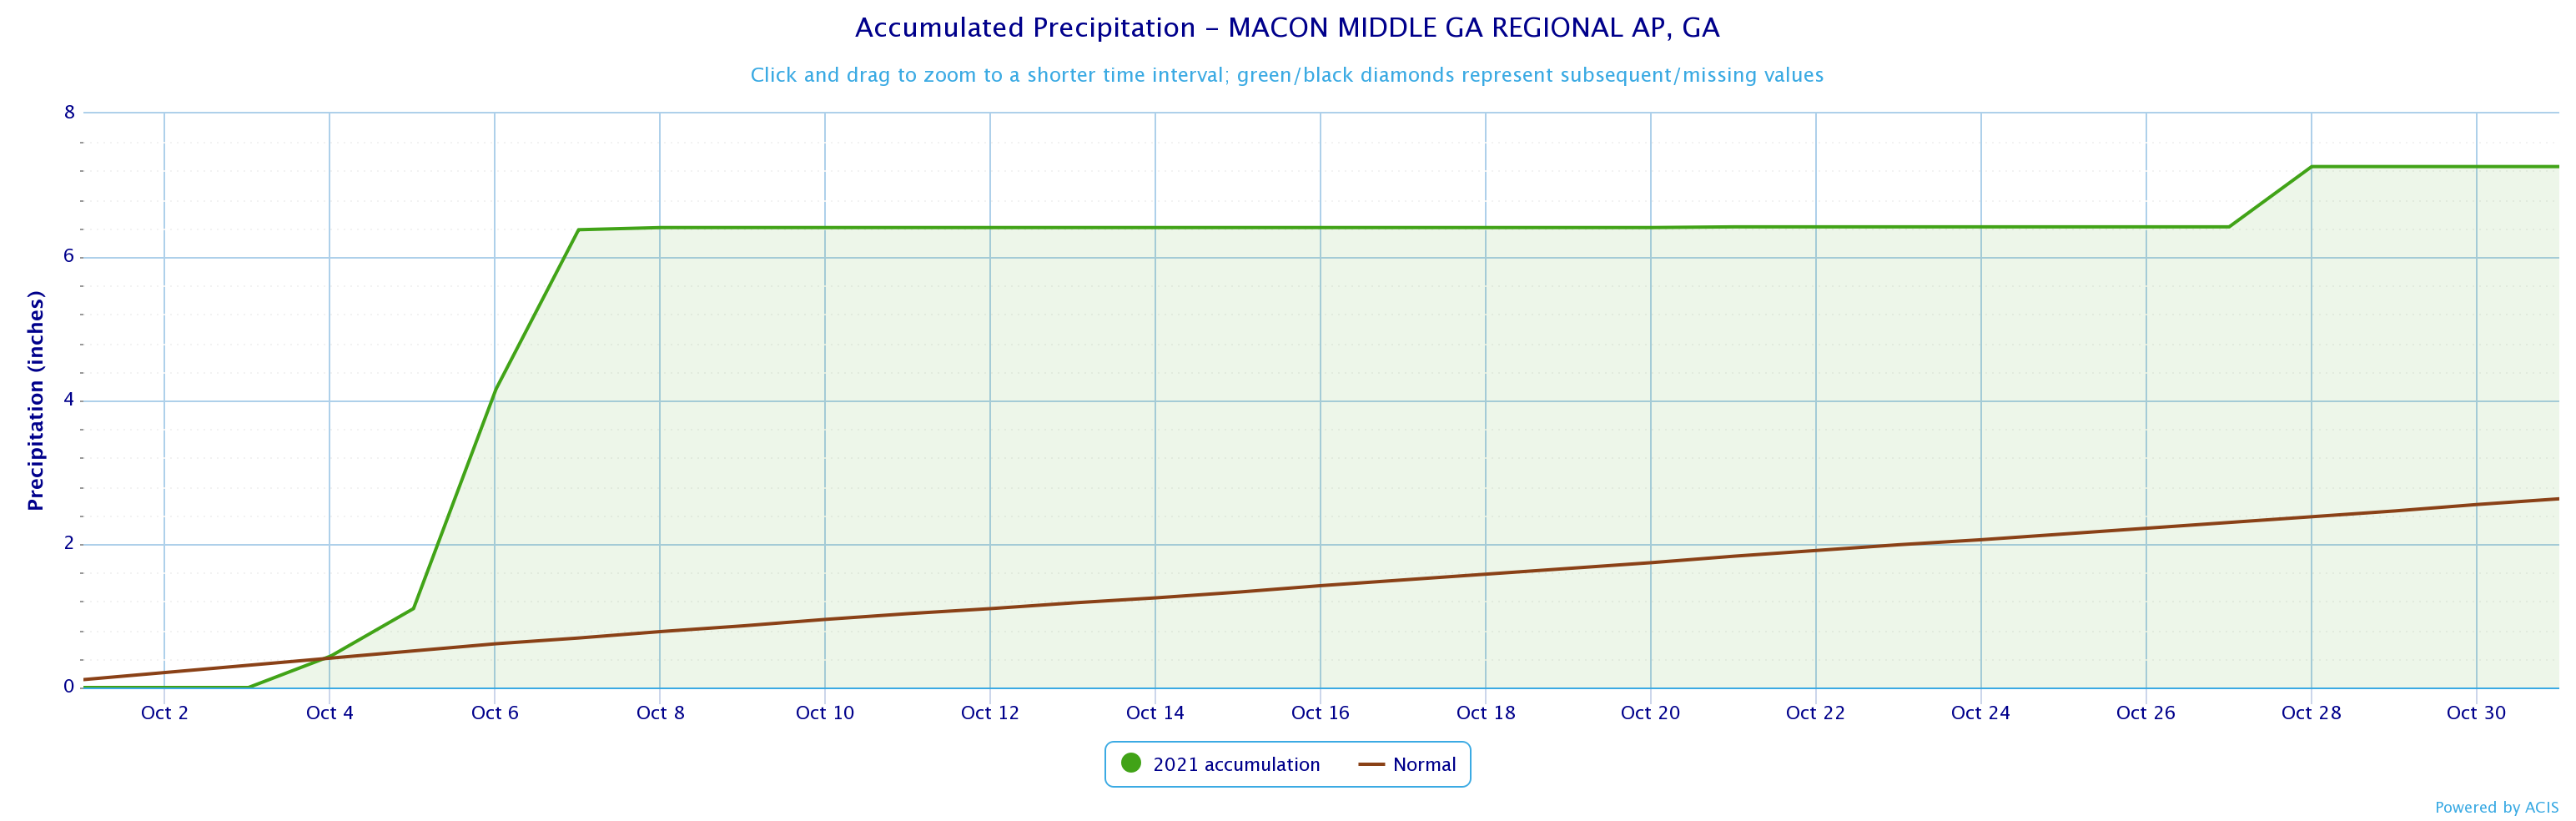
Climate Site Maximum Temperature Max T Date *Indicates a daily record was set Climate Site Total Precipitation DFN (Departure Climate Site Maximum Daily Precip (in inches) Max P Date *Indicates a daily record was set Data prepared by NWS Peachtree City/Atlanta October 3-8th Heavy Rain and Flash Flooding: A stationary front set up across the southeastern United States where it remained for a few days. This boundary combined with warm southeast flow from the gulf set off multiple days of heavy rain along and south of the I-85 corridor. Over the course of 5 days, some areas received in excess of 10 inches of rain with a number of climate sites setting a daily rainfall record. Flash flooding and river flooding were extensive across central Georgia with 22 Flash flood warnings issued for our County Warning Area. Based on the Climate Prediction Center's outlook for November, all of Georgia has equal chances for above, below or near normal temperatures. For precipitation, most of northern Georgia has a 33% chance of below normal precipitation while the remainder of central Georgia has a 40% chance of below normal precipitation.
Overview
Climate Graphs
Records
Events
November Outlook
Below are the overview stats for October 2021 for our 10 climate sites.
October 2021 Climate Averages
Climate Site
October Temp (°F)
Average Temp
Departure from normal
67.2
63.5
3.7
67.2
64.7
2.5
68.5
67.6
0.9
67.9
66.0
1.9
64.9
61.6
3.3
65.5
61.9
3.6
65.3
62.9
2.4
65.1
61.9
3.2
66.3
63.6
2.7
66.4
62.3
4.1
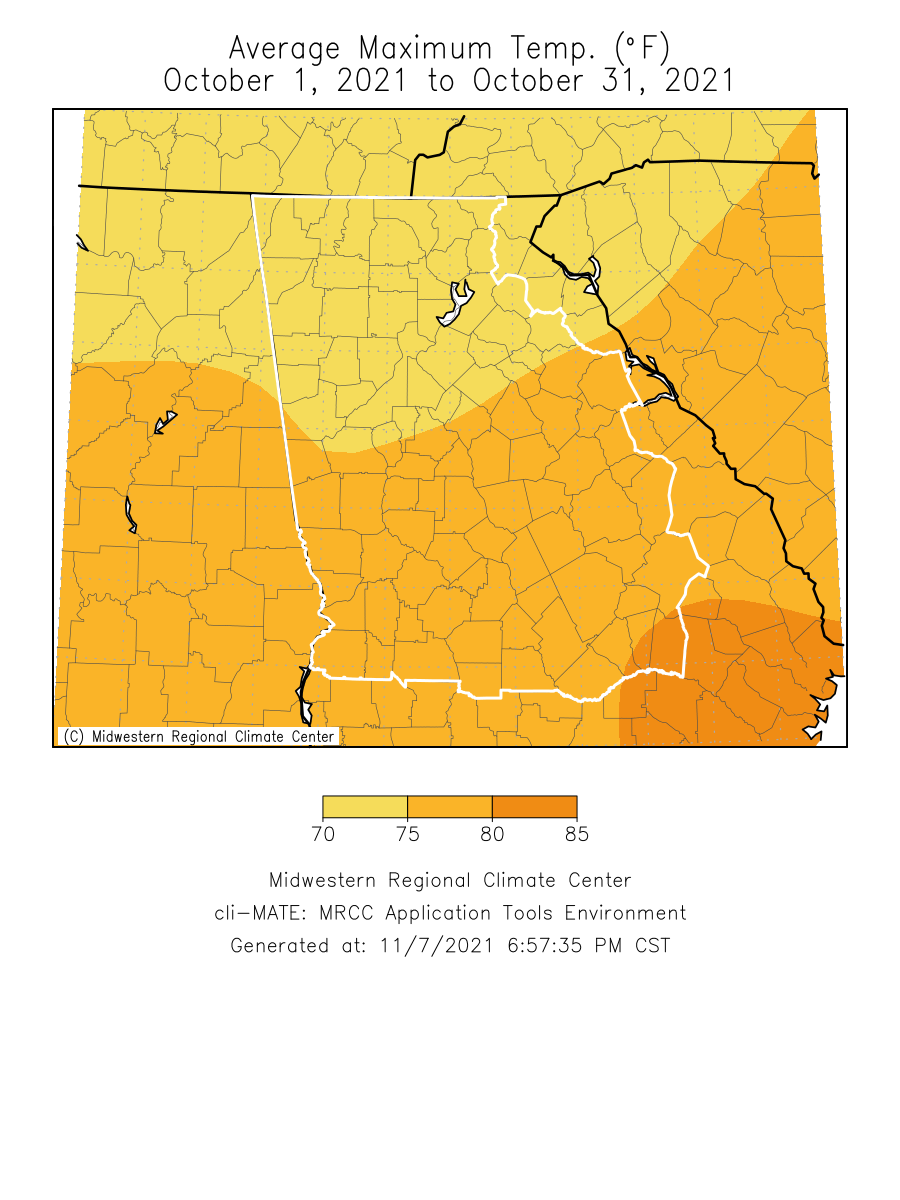
October 2021 Temperature Climate Statistics
Minimum Temperature
Min T Date
Athens
88
10/15
40
10/27
Atlanta
85
10/1, 15
46
10/27
Columbus
88
10/1, 15
43
10/18
Macon
88
10/1, 15
41
10/18, 19
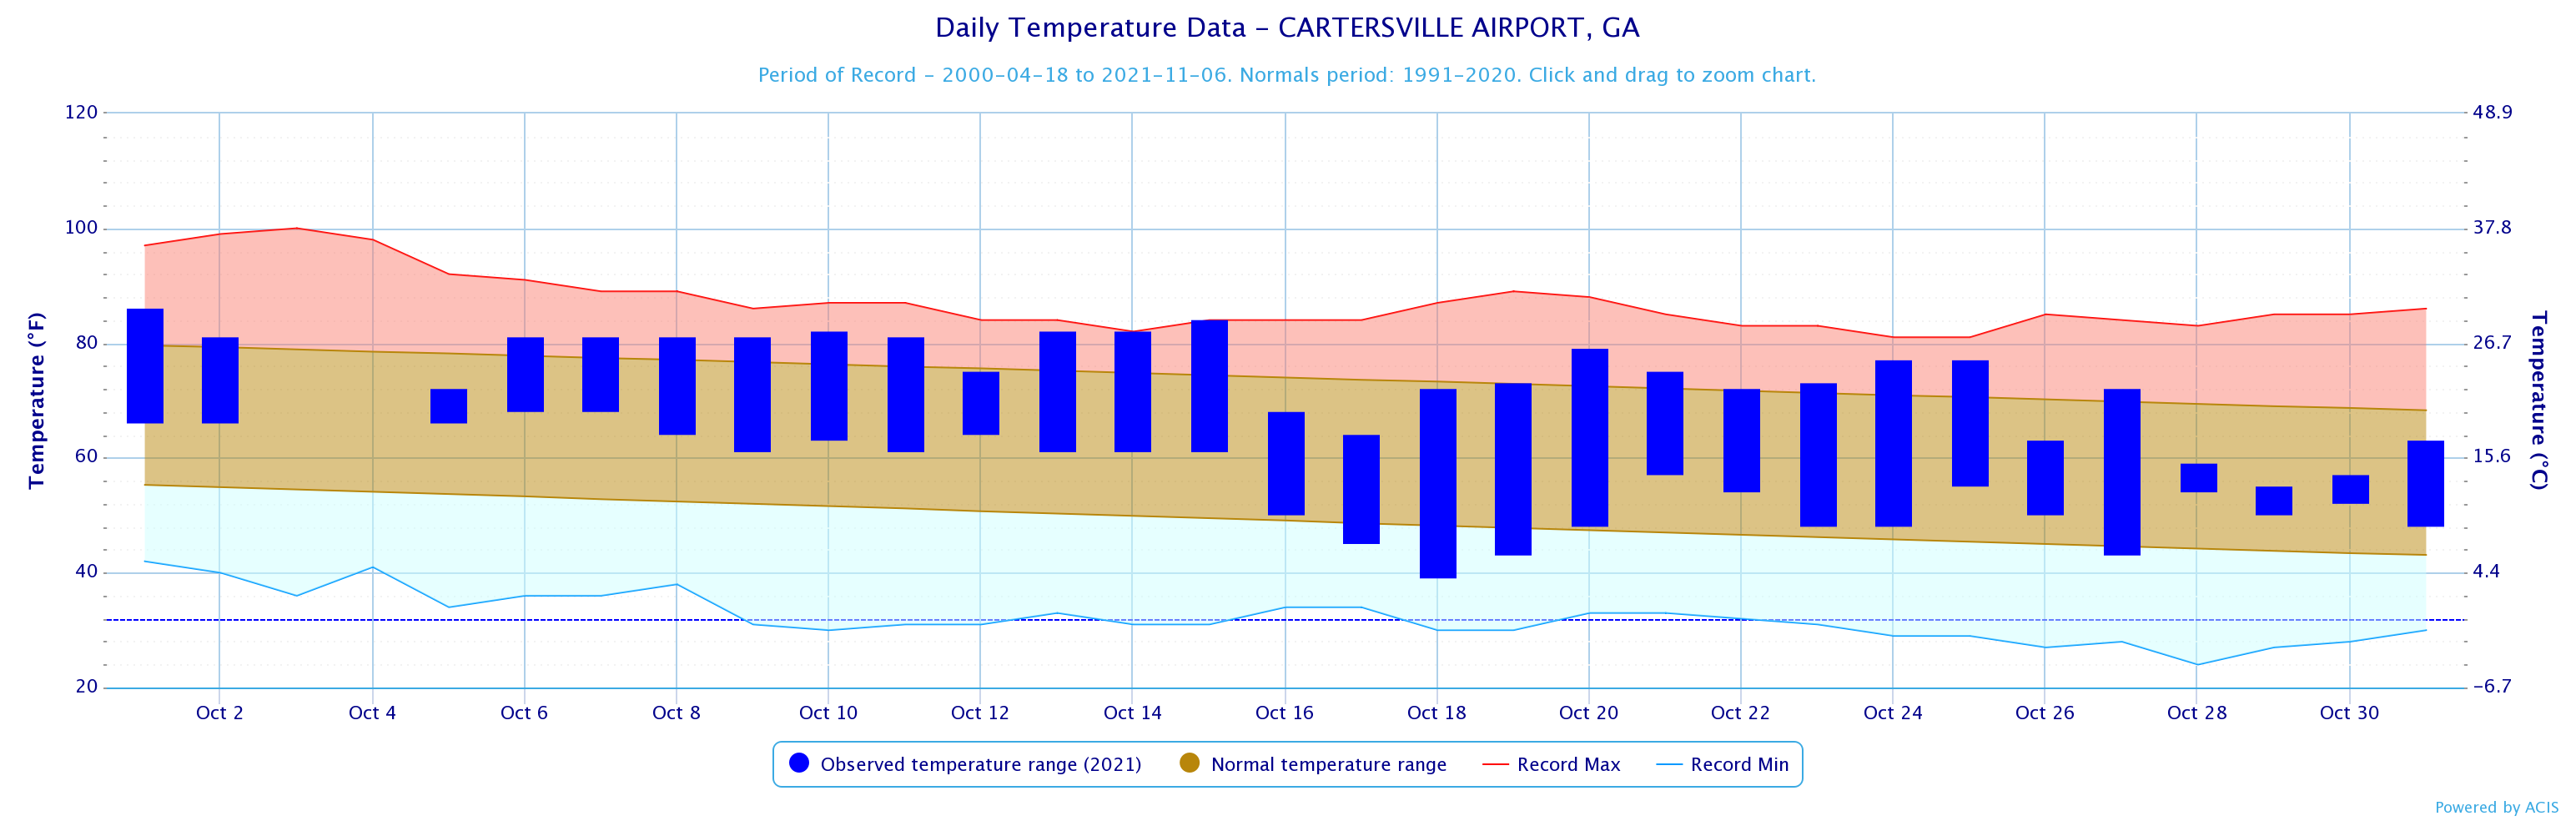
Cartersville
86
10/1
39
10/18
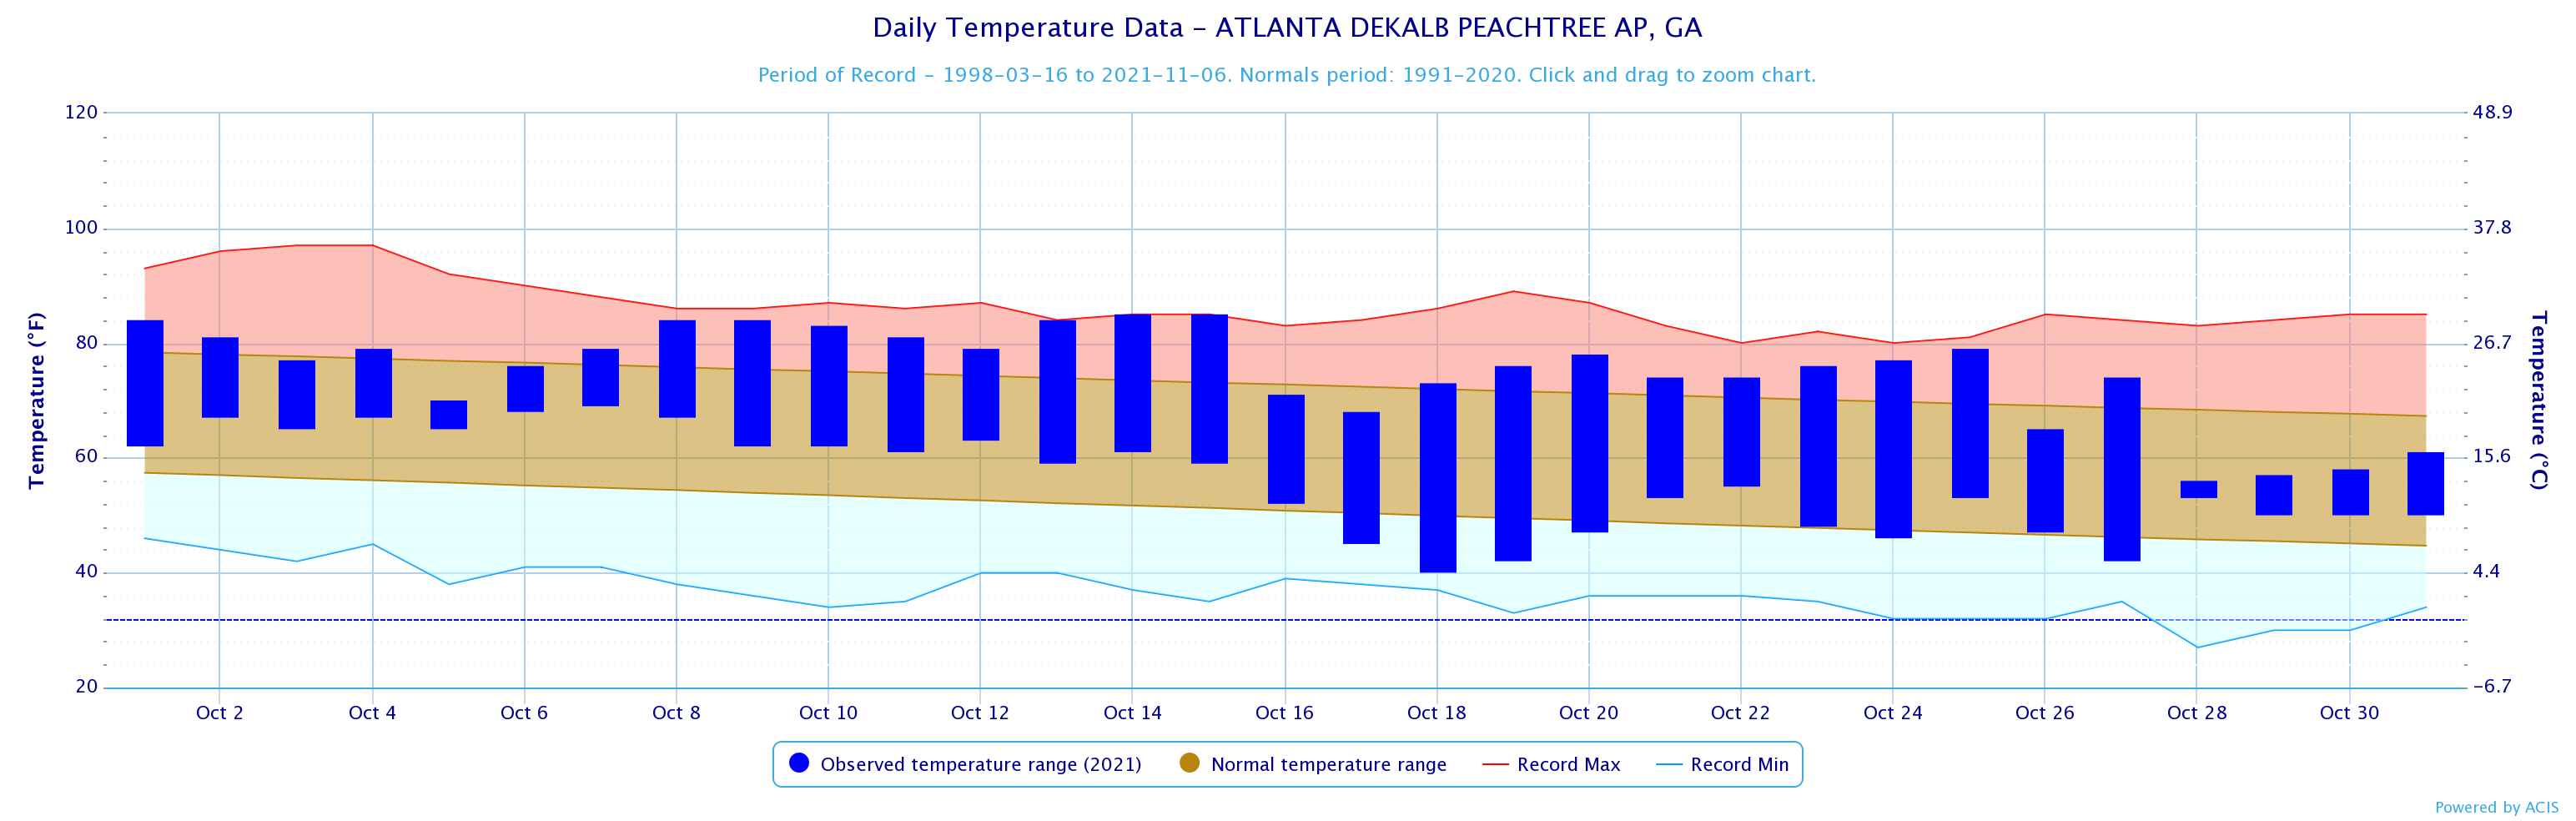
Dekalb Peachtree Arpt
85
10/14, 15
40
10/18
Fulton Co Arpt
85
10/1, 15
41
10/18
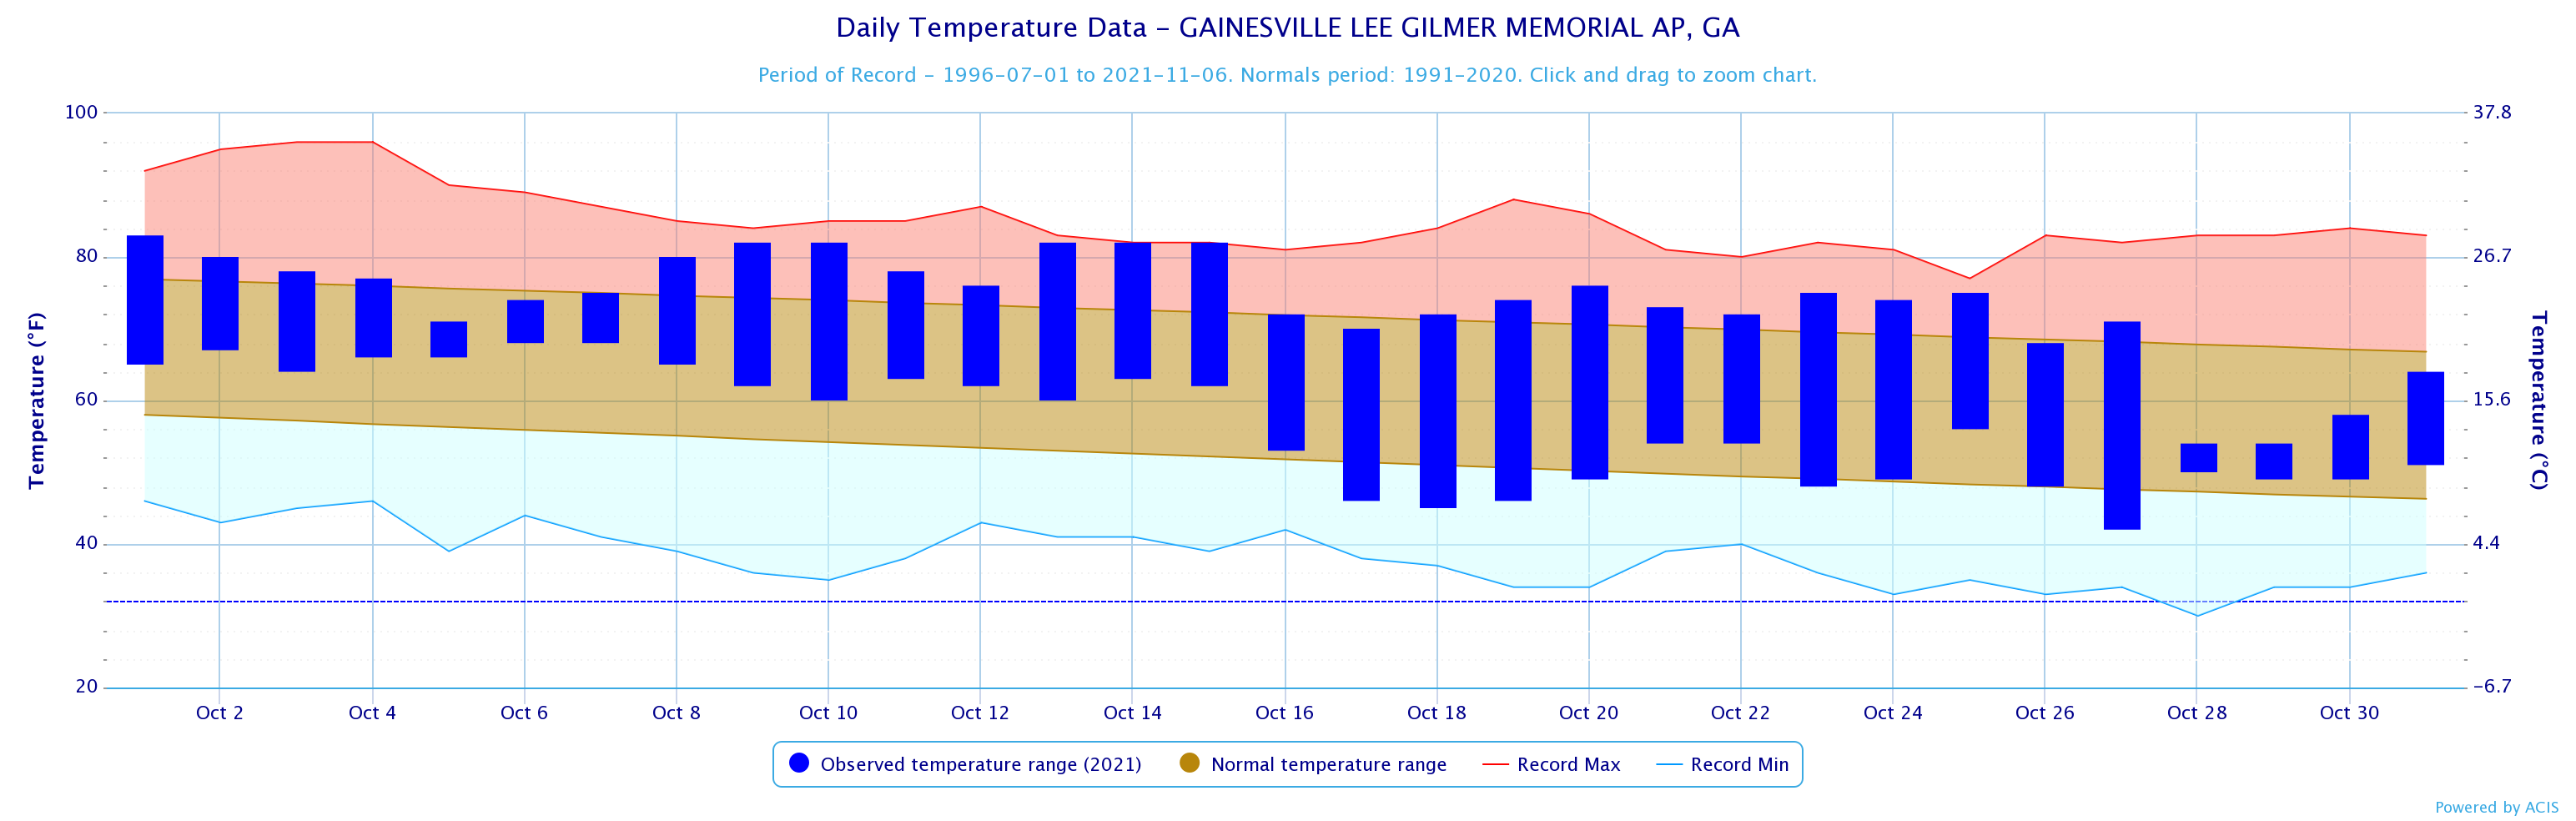
Gainesville
83
10/1
42
10/27
Peachtree City
87
10/1
40
10/18
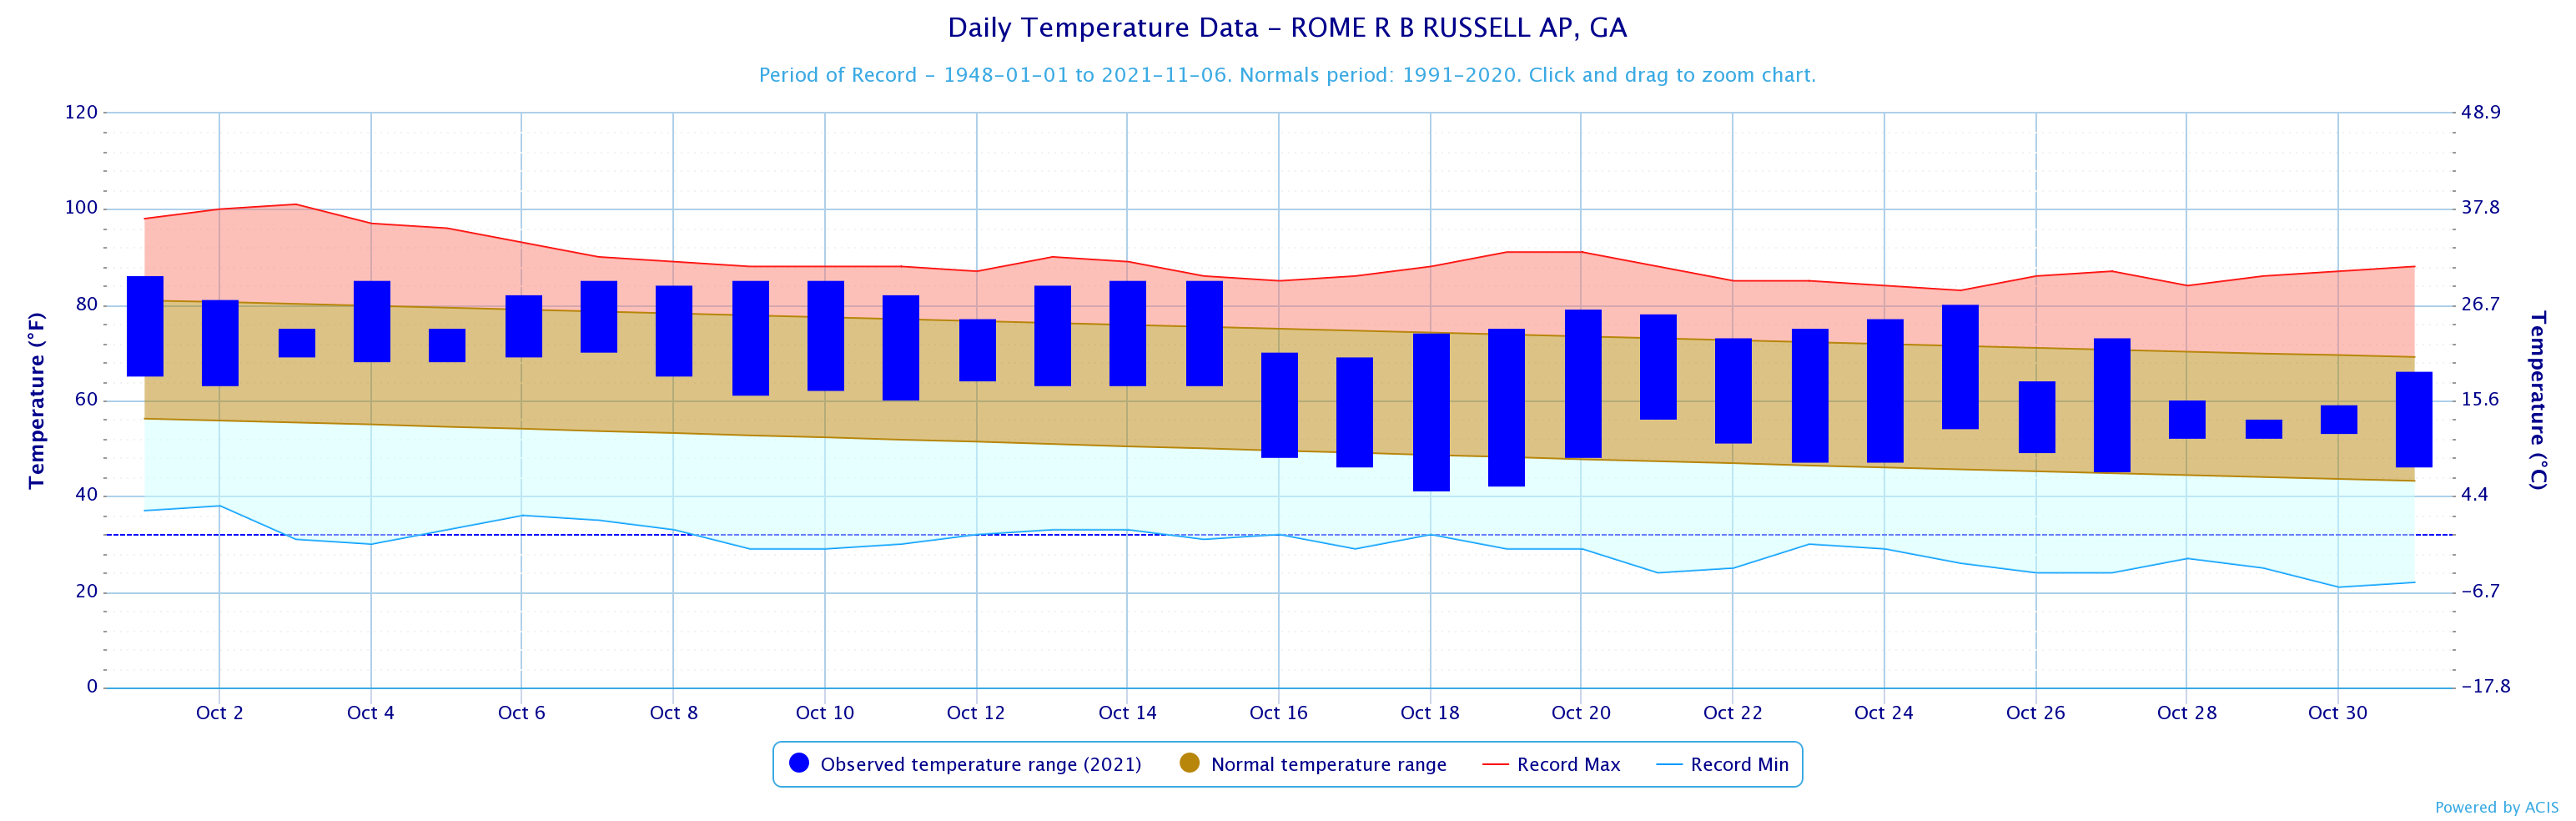
Rome
86
10/1
41
10/18
October 2021 Precipitation Climate Statistics
Average Precipitation
From Normal)
6.61
3.34
3.27
3.52
3.28
0.24
8.58
2.78
5.80
7.26
2.63
4.63
3.21
3.25
-0.04
2.58
3.39
-0.81
1.33
3.59
-2.26
7.43
3.85
3.58
4.33
3.37
0.96
3.26
3.75
-0.49
October 2021 Precipitation Climate Statistics
Athens
2.14
10/5
Atlanta
1.75
10/5
Columbus
6.72*
10/5
Macon
3.26*
10/6
Cartersville
1.34
10/7
Dekalb Peachtree Arpt
1.30
10/5
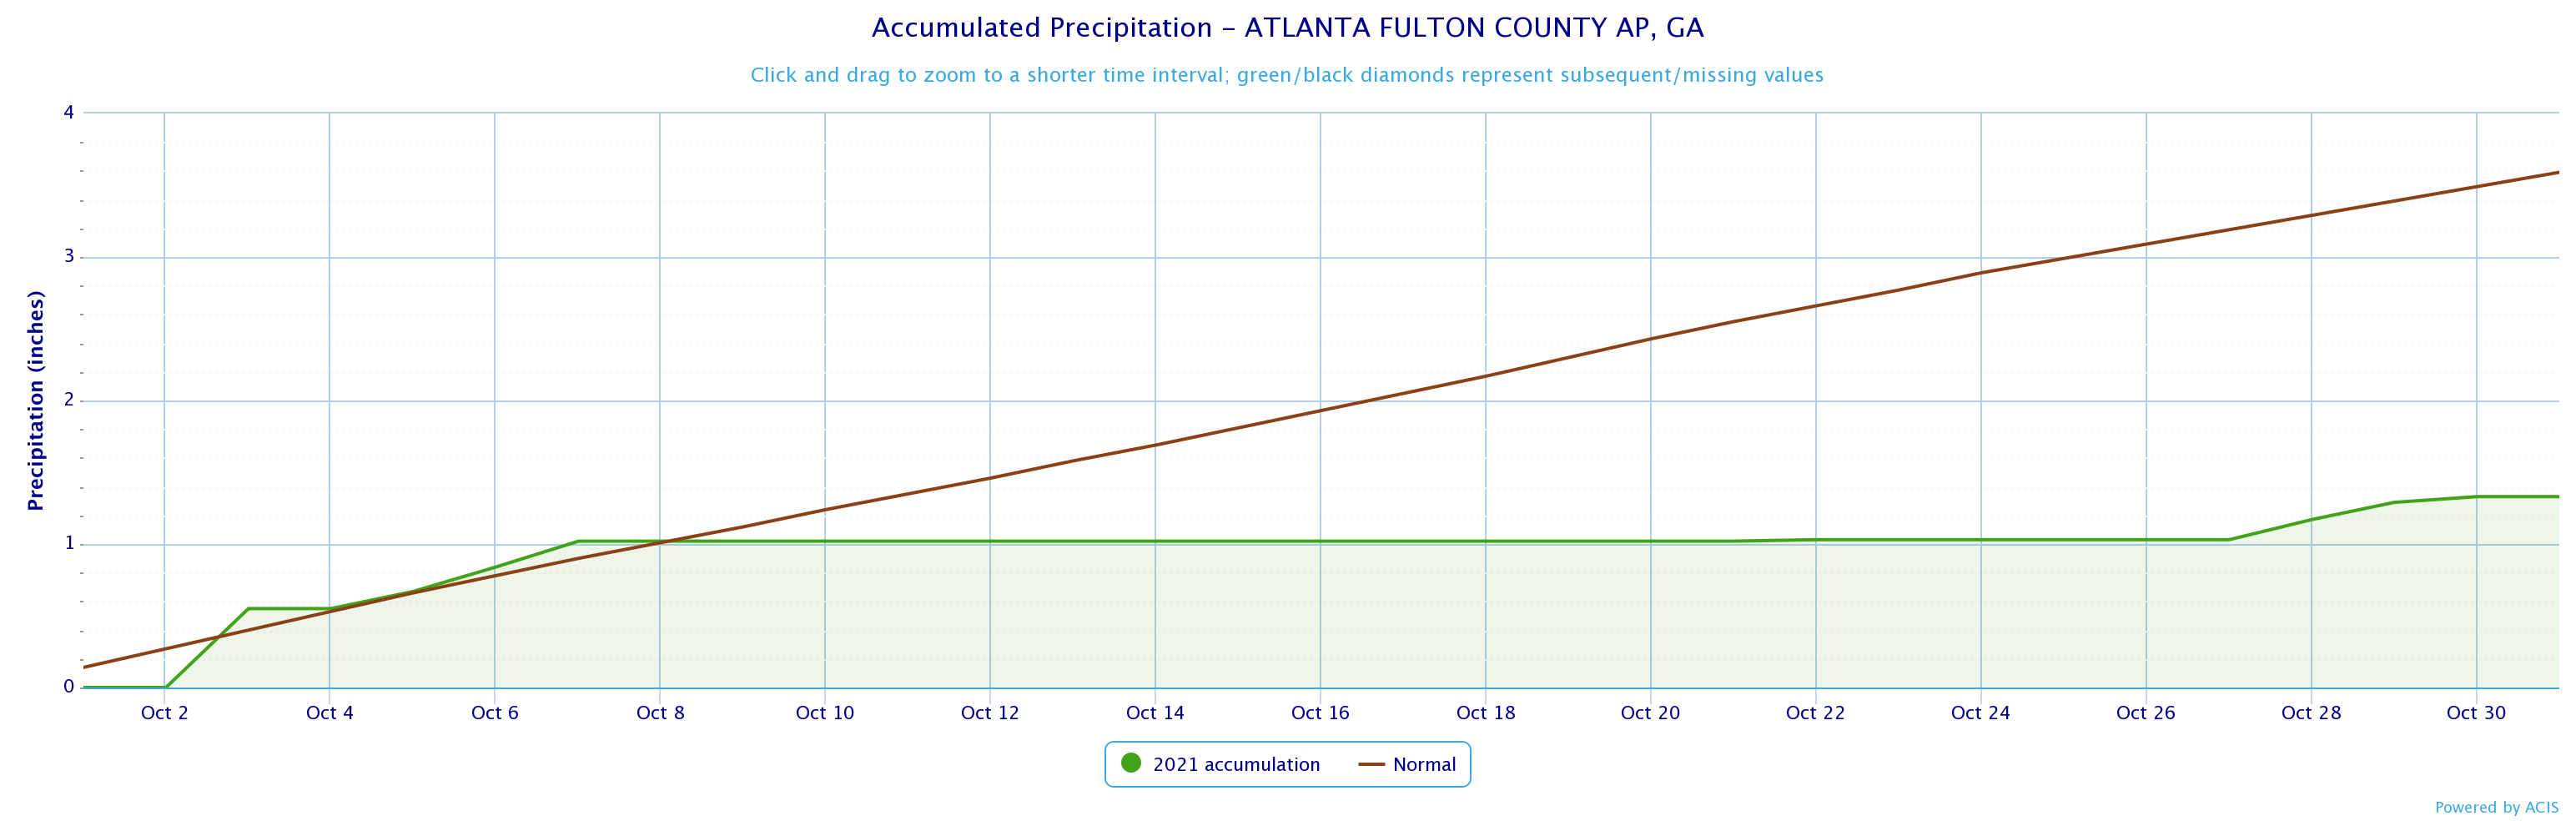
Fulton Co Arpt
0.55
10/3
Gainesville
2.88
10/5
Peachtree City
2.76
10/5
Rome
1.22
10/8
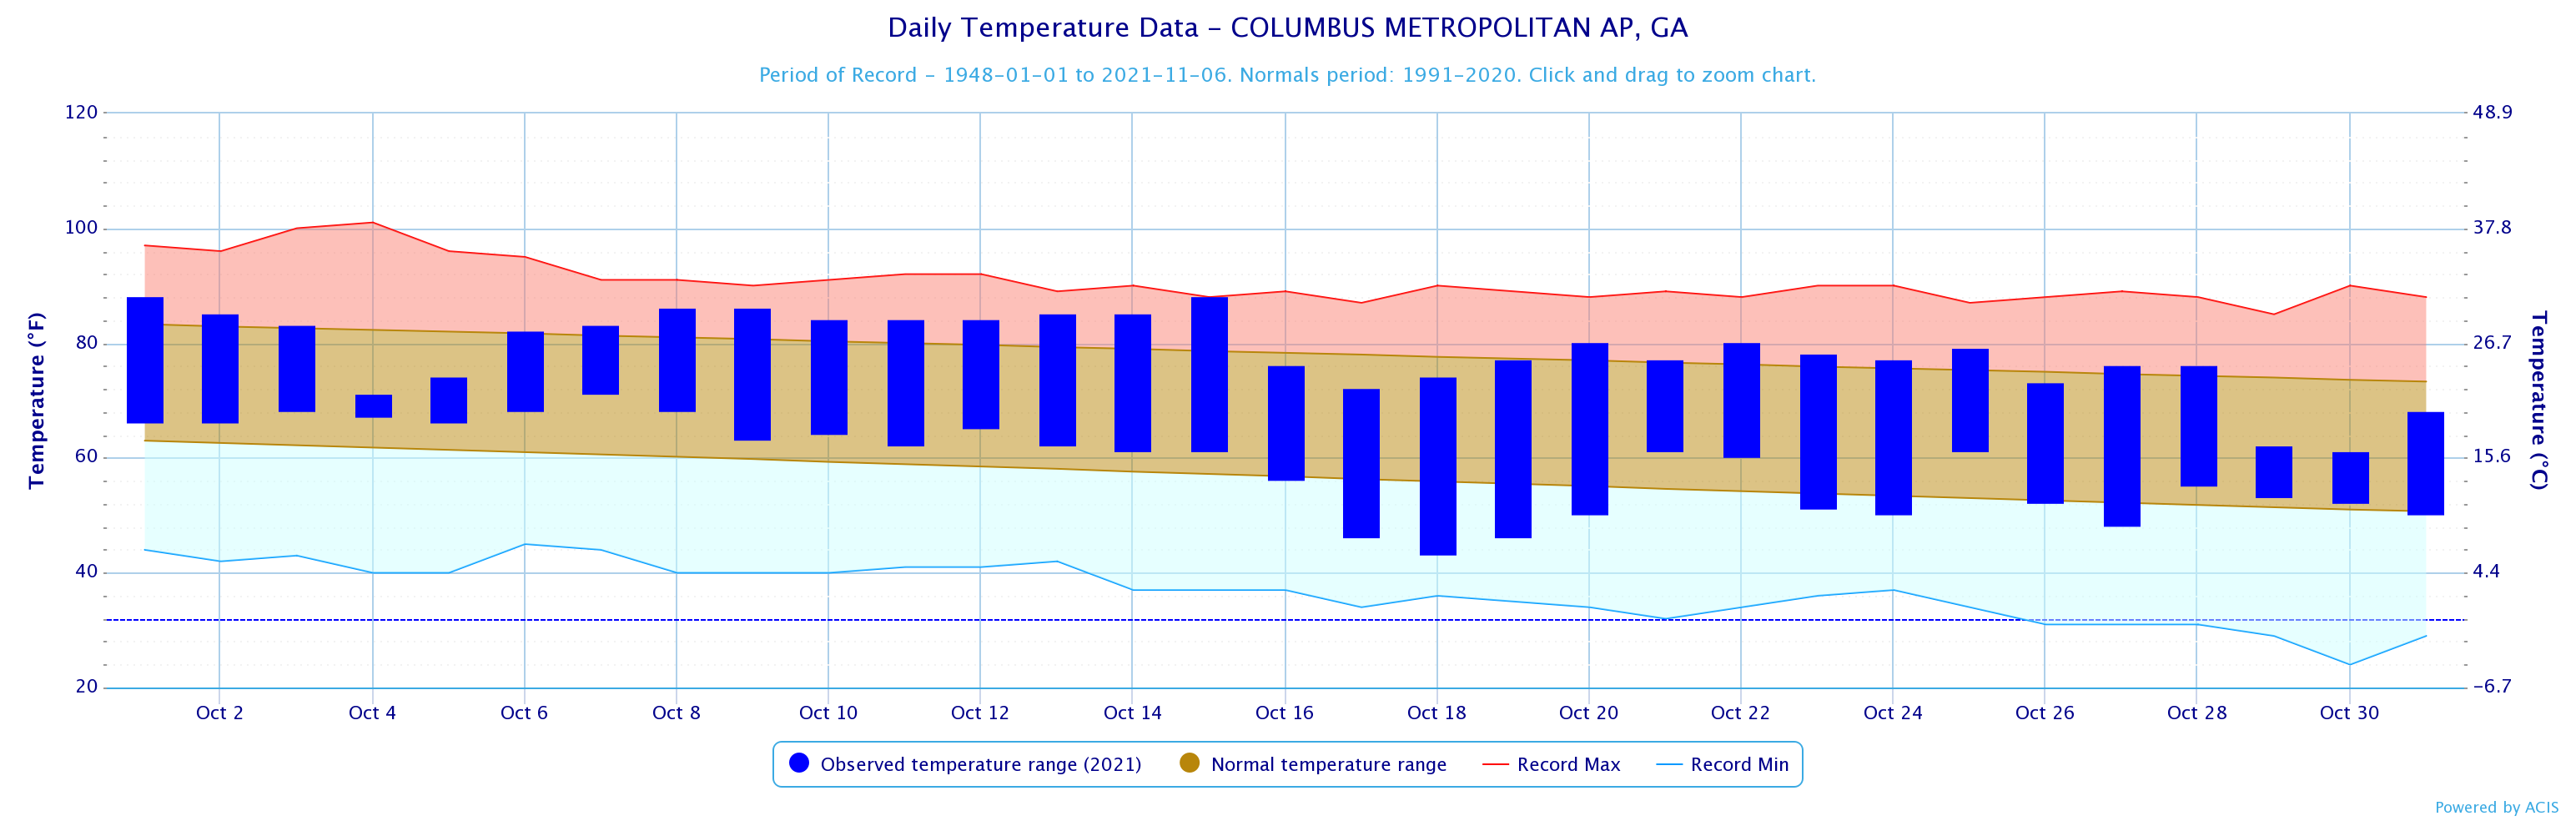
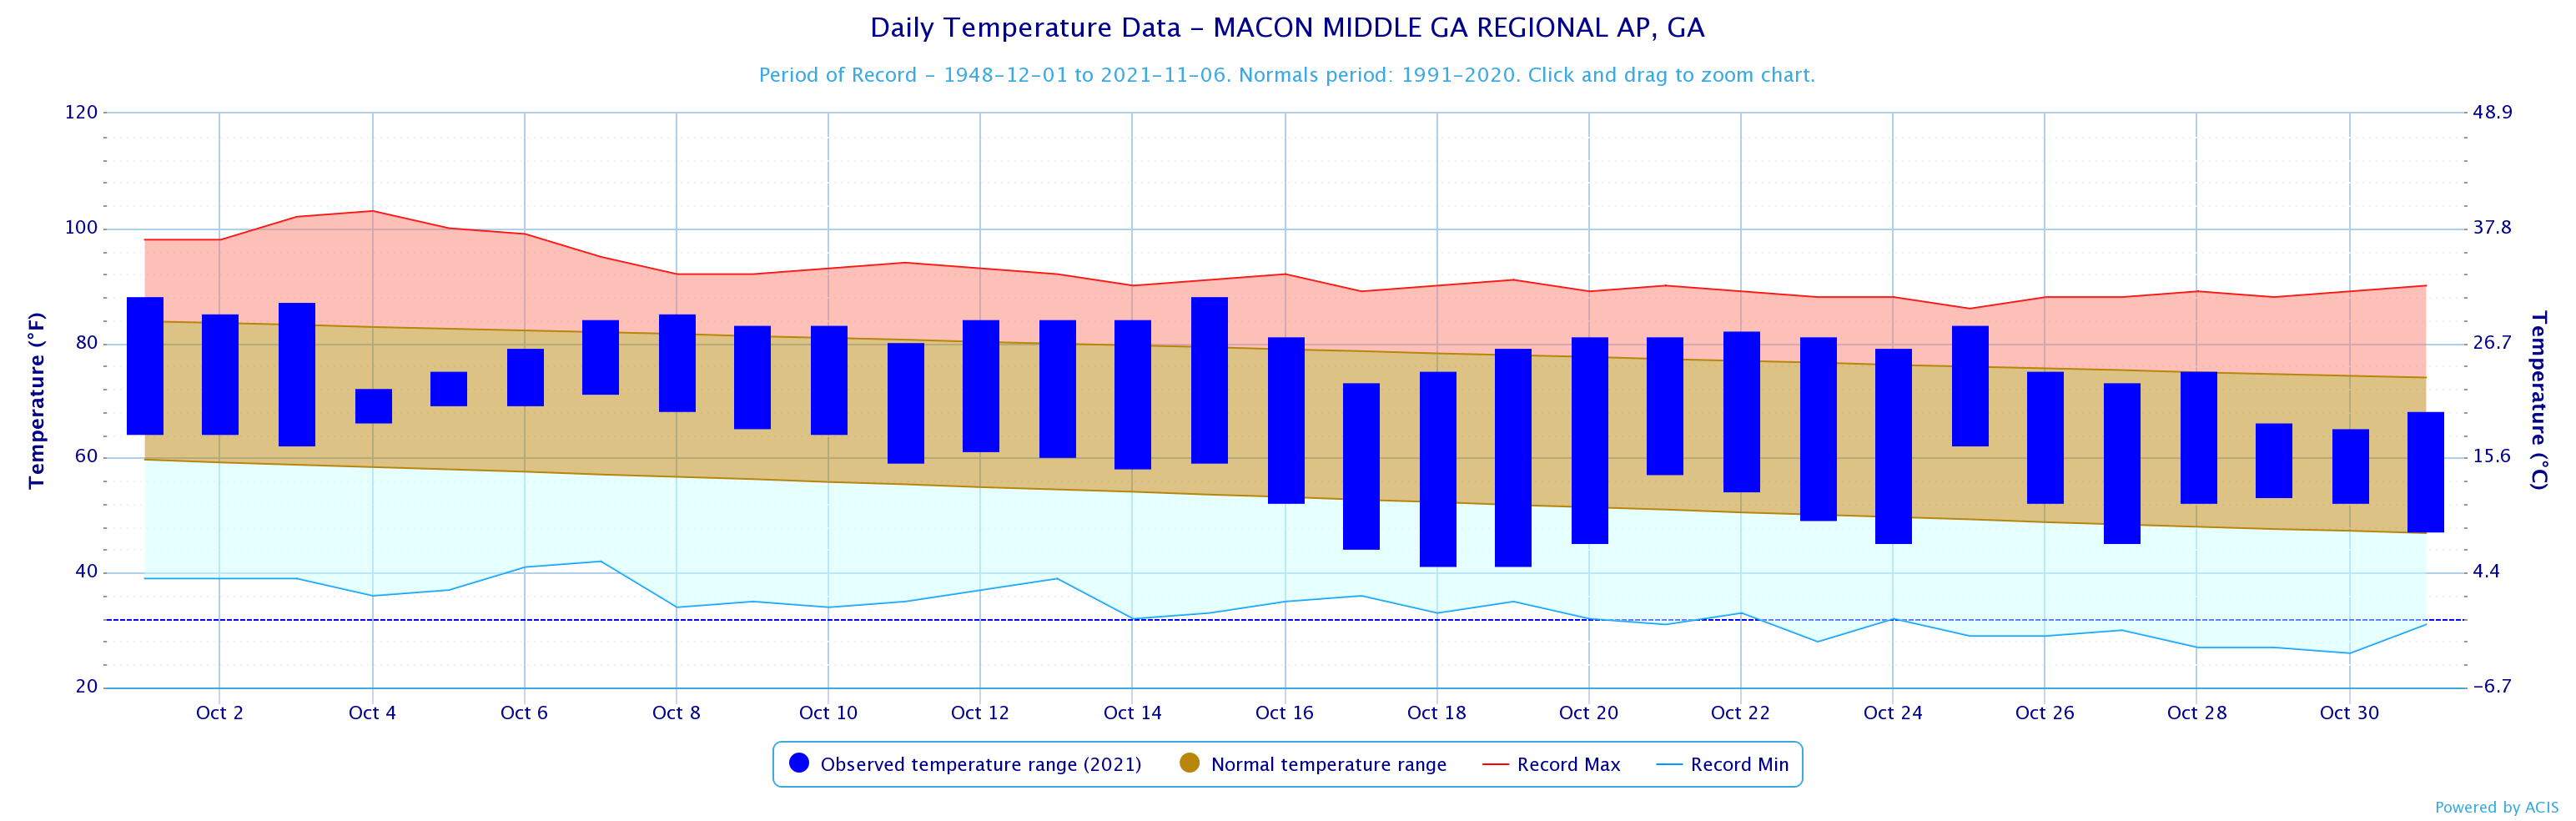
Click the links below to explore the temperature and precipitation data across north and central Georgia for the month of October.
Temperature Maps
Precipitation Maps
Temperature Graphs
Precipitation Graphs


.png)


Temperature and precipitation records at our 4 main climate sites are located below.
October 2021 Climate Records
Date
Type
Location
Records set over a 24 hour period
10/4
Daily Rainfall
Columbus
5.24 Inches of rain fell over 24 hours. This breaks the old record of 5.00 inches set in 1964.
10/4
Daily Rainfall
Macon
3.06 Inches of rain fell over 24 hours. This breaks the old record of 1.06 inches set in 1934.
Larger events that occurred across north and central Georgia this past October can be found here.
Rainfall Totals
Flash Flood Warnings


The November climate outlook is below.
November Outlook