Graphs of data from selected Automated Surface Observing System (ASOS) stations across central Indiana are now available. The graphs have data for high temperature, low temperature, precipitation, and snowfall (Indianapolis only). Graphs are available for the following sites (click the site to view data for that site):
This data can also be found in text table format on our climate page. (For daily data for a month, choose "Preliminary Climatology Data (CF6)")
Examples of data available are below:
Latest 31 Day High and Low Temperature Plot:
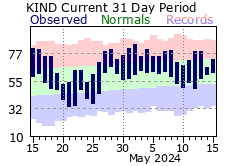
In the above image, the high temperature for a day is at the top of the blue bar, while the low temperature is at the bottom. For the background colors, green represents the normal range. Red represents the record high temperatures, while blue represents the record low temperatures. Record temperature values are only available for the Indianapolis International Airport.
Latest 31 Day Precipitation Plot:
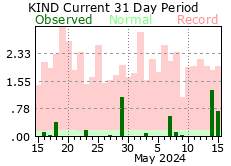
In the above image, the daily precipitation amounts are shown by the dark green bars. For the background colors, light green represents the normal daily precipitation and red represents the record daily precipitation amounts. Record precipitation amounts are only available for the Indianapolis International Airport.
Yearly Summary Plot:
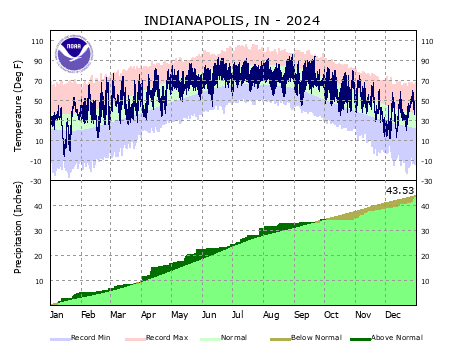
In the above image, temperatures are represented by the solid blue line in the top half of the image. The green background represents the normal range, while red and blue background represents record high and low temperatures respectively. On the bottom half of the image, precipitation information is given. The yellow line indicates the normal amount of precipitation for the year to date. The current year-to-date total is given in text at the latest date available.


 Follow us on YouTube