|
|
|
|
||||||||||||||||||||||||||||||||
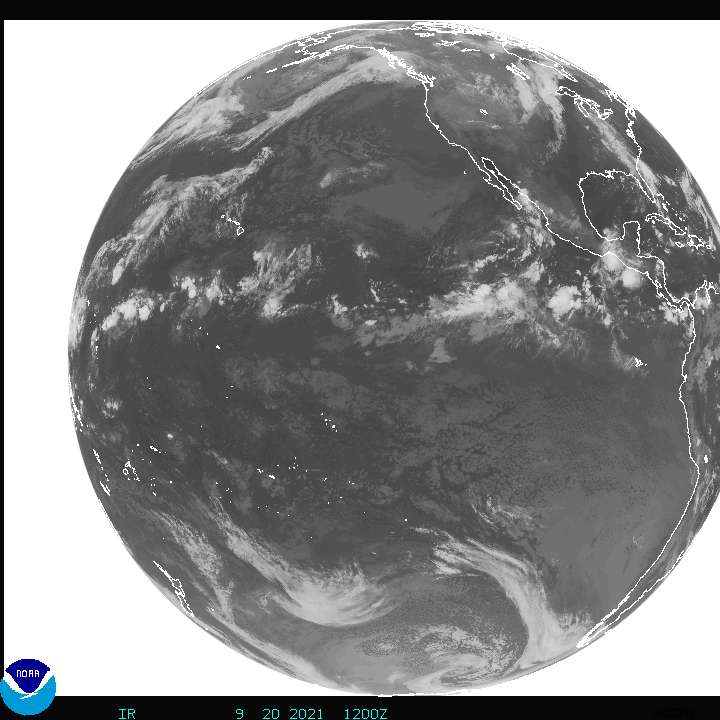
Background The satellite links listed on this page display images from GOES satellites. The acronym GOES stands for Geostationary Operational Environmental Satellite. Geostationary means the satellite is in orbit at a fixed point above the earth's surface. There are currently two GOES satellites that are being used operationally by the National Weather Service: GOES-East and -10. GOES-East was launched from Cape Canaveral on July 23, 2001 and then positioned at 75 degrees west longitude. It was deployed into service on April 1, 2003, replacing GOES-8. To the west is GOES-10, positioned at 135 degrees west longitude. It was launched from Cape Canaveral on April 24,1997 as a backup. When GOES-9 failed in July 1998 (due to a failure of its momentum wheel), GOES-10 was immediately placed into full-time service. Both satellites are in geostationary orbit at an elevation of 22,240 statute miles (35,790 km) and have a life expectancy of 5 years. GOES-East operations primarily support the eastern half of North America and the West Atlantic, and has thus picked up the alternate name of GOES-EAST. GOES-10 supports the western half of North America and the East Pacific, and is also called GOES-WEST. Satellite images are kept in Coordinated Universal Time (UTC).
|
||||||||||||||||||||||||||||||||
| Images
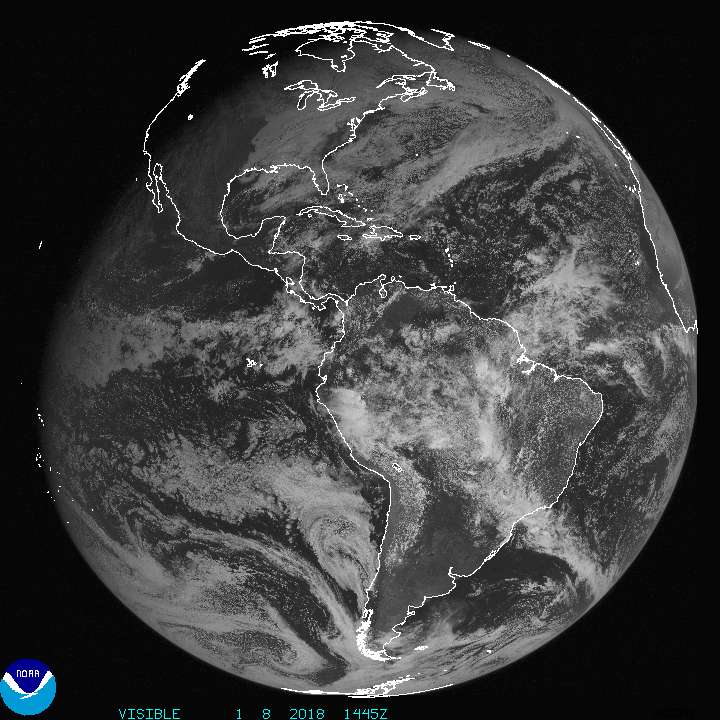
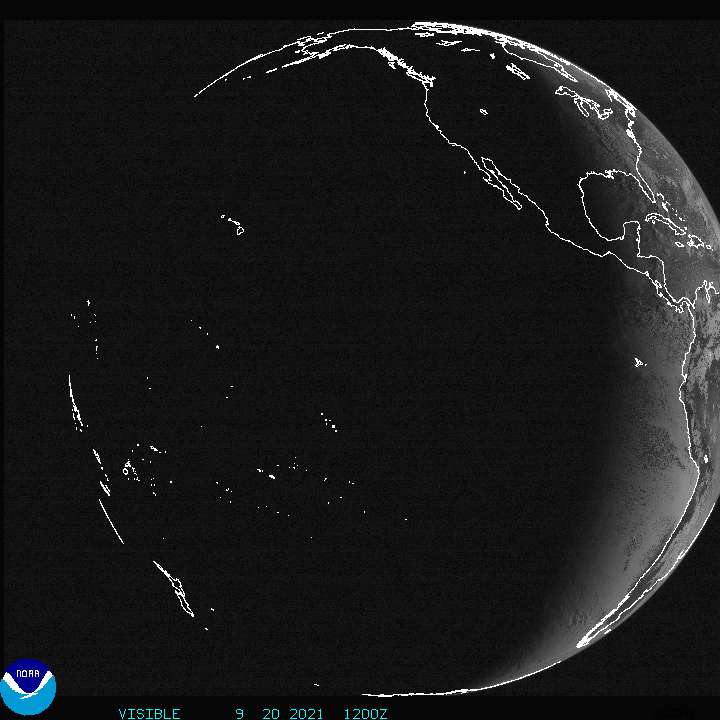
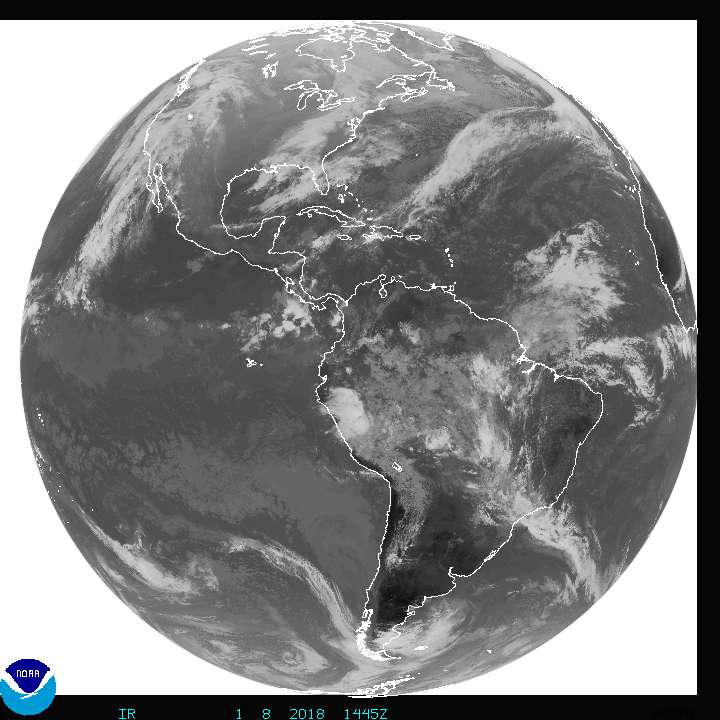
The table below includes satellite pictures from the onboard sensor called the imager. These are the products most of the public is familiar with and sees rather regularly through the news and other media sources. Just click on one of the yellow boxes and visit the world of satellite imagery! Images will open in a new browser window. |
||||||||||||||||||||||||||||||||
|
|
|
||||||||||||||||||||||||||||||
|
||||||||||||||||||||||||||||||||
Loops To view excellent satellite loops visit the RAMSDIS ONLINE site provided by the NOAA-CIRA Regional and Mesoscale Meteorology Team at Colorado State University or the NOAA /FSL site. Trying to view these loops with a slow connection will take some time. The NOAA/FSL site downloads the quicker of the two. |
||||||||||||||||||||||||||||||||
Regional Hi-Resolution Images from the Texas Commission on Environmental Quality
|
||||||||||||||||||||||||||||||||
Click here for Satellite Derived Convective and Precip data Click here for Satellite Derived Temperature/Wind Sounding Products |
||||||||||||||||||||||||||||||||


 Follow us on YouTube