
Hurricane Erin - Early August 1995
First Center of a Hurricane to Move Across the Pensacola Area since 1926
 Erin initially formed from a tropical wave that crossed the coast
of Africa into the tropical eastern Atlantic Ocean on July 22nd, 1995.
As this tropical wave moved across the tropical Atlantic, Hurricane
Hunter aircraft data on July 28th, 29th, and 30th indicated that the
system did not have a closed circulation at low levels. The aircraft
data late in the evening on the 31st revealed that Tropical Storm
Erin had formed.
On the evening of July 31st, Erin intensified into a Category 1
Hurricane near Rum Cay in the Bahamas. By the 1st of August,
satellite imagery began showing an eye associated with Erin. Not
too much longer after the eye appeared, Erin made its first landfall
early on August 2nd near Vero Beach, FL as a Category 1 hurricane
with 85mph winds.
Tropical Storm Erin emerged in the Gulf of Mexico later on August
2nd and began to re-intensify after traversing the Florida peninsula.
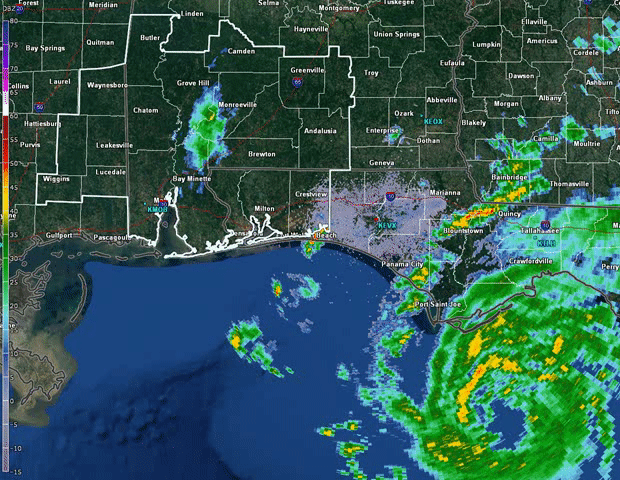
Erin began moving northwest at about 12mph and turned toward the northwest Florida panhandle early on Thursday morning. Erin re-developed an eye (as seen in the radar loop), but the upper-level outflow was not overly impressive on satellite imagery. To view the HD version of Hurricane Radar on both KEVX & KMOB radars, visit our YouTube page.
The center of Erin moved ashore for a second time at 920am along Santa Rosa Island at Highway 399 (between the National Seashore Day Use Center and the west end of Navarre Beach). At landfall, Erin was a Category 2 Hurricane with 100mph winds in a small section of its northeastern eyewall.
Erin moved across the city of Pensacola and into Baldwin County, AL near I-10 and the Perdido River areas around 1130am. The eye of Erin began filling in as it moved across Baldwin County and Erin began to progressively weaken. It continued to track northwest through southwestern Alabama during the afternoon hours on August 3rd. Erin weakened to a tropical storm as it moved into southeastern Mississippi overnight. As Erin weakened further and became a tropical depression, its track shifted more to the north by the 5th of August and more to the east by the 6th. Tropical Depression Erin finally merged with a frontal system over West Virginia on the 6th of August.
The lowest sea level pressure recorded during Erin was 976mb at Pensacola Naval Air Station. Mobile Regional Airport also recorded 997mb sea level pressure during Erin. There were no reported injuries or deaths across the northwest Florida panhandle or extreme southwest Alabama from Erin.

Photo courtesy of NOAA, Office for Coastal Management, DigitalCoast
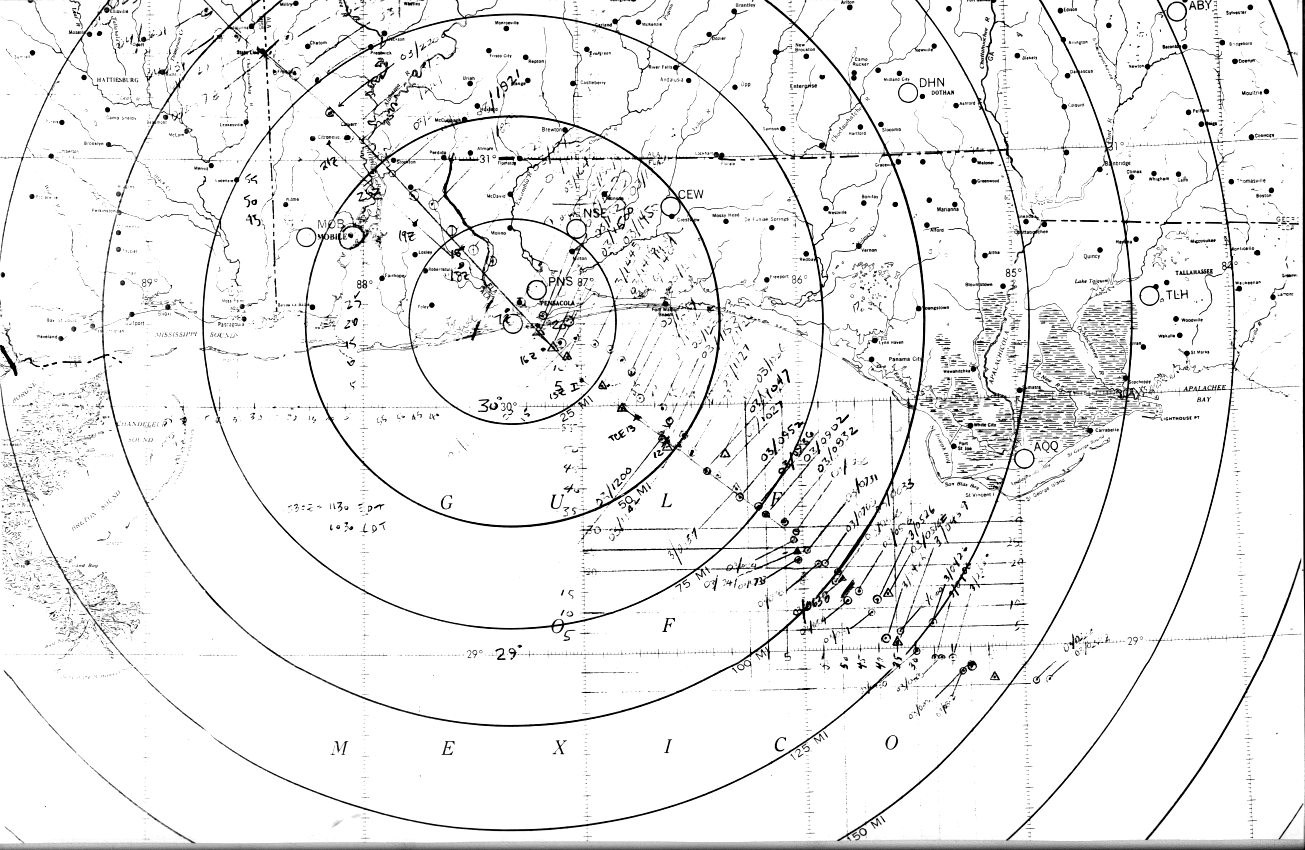
Surface Hand Analysis from Hurricane Erin on August 3rd, 1995 (via NHC Storm Wallet)

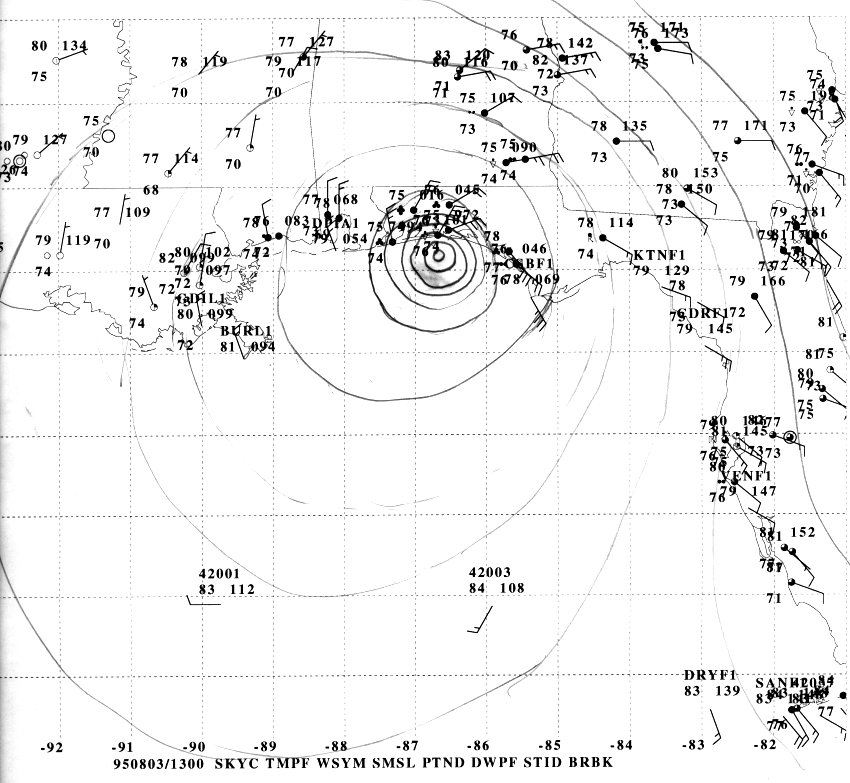

10 UTC 13 UTC 20 UTC
The majority of this document will focus on the impacts across the northwest Florida panhandle and extreme southwest Alabama. Below are some of the regional impacts...
Jump to - Rainfall, Wind, Tornadoes, Storm Surge, Animations, Imagery, or Additional Information sections.
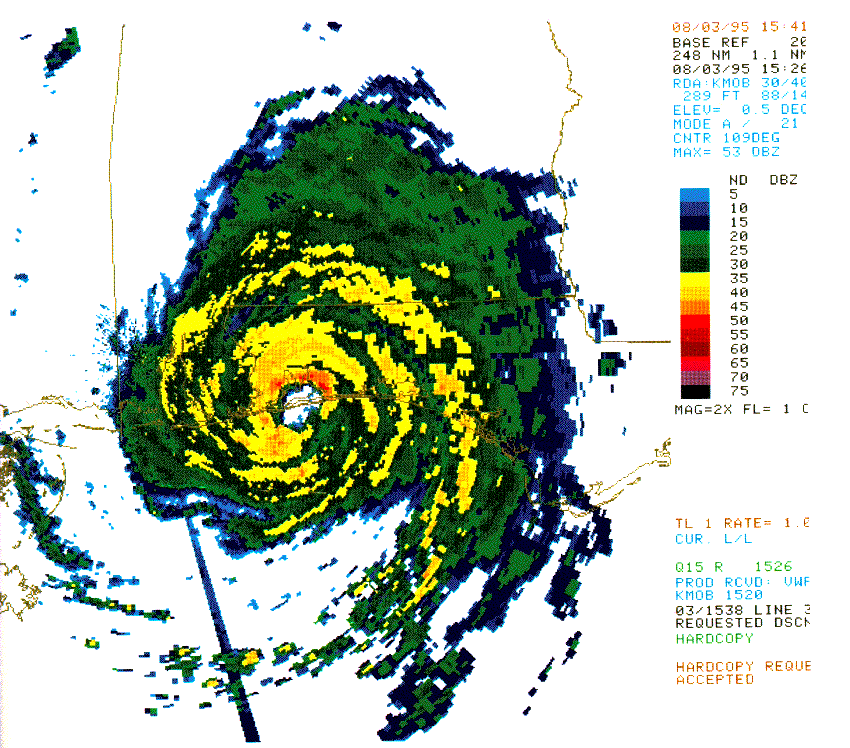
The eye of Hurricane Erin making landfall along the northwest Florida panhandle on August 3, 1995.
The rainbands on the eastern side of Erin's eye brought the highest rainfall totals to northwest Florida and southwest Alabama as denoted in the WPC graphic shown below. KMOB and KEVX radars estimated that 5+ inches of rain fell across the path of Erin. In the northwest Florida panhandle, the Mary Esther area (just west of Fort Walton and Destin) recorded approximately 4 inches of rain in a 24 hour period. Further inland, Milton recorded 3.76 inches and Pensacola recorded 2.19 inches of rain from Erin.
For southwest Alabama, the highest 24 hour rainfall total occurred in Fairhope where 3.92 inches of rain was measured. The Mobile Regional Airport reported 2.56 inches of rain during Erin. Here is a look at the rainfall map for the southeastern US during Hurricane Erin's lifetime. Photo courtesy of NCEP - WPC.

 Highest winds associated with Erin were measured as it moved ashore
across the northwest Florida panhandle. Pensacola Naval Air Station
recorded sustained winds of 64mph with gusts up to 101mph. At
Hurlburt Field in Mary Esther, wind speeds were measured at 80mph
with gusts to 97mph. Navy Whiting Field in Milton measured 50mph
with gusts to 58mph while the Pensacola Regional Airport measured
wind speeds to 71 mph and gusts to 90mph.
The most significant structural damage from Erin occurred during the
second landfall across Pensacola Beach, Navarre Beach, around Mary
Esther and in northeast Pensacola. As Erin traversed across the
northwest Florida panhandle, trees and power lines were blown down
and numerous homes sustained damage. Preliminary damage estimates
were around $230 million. More than 2,000 homes were damaged and
the power companies estimated 63% of their customers were without
power after Erin. Crops suffered damage with approximately 1/2 of the
cotton and 20-25% of the pecan crop damaged. The damage to crops was estimated at $5 million.
The highest winds across southwest Alabama were recorded in Fairhope (Baldwin County) with sustained winds of 37mph and gusts to 50mph. At the airport in Atmore (Escambia County), the wind gusts were estimated to be more than 100mph! At the Mobile Regional Airport, winds only increased to 29mph winds during Erin, however, the gusts were up to 50mph.
Erin maintained a broad eye - nearly 15 miles wide - as it moved ashore. Most of the damage from Erin occurred on the eastern side of the storm. Widespread tree, power line, and crop damage happened as Erin moved through southwest Alabama. Over 100 homes were damaged across southwest Alabama. Preliminary damage estimates were around $25 million for southwest Alabama. More than 100 homes were damaged due to Erin’s wind. It was estimated that 50-75% of Baldwin County's pecan crop was lost!
Table 1 - Observed Winds (both sustained and gusts) during Hurricane Erin
|
Location
|
Sustained Wind (mph)
|
Peak Wind Gust (mph) |
| FLORIDA | ||
| Hurlburt Field | 81 (est.) | 98 (est.) |
| Pensacola Airport | 69 | n/a |
| Pensacola Naval Air Station | 63 | 101 |
| Whiting Field | 51 | 59 |
| Eglin AFB | 50 | 67 |
| Destin | 41 | 51 |
| ALABAMA | ||
| Fairhope | 37 | 50 |
| Mobile Regional Airport | 29 | 51 |
| C-MAN Stations | ||
| Dauphin Island (DPIA1) | 41 | 51 |
Hurricane Erin spawned at least 4 tornadoes in northwest Florida before making landfall on August 3rd. Each of these tornadoes were short lived and F0 in strength. Most of the damage associated with the weak outer rainbands of Erin was confined to trees being blown down and damage to several houses in Pensacola Beach and Navarre Beach. No fatalities or injuries occurred with these tornadoes.
Tornado Information:
Okaloosa County - F0 tornado near Hurlburt Field, F0 tornado in Mary Esther
Santa Rosa County - F0 tornado at Navarre Beach
Escambia County - F0 tornado at Pensacola Beach
NOTE: The F scale was still used to rate these tornadoes in 1995. As of 2007, the NWS now uses the EF scale to rate tornadoes.
The highest storm surge of 6-7 feet was found just east of where the storm moved ashore (across the western portion of Navarre Beach). Storm surge along Pensacola Beach was 3-4 feet. Minor erosion occurred predominately west of the Navarre Beach area.
 Hurricane Erin Animated Radar (KEVX & KMOB)
Imagery
NOAA Digital Coast - Hurricane Erin Track
CIMSS/UWM - Hurricane Erin Satellite Archive
LOCAL Damage Photos:
Northwest Florida & Southwest Alabama
More Information (Technical Papers and Assessments)
Monthly Weather Review - Atlantic Hurricane Season of 1995
Monthly Weather Review - Surface Wind Fields of 1995 Hurricanes Erin, Opal, Luis, Marilyn, and Roxanne at Landfall
WPC Summary - Erin
NHC Tropical Cyclone Report - Erin
NWS Local Write-Ups and Webpages:
NWS Melbourne
Acknowledgements: Page created by Morgan Barry (Forecaster) with contributions from Don Shepherd (Senior Forecaster, Tropical Focal Point).
LAST UPDATED: September 2022


 Follow us on YouTube