
Heavy to excessive rainfall may lead to flooding today over southwest Pennsylvania into northern West Virginia, and western Maryland. Severe thunderstorms are possible this afternoon and evening in the Mid-South and across Eastern North Carolina. An extended period of hot weather is forecast for parts of coastal southern California including Los Angeles from today through Thursday. Read More >
Monthly Precipitation Anomalies |
|
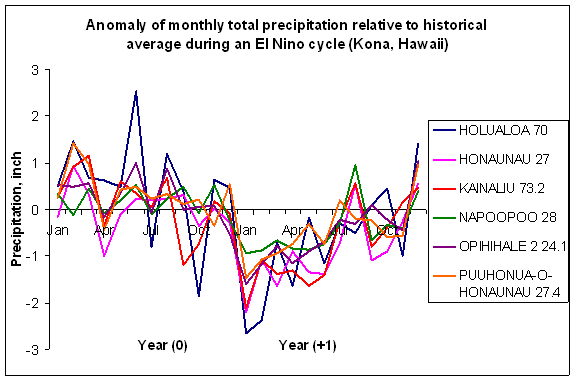
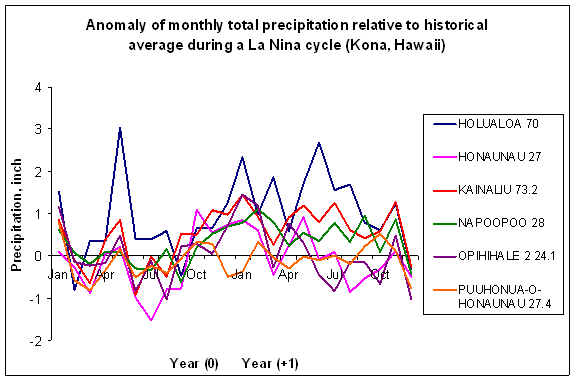
Figure 3 |
|
a) |
 |
b) |
 |
|
|
|
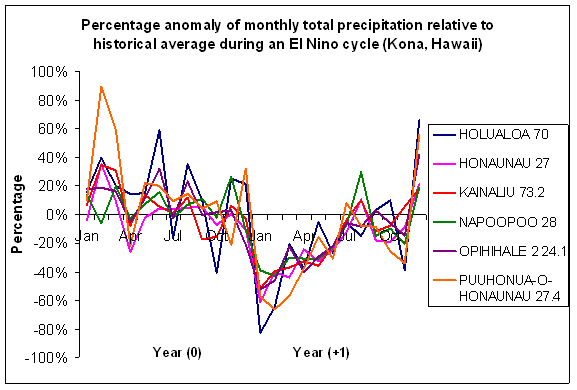
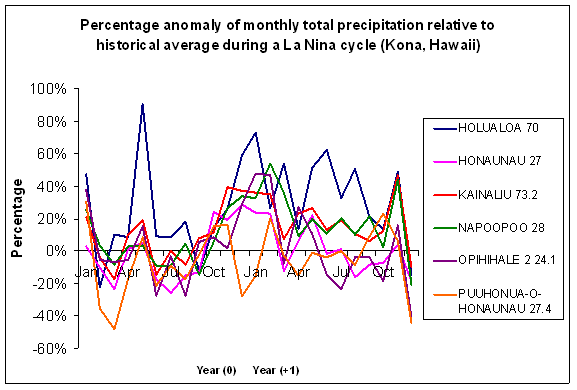
Figure 4 |
|
a) |
 |
b) |
 |
|
|
|
|
Both Fig. 3 and Fig.4 show the deviation from the monthly total precipitation relative to historical average given in Fig. 2. and Table 1. However, the information in Fig. 3 is in unit of inches, while that in Fig. 4 is presented by percentage. |
|
|
The monthly total precipitations at all six stations are slightly more than historical average during the El Niño year. However, from January to June of the year after an El Niño event, there is deficient precipitation. The maximum difference could reach as much as 3 inches (around 80%) less than its historical average amount at one station. During a La Niña event, on the other hand, moderate deficient precipitation took place in the first half of the La Niña year. While from October to the end of the next year there is more precipitation. Usually, there is 1-2 inches, or 20-40%, more than the historical average. |
|
Back to study |
|

