
The initial circulation that would become Hurricane Nate formed within an unusually large area of low pressure across Central America called a cyclonic gyre. This large area of low pressure interacted with abnormally high oceanic heat content across the western Caribbean Sea to set the stage for tropical cyclone formation. Nate was the season’s fourteenth named storm and the ninth hurricane of the 2017 Atlantic hurricane season.
Early Life
The National Hurricane Center (NHC) began watching the waters east of Central America for development on October 2nd. Upper level winds were not conducive for tropical cyclogenesis but the area of disturbed weather had the potential to develop with time as the upper level winds slackened.
By mid-afternoon on October 3rd a broad area of surface low pressure began to consolidate over the southwestern Caribbean Sea just north of the Panama coast with NHC now giving the disturbance a medium chance of formation over the coming 5 days.
Computer models notoriously have a difficult time with track and intensity forecasts when a low level center has yet to form - this was indeed the case with what would become Hurricane Nate. Large low pressure systems like the one that spawned Nate can be slow to concentrate their spin/vorticity enough to allow rapid strengthening. The very warm waters of the southwest Caribbean Sea likely contributed to faster than normal consolidation of low pressure across the region and the disturbance showed signs of strengthening almost immediately after the surface low began to take shape. Curved convective banding was evident on satellite imagery during the day on October 4th, therefore NHC upgraded the disturbance to Tropical Depression #16 during the 11am update.
 The newly-formed depression was steered to the north and west by a large area of high pressure extending from the southwest Atlantic Ocean across the Greater Antilles and the Caribbean Sea. This trajectory allowed the storm to approach the coast of Nicaragua while the pressure continued to drop and winds increased. The depression was upgraded to Tropical Storm Nate on October 5th.
Land interaction with the Central American coastline caused some modest disruption in Nate’s cloud pattern but winds remained at or above tropical storm force (>39mph), mostly to the east of the low level center. Any disruption in the inner core of Nate was short-lived as deep convection formed near the center prior to reemerging out over the warm ocean waters of the Gulf of Honduras early on October 6th.
Steady Strengthening
 As the center of circulation left behind the detrimental effects of land interaction, the steady strengthening process resumed with Nate becoming the season’s 9th hurricane early on October 7th. Satellite presentation continued to improve as Nate threaded the needle of the Yucatan channel between Mexico’s Yucatan Peninsula and the west coast of Cuba. Of note was the extremely rapid north northwesterly motion that Nate attained. A 12-hour average of the system’s motion early on October 7th yielded a forward motion of 28mph - making Hurricane Nate the fastest moving hurricane on record in the Gulf of Mexico.
Rapid forward motion would continue up through the eventual US landfall, which had large implications for impacts along the northern Gulf Coast with a larger than usual extension of the highest wind speeds near and to the east of the center’s location. In addition, the fast forward motion did not allow Hurricane Nate to take full advantage of the warm waters across the central Gulf of Mexico and Nate was likely much weaker than it could have been if the circulation had more time over the open water before landfall.
Approach and Landfall
Nate developed a central dense overcast (CDO) on October 7th with satellite cloud temperature estimates nearing -90ºC with of a 20 mile wide eye under the overlying cloud cover.

Hurricane Hunter aircraft measured winds of 90mph and a central pressure of 981mb prior to the 11am NHC update. This data, along with generally favorable conditions for strengthening in the hurricane’s path, led to increasing intensity forecasts with Nate now forecast to make landfall as Category 2 Hurricane late on October 7th or early on the 8th. Luckily, increasing southwesterly wind shear and some dry air beginning to wrap into the core began to halt the intensification process that afternoon as the circulation continued its rapid north-northwesterly motion toward the northern Gulf Coast. The storm’s cloud pattern began to degrade as the coldest cloud temperatures began to warm during the late afternoon.
Nate made its first landfall near the mouth of the Mississippi River around 7pm on October 7th with winds of 85mph. The storm’s forward motion slowed a bit as the anticipated northward turn began. The southwestern quadrant of the circulation began to lose its deep convection as the storm approached the Mississippi coastline. A second landfall occurred just west of Biloxi, MS after midnight on October 8th. Nate quickly took on a north-northeasterly motion after landfall as the circulation came under the influence of the mid-latitude westerlies.
Post Landfall
Nate was downgraded to a tropical storm prior to sunrise as frictional effects of land interaction and the increasing vertical wind shear began to substantially weaken the system. Surface observations indicated that Nate weakened to a tropical depression by the 11am NHC advisory. The circulation continued its northeastward motion across the southeast and into Ohio where the remnant low became extratropical.

Unfortunately, there were two deaths directly related to Hurricane Nate (rip current related). Two men drowned in the Gulf of Mexico near Fort Morgan (Baldwin County, AL) while attempting to rescue a child that fell into the high surf on the evening of October 9th.
Summary of all Local Storm Reports (LSRs) across the area during Hurricane Nate and LSRs across the region during Nate.
Hurricane Nate made landfall just to the west of our area (near Biloxi, MS), but significant impacts were felt across the entire region. The majority of this document will focus on the impacts from storm surge and winds across southeast Mississippi, southwest Alabama and northwest Florida. Below are some of the regional impacts...
Jump to - Rainfall, Wind, Storm Surge, Tornado, Post-Tropical Cyclone Report, or Additional Information sections.
Interesting Hurricane Nate-Related Stats
Nate was the 14th named storm of the 2017 Atlantic Hurricane Season and the 9th hurricane. Nate was the first hurricane in October to make landfall along the northern Gulf Coast since the 2002 Atlantic Hurricane Season (Hurricane Lili - more info here). As of this writing (mid-October 2017), there have been 10 consecutive named storms in the Atlantic basin that reached hurricane status: Franklin, Gert, Harvey, Irma, Jose, Katia, Lee, Maria, Nate, & Ophelia. As mentioned in the next section, Nate holds the record for the fastest forward motion (28 mph) of a hurricane across the Gulf of Mexico.
 Nate’s 28 mph forward motion kept rainfall totals relatively low across the region (in comparison to rainfall totals produced by a slower moving system) with the highest amounts located on the east side of the hurricane. Storm total rainfall amounts generally ranged from 2-7 inches across inland locations with 7-10 inches of rain observed across the coastal counties. The wide spread of rainfall totals across the area can be seen in the image to the right (courtesy of NWS Birmingham). The highest storm total rainfall of 9.93 inches occurred at a CoCoRaHS site near Gulf Breeze in Santa Rosa County, FL. Another CoCoRaHS observer in Crestview, FL (Okaloosa County) observed 8.15 inches of rain during Hurricane Nate. Other notable storm total rainfall amounts (above 7 inches) occurred across Mobile and Baldwin Counties in southwest Alabama with 7.71 inches in Foley, 7.37 inches in Tillmans Corner, 7.20 inches in West Mobile, and 7.06 inches in Orange Beach, AL.
Across northwest Florida, numerous roads and bridges were closed in Santa Rosa County due to water flowing over the roads. A few roads became impassable across Okaloosa County due to flash flooding as well.
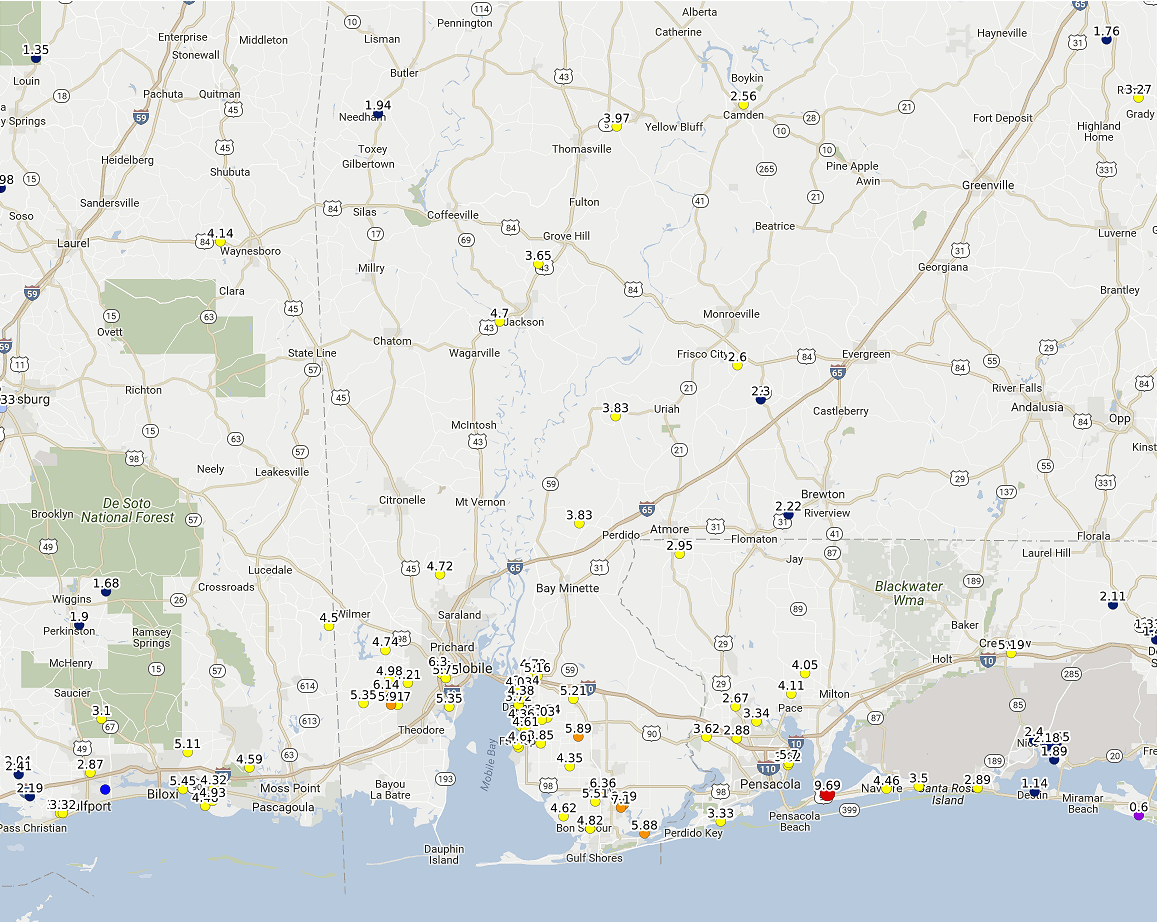
A breakdown of the CoCoRaHS rainfall reports from October 8th (not the entire storm total rainfall) can be viewed in the map below. A full list of rainfall totals can be found in the Post-Tropical Cyclone Report at the bottom of this webpage.
Wind gusts of 50+ mph were observed across the entire coastal area during Hurricane Nate with the strongest winds nearest to the center of Hurricane Nate across Mobile County, AL and George County, MS and also along the immediate coastline. The highest wind gusts observed across the region were at Mobile Regional Airport with gusts to 66mph early in the morning on October 8th. Both the ASOS in Destin, FL and C-MAN Station near Dauphin Island, AL measured wind gusts to 58mph during Hurricane Nate.
Across southwest Alabama, scattered power outages and downed trees occurred throughout Mobile and Baldwin Counties after Hurricane Nate with the greatest coverage occurring on Dauphin Island in southern Mobile County. Damage from the wind also occurred to a factory in Calvert (far northeastern Mobile County). Numerous downed trees and power lines occurred across Clarke, Choctaw, and Washington Counties in southwest Alabama. An estimated 4500 houses were without power due to the hurricane in Washington County with another 4200 houses without power in Clarke County. Downed trees damaged houses and vehicles in Clarke and Butler Counties.
In southeast Mississippi, numerous trees were downed throughout George County. Several houses reported minor roof and shingle damage and one mobile home was destroyed after a tree fell on it during Hurricane Nate. A total of 7,000 power outages were reported across George County. Downed trees and power outages were also noted in Greene and Wayne Counties in southeast Mississippi after Hurricane Nate.
A list of land and marine wind gusts (converted to mph) can be found in the table below.
| Location | Wind Gust (mph) |
| LAND SITES | |
| KMOB - Mobile Regional Airport | 66 |
| KDTS - Destin | 58 |
| XBUC - Buccaneer Yacht Club - WF | 56 |
| KBFM - Brookley Field | 54 |
| KPNS - Pensacola Regional Airport | 53 |
| KNPA - Pensacola NAS | 53 |
| KHRT - Hurlburt Field | 52 |
| Loxley - USA CHILI | 51 |
| KVPS - Eglin AFB | 48 |
| XGLF - Foley - WF | 47 |
| Dog River - USA CHILI | 46 |
| KJKA - Gulf Shores | 45 |
| XGBZ - Gulf Breeze - WF | 45 |
| Fairhope - USA CHILI | 44 |
| Elberta - USA CHILI | 43 |
| KCEW - Crestview | 41 |
| KCQF - Fairhope | 41 |
| Atmore - USA CHILI | 41 |
| KPRN - Greenville | 39 |
| KGZH - Evergreen | 36 |
| MARINE SITES | |
| DPIA1 - Dauphin Island | 58 |
| XFPL - Pensacola Bay - WF | 56 |
| Buoy 42012 - 12S Orange Beach | 54 |
| XFWB - Ft Walton Beach - WF | 52 |
| XMLP - Perdido Bay - WF | 48 |
WF stands for a WeatherFlow site and USA CHILI refers to the University of South Alabama mesonet.
More information on WeatherFlow can be found on their webpage. More information on USA CHILI can be found on their webpage.
STORM SURGE & COASTAL FLOODING
Storm surge was greatest on the eastern side of Hurricane Nate due to its angle of approach and forward speed. High tide occurred around the same time as Hurricane Nate made landfall, which further amplified the inundation issues for our coastal counties (across Alabama and northwest Florida).
The highest values across our area were observed in Mobile County, AL where peak surge inundation was generally 4-6 feet based on official tide gauges. However, the storm surge survey team from our office visited the Bayou La Batre and Coden areas and indicated a peak surge of 6-8 feet along the immediate coastal areas (near Shell Belt Rd and Coden Belt Rd). The pictures below show the storm surge survey in the Bayou La Batre and Coden communities. Several houses in that area, as well as along the Dog River, experienced 2-3 feet of flooding inside structures due to surge. On the west end of Dauphin Island in southern Mobile County, 6 feet of sand was deposited along a 3 mile stretch of Bienville Blvd. There were approximately 25 houses that experienced surge flooding on the west end of Dauphin Island. Several more houses had minor damage from either the surge or wind. In downtown Mobile, both Water St and Cochrane Causeway (south of the Cochrane Bridge) were flooded at the peak of the event. Parts of the Dauphin Island Parkway were also closed due to storm surge during the event. The Bankhead Tunnel in downtown Mobile closed prior to Nate (7am on the 7th) due to storm surge predictions. The Port of Mobile was closed through mid-day on October 9th. Numerous piers were damaged or destroyed.


 Across Mobile Bay, 3-6 feet of storm surge inundation occurred across the coastal portion of Baldwin County, AL. The highest surge inundation occurred along the eastern shore of Mobile Bay and points further north into the Mobile River Delta. The Highway 90 Causeway over Mobile Bay was closed due to significant flooding. The image to the right is a view of the storm surge along the Causeway over Mobile Bay at daybreak on October 8th via the ALGOTraffic website and Alabama Department of Transportation. The surge in Baldwin County resulted in the damage of just under 200 piers, 62 of which sustained major damage and 2 of which were completely destroyed. 22 houses and 2 mobile homes had minor damage from either surge or strong wind gusts. Along the gulf side of Baldwin County, moderate to major beach erosion occurred in the Gulf Shores and Orange Beach areas.
Further east into Escambia County in the northwest Florida panhandle, official tide gauges indicated peak storm surge inundation of approximately 3 feet along the immediate coastal areas of the Pensacola Bay system. USGS data indicate peak storm surge inundation of 3-5 feet likely occurred at the immediate shore of the barrier islands. At Gulf Islands National Seashore, Fort Pickens Rd and a portion of Highway 399 between Navarre Beach and Pensacola Beach were significantly damaged and expected to be closed through at least early December 2017. Fort Pickens Rd had 3 feet of sand covering it with 4 feet of sand deposited on some of the parking lots. The Port of Pensacola was also closed during the hurricane.
 Peak storm surge inundation up to 3 feet occurred along the coastal portion of Escambia Bay and East Bay in Santa Rosa County, FL. A peak surge of 3-5 feet impacted areas along the immediate shore of Santa Rosa Island. Several piers were damaged in Santa Rosa County. USGS data from their rapid deployment gauge in Destin, FL (Okaloosa County) reported a peak surge of a little over 3 feet. A time series from the USGS rapid deployment gauge can be seen to the right.
Official NOAA/NOS/CO-OPS tide gauges were used to measure the maximum storm surge and storm tide across the area during Hurricane Nate. Time series plots from several of these NOAA/NOS/CO-OPS tide gauges across coastal Alabama and northwest Florida can be viewed below. One storm surge survey team used high water marks to measure the surge in the Bayou La Batre and Coden communities in southern Mobile County after Hurricane Nate.


The series of animated GIFs below show the National Geodetic Survey aerial imagery from Dauphin Island and Fort Morgan before and after Hurricane Nate. These animations show the extent of erosion across area beaches and barrier islands after Hurricane Nate.


Far West End of Dauphin Island West End of Dauphin Island (Public Beach Area)


Dauphin Island Dauphin Island
East End of Dauphin Island


Fort Morgan Fort Morgan

Fort Morgan
 Nate spawned at least four EF0 tornadoes across the area and numerous waterspouts. The EF0 tornadoes occurred in Butler, Baldwin, and Mobile Counties in Alabama and Wayne County in Mississippi.
The picture to the right show the damage from the brief EF0 tornado in Mobile County that occurred near our office in West Mobile. (Pictures taken by an off-duty NWS employee.) The tornado downed and twisted a large billboard on Airport Blvd and downed several large oak tree limbs. One building along Airport Blvd experienced damage to the facade, shingle damage, and broken windows. Windows were also blown out of vehicles at a car dealership, as well as window damage to the dealership building itself.
The EF0 tornado in Butler County, AL produced sporadic tree damage in the far northeastern portion of the county between County Road 75 and Highway 31. There was also minor roof and siding damage to a few homes in the area. The EF0 tornado in Baldwin County touched down in Waterfront Park in the Orange Beach area where it downed approximately 20 trees. The EF0 tornado southeast of Waynesboro in Wayne County, MS produced roof damage to three homes and uprooted several trees.
Thanks to our emergency management partners and the NWS Office in Birmingham, AL for helping us survey these tornadoes after Hurricane Nate.
POST TROPICAL CYCLONE REPORT...HURRICANE NATE...UPDATED
NATIONAL WEATHER SERVICE MOBILE AL
240 PM CDT TUE OCT 24 2017

NOTE: THE DATA SHOWN HERE ARE PRELIMINARY....AND SUBJECT TO UPDATES
AND CORRECTIONS AS APPROPRIATE.

THIS REPORT INCLUDES EVENTS OCCURRING WHEN WATCHES AND/OR WARNINGS
WERE IN EFFECT...OR WHEN SIGNIFICANT FLOODING ASSOCIATED WITH NATE
OR ITS REMNANTS WAS AFFECTING THE AREA.

COUNTIES INCLUDED...BALDWIN...BUTLER...CHOCTAW...CLARKE...CONECUH...
COVINGTON...CRENSHAW...ESCAMBIA AL...ESCAMBIA FL...GEORGE...
GREENE...MOBILE...MONROE...OKALOOSA...PERRY...SANTA ROSA...STONE...
WASHINGTON...WAYNE...WILCOX

OCT 20...UPDATED FOR...COUNTY IMPACTS AND ADDITIONAL WIND AND
TORNADO INFORMATION.


A. LOWEST SEA LEVEL PRESSURE/MAXIMUM SUSTAINED WINDS AND PEAK GUSTS
---------------------------------------------------------------------
METAR OBSERVATIONS...
NOTE: ANEMOMETER HEIGHT IS 10 METERS AND WIND AVERAGING IS 2 MINUTES
---------------------------------------------------------------------
LOCATION  ID    MIN    DATE/     MAX      DATE/     PEAK    DATE/
LAT  LON        PRES   TIME      SUST     TIME      GUST    TIME
DEG DECIMAL     (MB)   (UTC)     (KT)     (UTC)     (KT)    (UTC)
---------------------------------------------------------------------
KMOB-MOBILE REGIONAL
30.67 -88.24    996.0 08/0756   160/040  08/0711   140/057 08/0711

KBFM-MOBILE BROOKLEY
30.64 -88.07    998.0 08/0753   150/031  08/0611   190/047 08/0748

KPNS-PENSACOLA REGIONAL
30.47 -87.20   1001.5 08/0853   160/033  08/0605   160/046 08/0501

KDTS-DESTIN
30.40 -86.47   1003.7 08/0853   180/027  08/1031   190/050 08/1031

KCEW-CRESTVIEW
30.79 -86.52   1003.6 08/0753   200/022  08/1353   220/036 08/0727

KGZH-EVERGREEN
31.41 -87.04   1001.3 08/0753   190/023  08/1335   190/031 08/1153

KPRN-GREENVILLE
31.84 -86.61   1001.9 08/0856   110/024  08/0856   160/034 08/1112

KJKA-GULF SHORES
30.29 -87.67   1001.0 08/0815   140/024  08/0335   160/039 08/0455

KNPA-PENSACOLA NAS
30.36 -87.32   1001.6 08/0856   150/035  08/0422   140/046 08/0422

KCQF-FAIRHOPE
30.46 -87.88    999.9 08/0755   160/023  08/0615   150/036 08/0415

KHRT-HURLBURT FIELD
30.43 -86.69   1002.8 08/0940   160/034  08/0747   190/045 08/1201

KVPS-EGLIN AFB
30.48 -86.53   1003.9 08/0855   170/029  08/0955   170/042 08/0955

REMARKS:


NON-METAR OBSERVATIONS...
NOTE: ANEMOMETER HEIGHT IN METERS AND WIND AVERAGING PERIOD IN
MINUTES INDICATED UNDER MAXIMUM SUSTAINED WIND IF KNOWN
---------------------------------------------------------------------
LOCATION  ID    MIN    DATE/     MAX      DATE/     PEAK    DATE/
LAT  LON        PRES   TIME      SUST     TIME      GUST    TIME
DEG DECIMAL     (MB)   (UTC)     (KT)     (UTC)     (KT)    (UTC)
---------------------------------------------------------------------
XBUC-BUCCANEER YACHT CLUB (WEATHERFLOW)
30.58 -88.07    997.5 08/0742   150/038  08/0647   150/049 08/0657
                                 10/

XGLF-FOLEY (WEATHERFLOW)
30.36 -87.65                    160/025  08/0455   170/041 08/0500
                                 10/

XGLF-GULF BREEZE (WEATHERFLOW)
30.36 -87.16    999.8 08/0813   120/024  08/0418   120/039 08/0418
                                 15/

FAIRHOPE (USA CHILI)
30.54 -87.90                    175/033  08/0702   195/038 08/0804
                                 10/

DOG RIVER (USA CHILI)
30.56 -88.10                    999/034  08/0633   999/040 08/0748
                                 10/

LOXLEY (USA CHILI)
30.64 -87.70                    130/037  08/0616   115/044 08/0330
                                 10/

ATMORE (USA CHILI)
31.02 -87.40                    135/029  08/0703   150/036 08/0704
                                 10/

ELBERTA (USA CHILI)
30.41 -87.60                    125/028  08/0310   115/037 08/0305
                                 10/

REMARKS:


B. MARINE OBSERVATIONS...
NOTE: ANEMOMETER HEIGHT IN METERS AND WIND AVERAGING PERIOD IN
MINUTES INDICATED UNDER MAXIMUM SUSTAINED WIND IF KNOWN
---------------------------------------------------------------------
LOCATION  ID    MIN    DATE/     MAX      DATE/     PEAK    DATE/
LAT  LON        PRES   TIME      SUST     TIME      GUST    TIME
DEG DECIMAL     (MB)   (UTC)     (KT)     (UTC)     (KT)    (UTC)
---------------------------------------------------------------------
DPIA1-DAUPHIN ISLAND AL
30.25  -88.08   998.7 08/0600   140/037  08/0400   160/050 08/0526
                                   14/10

42012--12NM SOUTH ORANGE BEACH AL
30.06  -87.55  1000.7 08/0650   150/039  08/0421   160/047 08/0421
                                   05/01

MLBA1-MIDDLE BAY LIGHT
30.43  -88.01   999.7 08/0812   200/047  08/0826
                                   14/01

CRTA1-CEDAR POINT
30.30  -88.14   996.3 08/0617   160/044  08/0540
                                   12/01

KATA1-KATRINA CUT
30.25  -88.21   996.6 08/0520   180/047  08/0521


MHPA1-MEAHER PARK
30.67  -87.94   997.6 08/0715   180/040  08/0826


XMLP-PERDIDO BAY (WEATHERFLOW)
30.27  -87.56  1000.0 08/0752   140/030  08/0607   140/042 08/0612
                                   05/

XFPL-PENSACOLA BAY (WEATHERFLOW)
30.36  -87.21  1001.5 08/0807   070/035  08/0432   070/049 08/0432
                                   05/

XFWB-CHOCTAWHATCHEE BAY (WEATHERFLOW)
30.40  -86.56                   140/034  08/0728   160/045 08/0758
                                   07/

REMARKS:


C. STORM TOTAL RAINFALL FROM 1200 UTC OCT 07 UNTIL 1200 UTC OCT 08
---------------------------------------------------------------------
CITY/TOWN                    COUNTY               ID         RAINFALL
LAT LON                                                       (IN)
DEG DECIMAL
---------------------------------------------------------------------
7.2 ENE GULF BREEZE          SANTA ROSA          FL-SR-19      9.93
30.39  -87.08

1.9 SE CRESTVIEW             OKALOOSA            FL-OK-23      8.15
30.74  -86.55

4.5 SE FOLEY                 BALDWIN             AL-BW-74      7.71
30.35  -87.63

4.3 WNW TILLMANS CORNER      BALDWIN             AL-MB-1       7.37
30.61  -88.24

10.2 WSW MOBILE              MOBILE              AL-MB-60      7.20
30.44  -88.71

2.1 NE ORANGE BEACH          BALDWIN             AL-BW-27      7.06
30.32  -87.55

3.1 SSW ELBERTA              BALDWIN             AL-BW-53      6.96
30.37  -87.61

2.3 NE PENSACOLA             ESCAMBIA            FL-ES-37      6.80
30.44  -87.17

6.2 E NAVARRE                SANTA ROSA          FL-SR-21      6.75
30.40  -86.76

7.4 W MOBILE                 MOBILE              AL-MB-35      6.63
30.65  -89.07

SILVERHILL                   BALDWIN             AL-BW-65      6.52
30.54  -87.75

FAIRHOPE                     BALDWIN             AL-BW-82      6.32
30.52  -87.90

2.6 WNW MOBILE               MOBILE              AL-MB-4       6.30
30.72  -88.23

MARY ESTHER                  OKALOOSA            FL-OK-29      6.17
30.42  -86.64

3.8 ENE PENSACOLA BEACH      ESCAMBIA            FL-ES-49      5.94
30.35  -87.08

4.2 NE DAPHNE                BALDWIN             AL-BW-36      5.81
30.64  -87.85

GASQUE                       BALDWIN             BONA1         5.70
30.25  -87.81

LOXLEY                       BALDWIN             AL-BW-26      5.34
30.61  -87.75

DOWNTOWN MOBILE AIRPORT      MOBILE              KBFM          4.91
30.69  -88.04

5.6 NE EGLIN AFB             OKALOOSA            FL-OK-2       4.89
30.51  -86.48

1.2 NE SPANISH FORT          BALDWIN             AL-BW-58      4.73
30.68  -87.86

6.8 NNW SARALAND             MOBILE              AL-MB-14      4.72
30.91  -88.12

4.3 WSW JACKSON              WASHINGTON          AL-WS-1       4.70
31.48  -87.96

2.4 N PACE                   SANTA ROSA          FL-SR-4       4.64
30.63  -87.16

2.1 SE NICEVILLE             OKALOOSA            FL-OK-37      4.53
30.47  -86.44

13 SE LUCEDALE               GEORGE              MS-GG-2       4.50
30.79  -88.44

MOBILE AIRPORT               MOBILE              KMOB          4.36
30.68  -88.24

5.40 WNW WAYNESBORO          WAYNE               MS-WY-2       4.19
31.70  -88.73

5.6 NW MILTON                SANTA ROSA          FL-SR-18      4.05
30.67  -87.09

3.6 WSW PINE HILL            WILCOX              AL-WX-1       4.02
31.96  -87.64

8 W URIAH                    MONROE              AL-MN-3       3.84
31.30  -87.64

10.9 N BAY MINETTE           BALDWIN             AL-BW-59      3.83
31.03  -87.77

6 SW GROVE HILL              CLARKE              AL-CK-3       3.72
31.64  -87.85

2.5 NNW GONZALEZ             ESCAMBIA            FL-ES-4       3.40
30.60  -87.31

PENSACOLA AIRPORT            ESCAMBIA            KPNS          3.28
30.42  -87.19

12.1 W CENTURY               ESCAMBIA            FL-ES-39      3.04
30.97  -87.47

DESTIN                       OKALOOSA            KDTS          2.90
30.40  -86.50

2.5 ESE EXCEL                MONROE              AL-MN-4       2.60
31.41  -87.31

ANDALUSIA                    COVINGTON           K79J          2.56
31.30  -86.48

1 NNE CAMDEN                 WILCOX              AL-WX-2       2.56
32.00  -87.28

5.7 S REPTON                 CONECUH             AL-CC-2       2.30
31.32  -87.24

2.40 N POLLARD               ESCAMBIA            AL-ES-1       2.27
31.05  -87.17

EVERGREEN                    CONECUH             KGZH          2.14
31.43  -86.96

60 N TOXEY                   CHOCTAW             AL-CW-1       2.03
32.78  -88.31

1.7 NE PERKINSTON            STONE               MS-ST-4       1.92
30.79  -89.12

REMARKS:


D. INLAND FLOODING...
---------------------------------------------------------------------
---------------------------------------------------------------------

E. MAXIMUM STORM SURGE AND STORM TIDE...
OFFICIAL TIDE GAUGES NOTED WITH LEADING G
---------------------------------------------------------------------

COUNTY           CITY/TOWN        SURGE   TIDE   DATE/   BEACH
                 OR LOCATION      (FT)    (FT)   TIME    EROSION
---------------------------------------------------------------------
MOBILE         G BAYOU LA BATRE    4.61   5.85  08/0742

MOBILE         G W FOWL RIVER BR   4.12   5.56  08/0806

MOBILE         G CHICKASAW CREEK   4.62   4.91  08/0954

MOBILE         G MOBILE ST DOCKS   5.14   5.12  08/0848

MOBILE         G USCG SECTOR MOB   5.36   5.73  08/0842

MOBILE         G E FOWL RIVER BR   3.74   3.91  08/0624

MOBILE         G DOG RIVER BRIDG   4.04   4.59  08/0754

MOBILE         G DAUPHIN ISLAND    3.09   3.26  08/0442    MAJOR

BALDWIN        G WEEKS BAY         4.61   4.44  08/0842

ESCAMBIA       G PENSACOLA BAY     3.22   3.07  08/0736


REMARKS: STORM TIDE READINGS ARE IN REFERENCE TO MEAN HIGHER HIGH
WATER (MHHW) WHICH IS USED AS AN APPROXIMATION FOR INUNDATION ABOVE
NORMALLY DRY GROUND..


F. TORNADOES...
---------------------------------------------------------------------
(DIST)CITY/TOWN              COUNTY           DATE/         EF SCALE
LAT LON (DEG DECIMAL                          TIME(UTC)    (IF KNOWN)
DESCRIPTION
---------------------------------------------------------------------
2 SE WAYNESBORO              WAYNE            08/0228          0
31.65  -88.62

A BRIEF EF-0 TORNADO INITIALLY TOUCHED DOWN ON JO LAND DRIVE, MOVED
WEST NORTHWEST, AND LIFTED JUST NORTH OF COUNTY FARM ROAD AND OLD
HIGHWAY 145. THREE HOMES EXPERIENCED ROOF DAMAGE. SOME TREES WERE
ALSO UPROOTED.

11 NE GREENVILLE             BUTLER           07/2326          0
31.94  -86.48

A BRIEF EF-0 TORNADO TOUCHED DOWN IN FAR NORTHEAST BUTLER COUNTY ON
COUNTY ROAD 75. THE TORNADO MOVED NORTHWEST AND LIFTED JUST EAST OF
HIGHWAY 31. THE TORNADO PRODUCED SPORADIC TREE DAMAGE ALONG ITS
PATH ALONG WITH MINOR ROOF DAMAGE TO ONE HOME AND MINOR SIDING DAMAGE
TO ANOTHER HOME.

2 ENE MOBILE AIRPORT         MOBILE           07/2147          0
30.68  -88.21

A BRIEF EF-0 TORNADO TOUCHED DOWN ON PORTSIDE COURT AND TRAVELED
NORTHWEST, LIFTING NEAR THE INTERSECTION OF AIRPORT BLVD AND BORDER
CIRCLE WEST. THE TORNADO DOWNED SEVERAL LARGE OAK TREE LIMBS. A
LARGE BILLBOARD WAS DOWNED AND TWISTED NEAR AIRPORT BLVD. A SMALL
PROFESSIONAL BUILDING EXPERIENCED SHINGLE DAMAGE, DAMAGE TO THE
FACADE, AND BROKEN WINDOWS. JUST NORTH OF AIRPORT BLVD, WINDOWS WERE
BLOWN OUT OF VEHICLES AT A CAR DEALERSHIP. THE DEALERSHIP ALSO
SUFFERED SOME WINDOW DAMAGE.

1 W ORANGE BEACH             BALDWIN          07/2334          0
30.30  -87.60

BRIEF EF-0 TORNADO TOUCHED DOWN IN WATERFRONT PARK. APPROXIMATELY 20
TREES WERE DOWNED ACROSS A 200 YARD WIDE PATH IN THE PARK.


G. STORM IMPACTS BY COUNTY...
---------------------------------------------------------------------

COUNTY            DEATHS           INJURIES             EVACUATIONS
DESCRIPTION
---------------------------------------------------------------------
MOBILE 0 0 PEAK SURGE INUNDATION WAS GENERALLY 4 TO 6 FEET ACROSS MOBILE COUNTY. HOWEVER, SURVEYS OF THE BAYOU LA BATRE AND CODEN AREAS INDICATE PEAK SURGE OF 6 TO 8 FEET ALONG THE IMMEDIATE COASTAL AREAS OF SHELL BELT ROAD AND CODEN BELT ROAD. SEVERAL HOMES IN THIS AREA AND A FEW IN THE DOG RIVER AREA EXPERIENCED 2 TO 3 FEET OF FLOODING INSIDE THE STRUCTURES. THE WEST END OF DAUPHIN ISLAND WAS PARTICULARLY HARD HIT WITH 6 FEET OF SAND DEPOSITED ON A 3 MILE STRETCH OF BIENVILLE BLVD. APPROXIMATELY 25 HOMES EXPERIENCED SURGE FLOODING ON THE WEST END OF DAUPHIN ISLAND WITH SEVERAL OTHER HOMES EXPERIENCING MINOR DAMAGE FROM WIND OR THE SURGE. NUMEROUS PIERS WERE DAMAGED OR DESTROYED. WATER STREET IN DOWNTOWN MOBILE WAS FLOODED AT THE PEAK OF THE EVENT. SCATTERED POWER OUTAGES AND DOWNED TREES WERE REPORTED THROUGHOUT THE COUNTY WITH A GREATER COVERAGE OCCURRING ON DAUPHIN ISLAND. WIND DAMAGE OCCURRED AT A FACTORY IN CALVERT. A BRIEF EF-0 TORNADO TOUCHED DOWN IN WEST MOBILE. BALDWIN 2 0 3 TO 6 FEET OF STORM SURGE INUNDATION OCCURRED ACROSS COASTAL AREAS OF BALDWIN COUNTY, WITH THE HIGHEST VALUES ALONG THE IMMEDIATE EASTERN SHORE OF MOBILE BAY AND NORTH INTO THE MOBILE RIVER DELTA. THE US HIGHWAY 90 CAUSEWAY WAS CLOSED DUE TO SIGNIFICANT FLOODING. THE SURGE MOSTLY RESULTED IN THE DAMAGE OF JUST UNDER 200 PIERS, 62 OF WHICH WERE MAJORLY DAMAGED AND 2 THAT WERE COMPLETELY DESTROYED. 22 HOMES AND 2 MOBILE HOMES EXPERIENCED MINOR DAMAGE FROM EITHER STRONG WIND GUSTS OR SURGE. MODERATE TO MAJOR BEACH EROSION OCCURRED IN GULF SHORES AND ORANGE BEACH. SCATTERED DOWNED TREES AND POWER OUTAGES WERE REPORTED. A BRIEF EF-0 TORNADO IN FAR ORANGE BEACH PRODUCED MINOR TREE DAMAGE AT WATERFRONT PARK. ESCAMBIA FL 0 0 TIDE GAUGE INFORMATION FROM PENSACOLA BAY INDICATE PEAK INUNDATION OF AROUND 3 FEET OCCURRED ALONG IMMEDIATE COASTAL AREAS OF THE PENSACOLA BAY SYSTEM. DATA FROM USGS INDICATES THAT A PEAK OF 3 TO 5 FEET INUNDATION LIKELY OCCURRED AT THE IMMEDIATE SHORE OF THE BARRIER ISLANDS. THE GREATEST IMPACT WAS TO THE FORT PICKENS AREA WHERE PART OF THE FORT PICKENS ROADWAY WAS DAMAGED. THE ROAD HAD 3 FEET OF SAND COVERING IT WITH 4 FEET OF SAND DEPOSITED ON SOME OF THE PARKING LOTS. IN ADDITION, A PORTION OF HIGHWAY 399 BETWEEN NAVARRE BEACH AND PENSACOLA BEACH WAS DAMAGED AND WILL LIKELY BE CLOSED THROUGH EARLY DECEMBER. SANTA ROSA 0 0 PEAK SURGE INUNDATION OF UP TO 3 FEET LIKELY IMPACTED AREAS ALONG THE COAST OF ESCAMBIA AND EAST BAYS. PEAK SURGE OF 3 TO 5 FEET IMPACTED AREAS ALONG THE IMMEDIATE SHORE OF SANTA ROSA ISLAND AS WELL AS ALONG THE SHORELINE OF SANTA ROSA SOUND. NUMEROUS PIERS WERE DAMAGED. OKALOOSA 0 0 PEAK SURGE OF AROUND 3 FEET WAS REPORTED BASED OFF OF USGS DATA. NO SIGNIFICANT DAMAGE WAS REPORTED. A FEW ROADS WERE IMPASSABLE DUE TO FLASH FLOODING. GEORGE 0 0 NUMEROUS TREES WERE DOWNED THROUGHOUT THE COUNTY. SEVERAL HOMES REPORTED MINOR ROOF AND SHINGLE DAMAGE. ONE MOBILE HOME WAS DESTROYED DUE A TREE FALLING ON IT. A TOTAL OF 7,000 POWER OUTAGES WERE REPORTED. GREENE 0 0 SCATTERED DOWNED TREES AND POWER OUTAGES REPORTED ACROSS THE COUNTY. WAYNE 0 0 SCATTERED DOWNED TREES AND POWER OUTAGES REPORTED. AN EF-0 TORNADO PRODUCED ROOF DAMAGE TO A FEW BUILDINGS SOUTHEAST OF WAYNESBORO. WASHINGTON 0 0 NUMEROUS DOWNED TREES AND POWER LINES REPORTED ACROSS THE COUNTY. THREE HOMES WERE DAMAGED BY TREES. ESTIMATED 4500 HOMES WERE WITHOUT POWER. CHOCTAW 0 0 SCATTERED DOWN TREES AND POWER OUTAGES REPORTED ACROSS THE COUNTY. CLARKE 0 0 NUMEROUS DOWNED TREES AND POWER LINES REPORTED ACROSS THE COUNTY. DOWNED TREES DAMAGED ONE HOME AND TWO VEHICLES. ESTIMATED 4200 HOMES WERE WITHOUT POWER. BUTLER 0 0 ONE TREE FELL ONTO A MOBILE HOME IN GREENVILLE CAUSING MAJOR DAMAGE. A BRIEF EF-0 TORNADO IN FAR NORTHEAST BUTLER COUNTY PRODUCED MINOR DAMAGE. $$ Legend: I-Incomplete Data E-Estimated JASON BEAMAN
Link to the PSH product online
NHC Advisory Archive
WPC Archive
NHC Tropical Cyclone Report - Hurricane Nate
NOAA Tides & Currents - Highest Storm Water Levels
NOAA Tides & Currents - Archived Storm QuickLooks
USGS Hurricane Nate Data
National Geodetic Survey Emergency Response Imagery
NASA GOES East & West Satellite Imagery Loop
NWS Local Write-Ups and Webpages:
NWS New Orleans
NWS Tallahassee
NWS Birmingham
NWS Lake Charles
NWS Jackson, MS
NWS Columbia, SC
NWS Blacksburg, VA
Acknowledgements: Page created by Morgan Barry (forecaster) & Ryan Rogers (forecaster).
LAST UPDATED: September 2018


 Follow us on YouTube