OVERVIEW OF THE CENTRAL ALABAMA 28 NOVEMBER 2005 MINI-TORNADO OUTBREAK
Michael Scotten * and Kristin Scotten
National Weather Service, Birmingham Alabama
1. INTRODUCTION
On 28 November 2005, six tornadoes occurred across Central Alabama. Five of the six tornadoes were F0 on the Fujita Scale, while one of the tornadoes was a F1. The tornadoes caused only minor damage to a few structures and knocked down several trees. No injuries or deaths were reported with the tornadoes.
This “mini” tornado outbreak across Central Alabama was anticipated days in advance by model forecasts and the National Weather Service (NWS). In fact, over a dozen tornadoes occurred across Kansas, Missouri, and Arkansas on 27 November 2005. However, the tornadoes that occurred across Central Alabama on 28 November 2005 were weaker and lower in number than forecast.
Many synoptic and mesoscale features supported the formation of tornadoes across Central Alabama on 28 November 2005. On the other hand, some features prevented a large outbreak of strong tornadoes from occurring.
2. SYNOPTIC OVERVIEW
The placement and movement of large scale synoptic features played a critical role for supporting the formation of tornadoes across Central Alabama on 28 November 2005. A large stacked upper low was located near Kansas City, Missouri at 1200 UTC 28 November 2005, and a cold front stretched south from a surface low in western Iowa. This front extended roughly along the Mississippi River at this time and slowly moved east during the day. By 0000 UTC 29 November 2005, the cold front extended from Lake Michigan to East Tennessee, then south across Alabama. At this time, the upper low had slowly shifted northeast into Iowa.
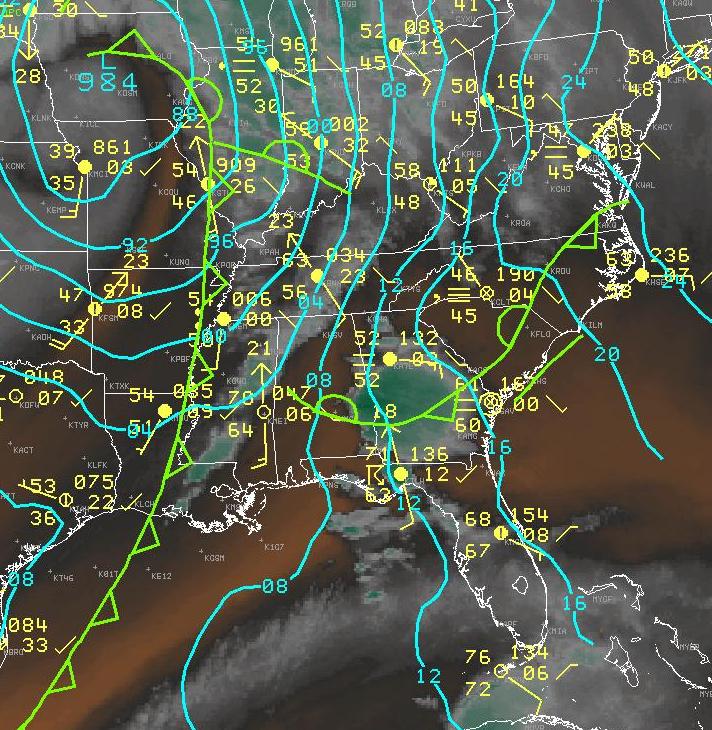
Figure 1:
1200 UTC 28 November 2005
Water Vapor Satellite Image
Symoptic Features and Surface Observations
A warm moist airmass was ahead of the cold front while cooler and drier air was behind the front. Surface temperatures ahead of the front generally ranged between 13°C and 23°C (55°F - 74°F), even as far north as Michigan, while surface temperatures behind the front were mainly between 0°C and 10°C (32°F - 50°F). Surface dewpoints ahead of the front generally ranged from 10°C to 20°C (50°F - 68°F), while they were mainly between -2°C and 8°C (28°F - 47°F) behind the front.
Strong winds at all levels of the atmosphere were occurring within 1500 km (900 mi) of the upper low on 28 November 2005, particularly near the cold front. At 1200 UTC, upper air plots and the NWSs RUC (Rapid Update Cycle) model indicated a 250 hPa (mb) jet maximum of 70 m s-1 (140 kts) stretching from Wisconsin to East Texas, just west of the cold front. At that time, a mid level jet maximum of 50 m s-1 (100 kts) at 500 hPa (mb) existed in nearly the same location as the 250 hPa (mb) jet maximum. Strong low level winds of 30 m s-1 (60 kts) at 850 hPa (mb) were occurring from Lake Michigan to Mississippi at 1200 UTC as well.
By 0000 UTC 29 November 2005, the 250 hPa (mb) jet had weakened to 60 ms-1 (120 kts) and moved east, extending from Lake Michigan to South Texas according to the RUC model and upper air plots. However, the 500 hPa (mb) jet increased to 55 m s-1 (110 kts) and was located in nearly the same location as the upper level jet. The 850 hPa (mb) jet maxima had shifted north and east into Ohio where winds 30 m s-1 to 35 m s-1 (60 kts - 70 kts) were observed.
With the combination of warm unstable air, strong atmospheric winds, and a cold front moving through, severe weather was forecast from Southern Michigan to the North Central Gulf Coast. Most of this area was placed under a slight risk for severe thunderstorms on the 0600 UTC Day 1 NWS Storm Prediction Center's (SPC) Convective Outlook on 28 November 2005. A small moderate risk area and Public Severe Weather Outlook was issued for roughly the northern two thirds of Alabama where an enhanced tornado threat was expected. The subsequent Day 1 SPC Convective Outlooks on 28 November 2005 were not altered significantly.
Figure 2:
1300 UTC 28 November 2005 Day 1
SPC Convective Outlook
3. MESOSCALE OVERVIEW
3.1 Round One – Morning
Ahead of the approaching cold front, an area of showers and thunderstorms developed and moved across Southeast Alabama, Florida Panhandle, and Southwest Georgia between 0600 and 1400 UTC on 28 November. These showers and thunderstorms developed in a plume of low and mid level moisture that streamed north ahead of a weak vorticity maximum.
Moderate to strong atmospheric winds with 250 hPa (mb) winds around 30 ms -1 (60 kts) and 500 hPa (mb) and 850 hPa (mb) winds around 20 m s -1 (40 kts) according to RUC model analyses supported the formation of multicells and supercells with storm rotation. High 0-3 km storm relative helicity (SRH) values of 300 m 2 s -2 to 450 m 2 s -2 were observed from the NWS’s Local Analysis and Prediction System ( LAPS) model. The high SRH values and southeast surface winds around 5 m s -1 (10 kts) indicated there was a threat for tornadoes with this area of showers and thunderstorms.
Conversely, the lack of instability with no surface based Convective Available Potential Energy (CAPE) and lifted indices (LIs) above zero, prevented severe thunderstorms from occurring. Surface temperatures were mainly between 15°C and 20°C (59°F - 68°F) between 0600 and 1400 UTC on 28 November with the coldest temperatures and most stable air located north of Alexander City, Alabama to Macon, Georgia line associated with a wedge of cool air in place on the east side of the Appalachians.
Between 1200 and 1500 UTC on 28 November, the showers and thunderstorms weakened as they moved east into Central Georgia. The weak vorticity maxima moved east as well, and sea level surface pressure rises were observed.
3.2 Round Two – Early Afternoon
Additional scattered showers and thunderstorms formed between 1200 and 1500 UTC on 28 November 2005 across West and Southwest Alabama along an old outflow boundary. The outflow boundary developed from convection that occurred across Arkansas and East Texas about 12 hours earlier and had moved east. By 1430 UTC, this boundary and subsequent showers and thunderstorms stretched from Birmingham, Alabama to Mobile, Alabama.
No severe thunderstorms were observed with this boundary. Although 0-3 km SRH values between 300 m 2 s -2 and 400 m 2 s -2 were observed by LAPS model analyses along and ahead of this boundary, abundant cloud cover and weak subsidence did not allow for daytime heating and destabilization. LIs zero to +3 and no surface based CAPE were observed by the LAPS model. These showers and thunderstorms weakened after 1900 UTC on 28 November 2005 as the low level outflow boundary weakened when it moved into cooler, more stable air across East Alabama.
3.3 Round Three – Late Afternoon and Evening
All of the tornadoes that occurred across Central Alabama on 28 November 2005 formed during the afternoon and evening hours along a cold front. Convergence and lift in an unstable airmass was maximized along this front.
Destabilization occurred during the afternoon hours (1800 UTC through 2100 UTC on 28 November) across much of Central Alabama ahead of the cold front. Good subsidence and clearing allowed temperatures to warm up to between 20°C and 27°C (68°F - 80°F) along a Huntsville, Alabama to Mobile, Alabama line by 1900 UTC. This daytime heating and approaching cold front supported surface pressure falls on the order of 1 hPa (mb) per hour. LIs fell to the -1 to -3 range by 2000 UTC according to LAPS model analyses along the line mentioned above where clearing allowed temperatures to warm up. A maximum of CAPE values ranging between 600 J kg -1 near Huntsville, Alabama to 2000 J kg -1 near Pensacola, Florida existed at 1900 UTC. The RUC model showed positive vorticity advection across much of Central Alabama indicating weak lift ahead of the front. Thick low cloud cover under wedge of cool air kept the air stable across East Alabama.
Southeast winds were observed generally ahead of the front except for locations west of Selma, Alabama to Greenville, Alabama line where surface winds had veered around to the southwest by late afternoon (2200 UTC). Where the winds had switched to the southwest, lower 0-3 SRH values and convergence along the cold front was observed. The wedge cooled air in East Alabama with southeast surface winds yielded the highest 0-3 km SRH values of 200 m 2 s -2 to 350 m 2 s -2 though instability was considerably lower as surface temperatures ranged between 15°C and 20°C (59°F - 68°F).
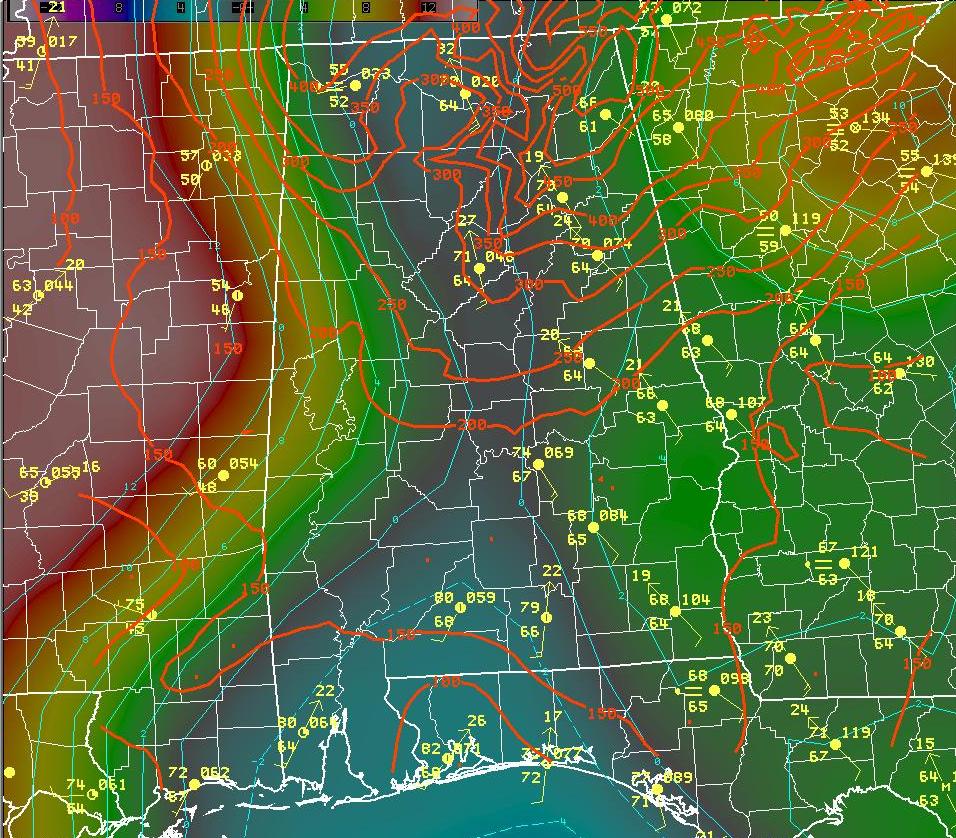
Figure 3:
Image showing surface observations
and LAPS LIs at 1900 UTC 28 November 2005
Showers and thunderstorms organized along the cold front across West Alabama between 1700 and 2000 UTC as the front moved into a destabilizing airmass. Strong atmospheric winds produced abundant shear to allow supercells to develop along the line. By 2100 UTC, a slow moving squall line had developed along the cold front and extended roughly along a Huntsville, Alabama to Chatom, Alabama line. This line of showers and thunderstorms continued to slowly move east. By 0000 UTC, the line had reached a Gadsden, Alabama to Selma, Alabama line, and the northern extent of the line was moving into cooler, more stable air. The southern extent of the line, south of an Alexander City, Alabama to Auburn, Alabama line contained the strongest storms at 0000 UTC where the atmosphere remained unstable with LAPS model analyses depicting LIs -1 to -2 and surface based CAPE up to 1000 J kg -1.
The entire line of showers and thunderstorms along the cold front weakened significantly after 0300 UTC as the atmosphere ahead of the front cooled and became more stable. Also, the line moved into a less sheared environment with weakening atmospheric winds as the upper low pulled the strongest winds farther north.
4. TORNADOES
4.1 Jefferson County Tornadoes
The first two tornadoes across Central Alabama on 28 November 2005 occurred in Jefferson County near the Bagley/Corner and Concord communities. The Bagley/Corner tornado occurred at 2010 UTC (210 PM CST), and the Concord tornado occurred at 2040 UTC (240 PM CST). These were weak F0 tornadoes, and both occurred on the cold front.
The Bagley/Corner F0 tornado occurred from a supercell thunderstorm along the cold front. The storm first developed in Tuscaloosa County about 110 km (65 mi) southwest of where this tornado touched down. Shortly after the storm developed, it exhibited weak low level rotation according to the BMX ( Birmingham) Weather Surveillance Radar-1988 Doppler (WSR-88D). By 1922 UTC, the storm exhibited mid level rotation, a bounded weak echo region (BWER) at 2.4° and 3.1°, and an inflow notch at 1.3° off the BMX WSR-88D. At 1930 UTC, the storm triggered a tornado vortex signature (TVS) off the BMX WSR-88D as it rapidly moved northeast at 20 m s -1 (40 kts) into Walker County. At this time, a marked increase in lightning and reflectivity suggested the storm was strengthening. Additional TVSs were indicated by the BMX WSR-88D between 1944 and 2015 UTC. A peak low-level delta velocity (LLDV) value of 55 m s -1 (110 kts) with the supercell was observed by the BMX WSR-88D at 1957 UTC, 13 minutes before the Bagley/Corner F0 tornado occurred, indicating strong cyclonic rotation was evident in the supercell.
At 2010 UTC, the Bagley/Corner F0 tornado touched down briefly and had a path length of about 0.16 km (0.1 mi). The storm appeared to be a right mover compared to the mean mid level flow, which likely led to its demise as it moved off the cold front, the boundary that allowed for maximized convergence and lift. After the tornado occurred, the lightning and reflectivity core of this storm decreased dramatically.
The Concord F0 tornado formed after the Bagley/Corner F0 tornado from a completely different supercell along the cold front. Like the first tornadic storm, this supercell developed southwest in Tuscaloosa County. This storm then moved northeast along the cold front. This supercell was characterized by a rear inflow notch that was detected by the BMX WSR-88D at the lowest four elevation scans, beginning at 2019 UTC, 21 minutes before tornado touchdown, then continuing several scans after the tornado occurred. The inflow notch was most noticeable by the BMX WSR-88D at 2030 UTC, 10 minutes before the tornado touched down. This supercell triggered three TVSs from the BMX WSR-88D, all within 10 minutes of tornado touchdown. At 2037 UTC, three minutes prior to touchdown, the 0.5° Storm Relative Motion (SRM) image off of the BMX WSR-88D indicated a gate-to-gate cyclonic rotation with 17 m s -1 (35 kts) inbound towards the radar and 11 m s -1 (23 kts) outbound away from the radar about 500 m (1700 ft) above ground level.
The Concord F0 tornado touched down at 2040 UTC and had a path length of 0.65 km (0.4 mi). The supercell that produced this tornado slowly weakened after the tornado occurred.
The near storm environment for both of these tornadoes was conducive for tornado development. At 2000 UTC, the Automated Surface Observing System (ASOS) at the Birmingham, Alabama Airport (KBHM), located within 35 km (21 mi) of both storms, reported a surface temperature of 23°C (74°F) and surface dewpoint of 18°C (64°F) with southeast winds gusting up to 11 m s -1 (22 kts). Using this observation and LAPS data to produce a model sounding, the nearby environment for these two tornadoes consisted of a LI of -1.9, surface based CAPE of 1086 J kg -1 , and 0-3 km SRH of 324 m 2 s -2.
4.2 Dallas County Tornado
The supercell thunderstorm that produced the Summerfield/ Paul M. Grist State Park F0 tornado in Dallas County formed farther south and later in the afternoon than the Jefferson County tornadoes. The storm developed into a large, tall supercell along the cold front about an hour before it produced the F0 tornado. This storm had higher reflectivities and more lightning than either of the Jefferson County storms. From the MXX (Maxwell) WSR-88D, echo tops of the supercell generally were around 16 km (between 49 kft and 53 kft) before the tornado occurred. The supercell continuously had a 65 dBz reflectivity core or higher. A vertically integrated liquid (VIL) value of 74 kg m -2 was detected by the MXX WSR-88D at 2240 UTC, 13 minutes before the tornado first touchdown.
Mesocylones with a low and mid level circulation was detected by the MXX WSR-88D as early as 2232 UTC, 21 minutes before the tornado first touchdown. The mesocyclones continued even after tornado occurred. A rear inflow notch was detected by the MXX WSR-88D before the tornado occurred, indicating strong winds coming in behind the storm. At 2249 UTC, one minute before the tornado first touchdown, MXX WSR-88D showed a gate-to-gate cyclonic signature at the lowest elevation scan with 17 m s-1 (34 kts) inbound toward the radar and 22 m s-1 (45 kts) outbound away from the radar about 2000 m above ground level (6413 ft).
This tornado first touchdown at 2253 UTC (453 PM CST), 1.9 km (1.2 mi) northwest of Summerfield in Dallas County, then continued on the ground for nine minutes before lifting near Paul M. Grist State Park at 2302 UTC (502 PM CST). The path length of this tornado was 9.3 km (5.8 mi) long.
The near storm environment for this tornado was very similar to the Jefferson County tornadoes except that 0-3 km SRH was likely lower, somewhere between 200 and 250 m2 s-2. The supercell that produced this tornado may have interacted with some type of low level boundary that may have extended southeast from this supercell in Dallas County to Panama City, Florida. Once this storm moved off this boundary, the storm weakened significantly.
4.3 Autauga County Tornado
The supercell that produced the Autaugaville F0 tornado developed after the Dallas County supercell and farther south on the squall line. Again, this supercell formed on the cold front.
Lightning and reflectivity from this supercell increased significantly 30 minutes prior to tornado occurrence. Beginning at 0028 UTC, a three body scatter spike from this supercell was indicated by MXX WSR-88D at 3.1°. This indicated large hail aloft. Interestingly, no hail was reported, but the storm moved over rural locations. Composite reflectivity off the MXX WSR-88D reached a peak of 74 dBZ while the tornado was on the ground at 0045 UTC. A good cyclonic gate-to-gate signature was noted at 0045Z with 51 ms-1 (103 kts) inbound towards the MXX WSR-88D shown on the 0.5° velocity image. A VIL of 69 kg m-2 was indicated 10 minutes prior tornado touchdown. The supercell had the highest reflectivity core just north of a low level inflow notch. A small bow occurred just south of the reflectivity core.
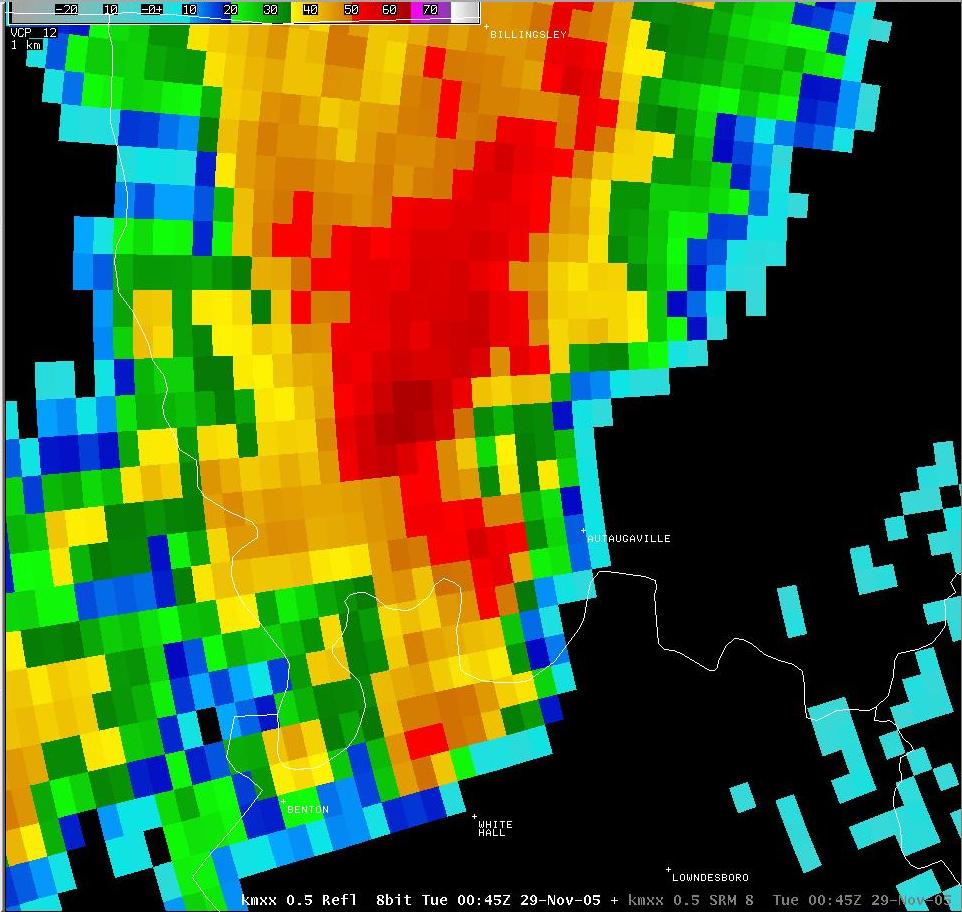
Figure 4:
0.5� Reflectivity Image from MXX WSR-88D
of the Autauga County Tornadic Supercell
at 0045 UTC 29 November 2005
This tornado first touched down at 0041 UTC on 29 November 2005 (641 PM CST on 28 November 2005) near Autaugaville in Autauga County Alabama. The tornado then continued on the ground for ten minutes before lifting.
The near storm environment for this tornado was a bit less favorable for tornado development. The Montgomery Airport ASOS (KMGM) observation at 0100 UTC indicated south southeast winds around 5 m s-1 (10 kts), surface temperature of 22°C (71°F) and a surface dewpoint of 19°C (67°F). Based on this observation and a derived LAPS sounding at this time, the near storm environment consisted of a lifted index of -0.6, surface based CAPE of 774 J kg-1, and 0-3 km SRH of 223 m2 s-2 .
4.4 Elmore and Coosa County Tornadoes
The Weoka F0 tornado in Elmore County and Coosa County F1 tornado formed from the same supercell that produced the Autauga County tornado. After the supercell produced the Autaugaville F0 tornado, it continued to move northeast along the slow moving cold front. At 0130 UTC on 29 November 2005 (730 PM CST), the supercell produced the Weoka F0 tornado in northern Elmore County. Fourteen minutes later at 0144 UTC (744 PM CST), the supercell produced a F1 tornado in rural southeast Coosa County. The path length of the Weoka F0 tornado was 0.16 km (0.1 mi), and the path length of the southeast Coosa County F1 tornado was 0.64 km (0.4 mi).
Just before the supercell produced the Weoka F0 tornado in Elmore County, it had a good inflow notch on the forward flank of the storm and rear inflow notch behind it. Lightning noticeably increased just before the tornado touchdown, then decreased when the tornado occurred. Also, the VIL from the MXX WSR-88D increased as it reached 50 kg m -2 at 0115 UTC, and then it slowly decreased afterwards. Beginning at 0124Z, a low level cyclonic circulation off the MXX WSR-88D triggered a TVS, which then continued for eight consecutive volume scans with the last at 0154 UTC. The strongest rotation was observed with the first TVS at 0124 UTC, six minutes before the Weoka F0 tornado occurred, with a LLDV of 49 m s -1 ( 99 kts).
After the Weoka F0 tornado occurred, the storm intensified again, and the VIL off the MXX WSR-88D increased to 48 kg m -2 by 0146 UTC, near the time when the F1 tornado occurred in rural southeast Coosa County. However, the reflectivity and velocity signatures with this tornado off the MXX WSR-88D were weak compared to the previous tornadoes.
The near storm environment with these two tornadoes was very similar to the Autauga County tornado, though weaker instability and lower CAPE likely occurred from the loss of daytime heating.
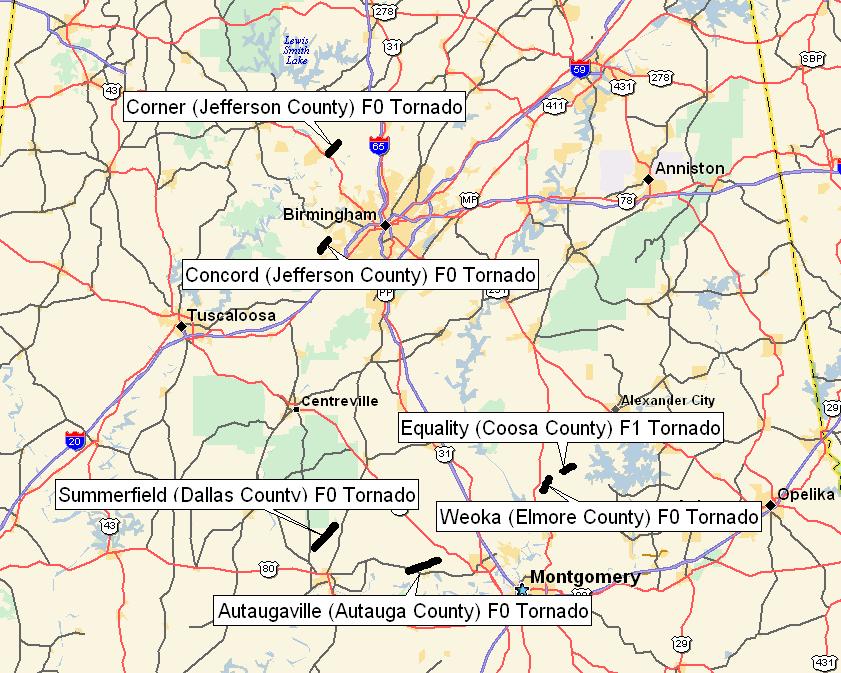
Figure 5:
Map depicting the location of each of the
six tornadoes that occurred across
Central Alabama on 28 November 2005
5. CONCLUSION
Although six tornadoes and a “mini” tornado outbreak occurred on 28 November 2005 in Central Alabama, the tornadoes were fewer and weaker than anticipated. The clash between warm moist air and cooler air along a cold front produced a line of strong to severe thunderstorms. Strong winds aloft and near the surface allowed for the formation of rotating supercells, which a few produced tornadoes.
Nonetheless, the lack of deep lift with no significant short wave or vorticity maxima nearby to break a weak mid level capping inversion and weak instability likely prevented a widespread outbreak from occurring. The cold front served as the only boundary to initiate tornadoes. In addition, the best lift and strongest winds slowly moved away from Alabama throughout the day on 28 November 2005 as the upper low to the north pulled away from the Southeast U.S.
6. ACKNOWLEDGEMENTS
Special thanks go to Jim Westland of NWS Birmingham for helping to create Figure 5 and proofreading this manuscript. Also, Kevin Pence of NWS Birmingham is thanked for proofreading and giving excellent suggestions towards improving this paper.


 Follow us on YouTube