 How Green Was Our Valley! Persistent Rains, Dolly Finish a Wet Late Summer 2008 |
|
|
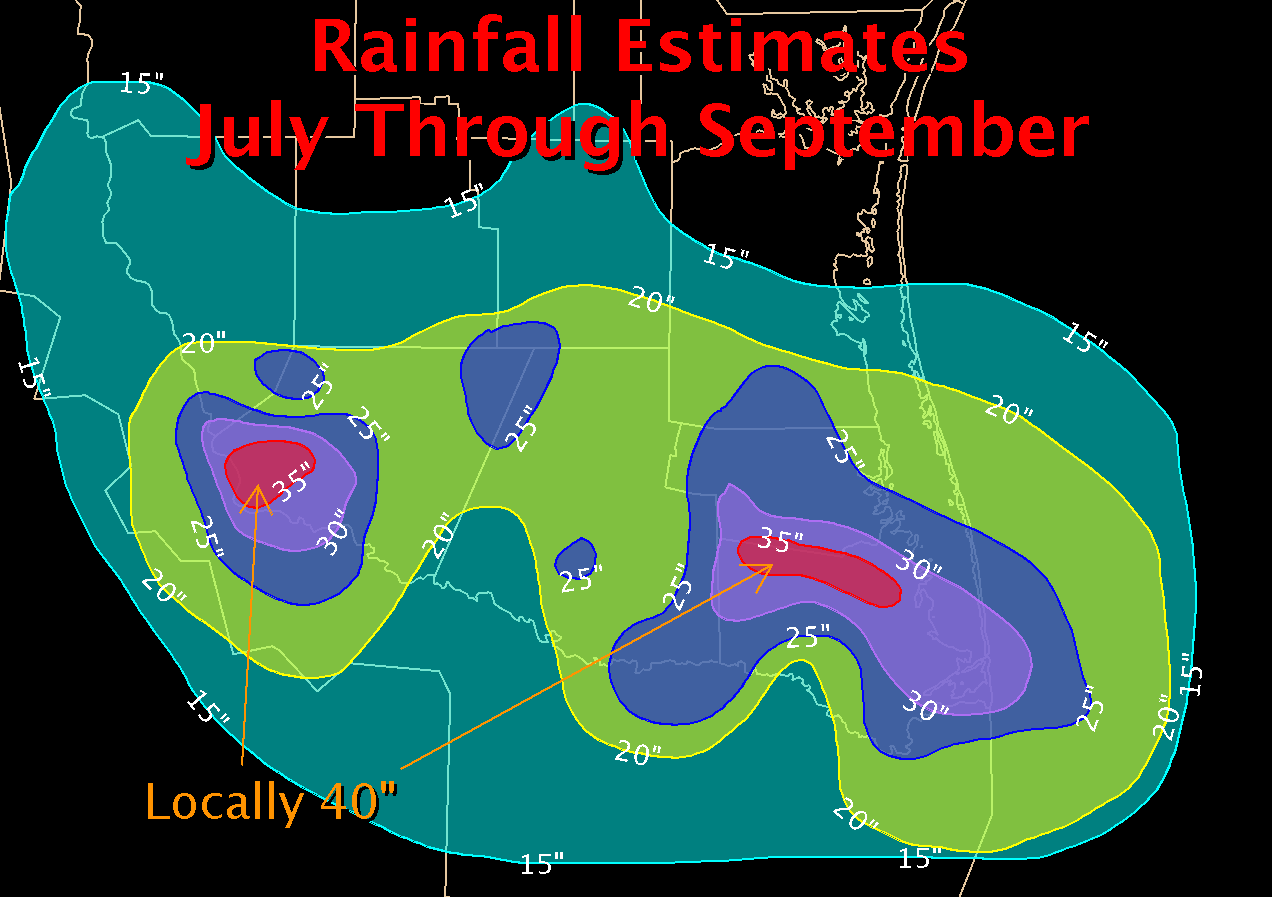
The Summer of 2008, which began auspiciously in severe to extreme drought (below), would move quickly from famine to feast by the time late September rolled around. When the dust (on in this case, mud) cleared, only the late summers of 1933 or 1886, which featured multiple tropical cyclones, and 1967, which featured Beulah, would rival that of 2008. The pattern turned on a dime during the first eight days of July, when the first of a number of locally heavy rainfall events would bring initial relief to parched soils, particularly in the Lower Rio Grande Valley. However, the initial relief would be overwhelmed by Dolly's torrents between July 22nd and 24th, which dumped between 8 and 18 inches (or more in some spots) of additional rainfall across the Lower Rio Grande Valley, and a more welcome 4 to 8 inches from Zapata east through Kenedy County, areas which didn't feast on the heavier rains earlier in the month. By the end of July, not only had the 2008 Drought been eradicated, but high standing water remained in neighborhoods with poor drainage, and many farmers' fields, especially in Hidalgo, Willacy, and Cameron County. In all, some areas likely received more than two feet of water! A "nose" of heavier rainfall in southern Starr County, the result of persistent heavy rain bands that continued well south of the center of departing Dolly on the 24th would prove critical come August, when atmospheric conditions favoring the heaviest rains shifted into the western Lower Rio Grande Valley and Rio Grande Plains. 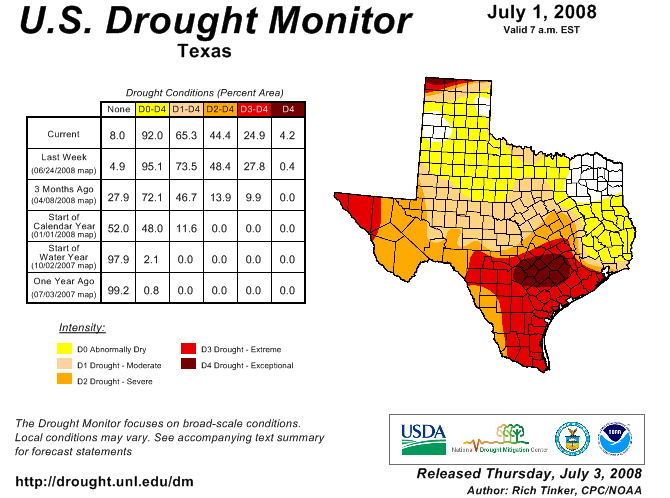 |
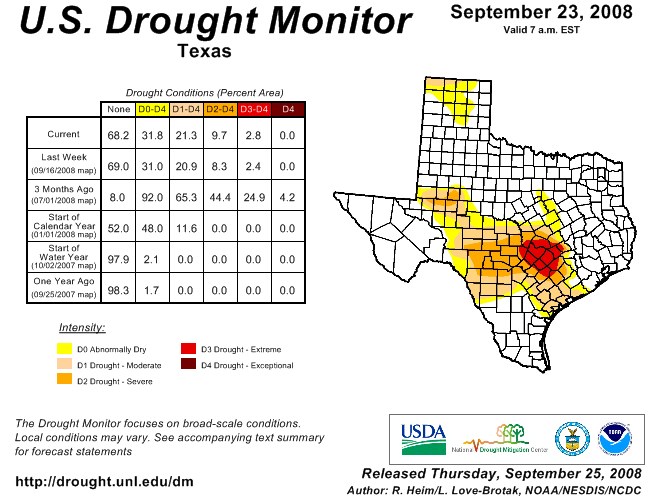
Immediately after Dolly's torrents, the Valley received a reprieve from widespread heavy rainfall. However, abundant water now in the ground helped keep daytime temperatures several degrees below their typical mid summer swelter, while holding nighttime readings a bit above their averages. Relative humidity remained high enough to preclude substantial surface drying, setting the stage for another round of flooding in the Valley, once the atmosphere cooperated. That would occur between August 17th and 25th, when a series of northwest to southeast oriented upper level disturbances lined up from the Big Bend southeast through the Rio Grande Highlands and Plains, on into the foothills east of the Sierra Madre Oriental in northeast Mexico, and combined with a low level jet of deep tropical moisture, to produce more than 16 inches of rain in southwestern Starr County. Considerable, life threatening flash flooding resulted, impacting more than 1000 residences. September would begin with more typical late summer scattered showers and thunderstorms; however, by mid month, a weakening front would ease through Deep South Texas, initially pooling deep tropical moisture across the entire area between the 14th and 15th, once again favoring Starr County, but also hard hit areas of eastern Hidalgo and western Cameron County. After a brief respite of cooler and drier air, heavy rains would return over the following weekend, but finally terminate soon after the autumn equinox, as dry, pleasant weather finally returned by the 26th. By then, the 2008 Deep South Texas Drought was a distant memory (above). |
|
|
|
|
|
|

