|
Overview
The 2014 Atlantic Hurricane Season was forecast to be below average, and after a 2013 where early season forecasts might be best remembered for being well beyond what actually occurred, 2014’s forecast was pitch perfect. With the exception of a single brush with the Carolina Coast, 2014 marked the second year with little or no impact to the large and growing coastal population of the U.S. Gulf and Atlantic coasts.
June was void of any activity, but July saw a festering surface low and cluster of thunderstorms along the Florida Treasure Coast (east of Melbourne) go to work on the one pocket of very warm waters, as well as the Gulf Stream. Hurricane Arthur spun up from a Tropical Storm in a day, and by July 2nd was a minimal hurricane east of Jacksonville. Arthur would intensify to a Category 2 storm while crossing the North Carolina Outer Banks, but impacts were minimal compared with historic hurricanes of the past. Arthur would stir up plenty of surf for the July 4th holiday period while tracking just east of the Virginia Capes and past the mid Atlantic and New England coast, before weakening and dissipating in the Bay of Fundy near Nova Scotia, Canada. Thereafter, the season would be known for "fish storms"; all of the hurricanes that would form during the peak of the season (August and September) formed in the northwest corner of the main development region (MDR) and recurve around persistent flow between the central Atlantic ridge and a fairly persistent eastern North American trough (below). The low number of storms was well anticipated due to the ocean/atmospheric response to a strong Kelvin Wave (note dark reds between March and May 2014) that was likely a key contributor to the frequent bouts of wind shear and dry air across the MDR, which combined with (and perhaps aided) generally below average sea surface temperatures. However, when tropical waves ("seeds") formed during periods with less dry air and wind shear in this area, all of them became hurricanes at some point. The one long–tracked major hurricane (≥111 mph wind), Gonzalo, cranked up to late season (mid October) Category 4 storm ravaged Bermuda on October 17th with sustained Category 2 winds (96 to 110 mph) though a gust of 144 mph (Category 4) was recorded. Preliminary damage of up to $400 million was estimated, but preparedness and good fortune kept casualties down at zero.
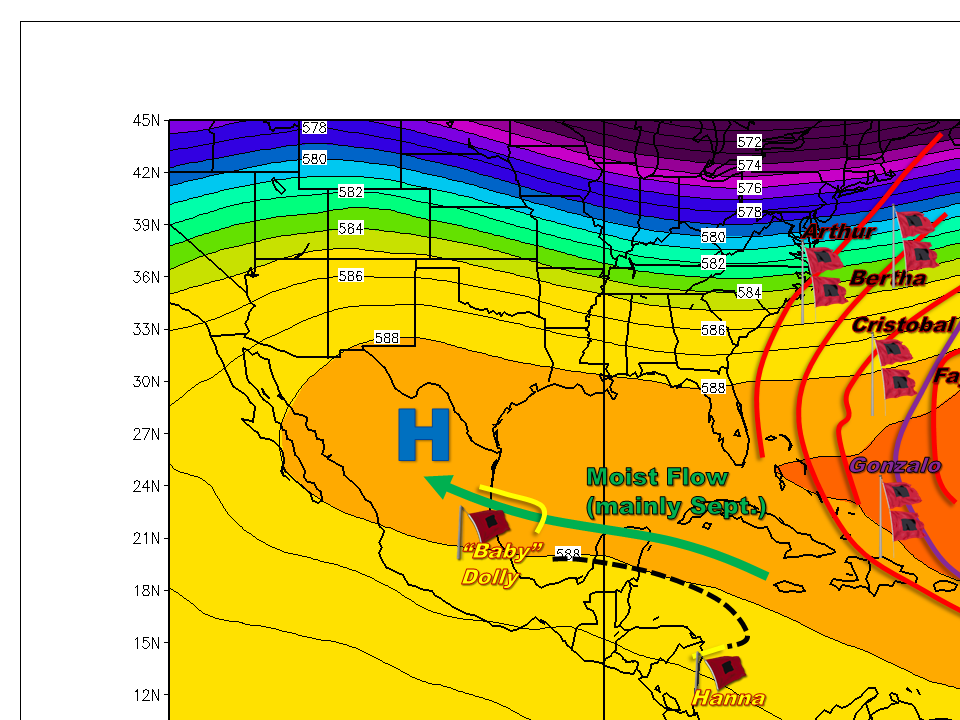
General steering patterns for the peak of the 2014 Hurricane Season (August to October; click to enlarge).
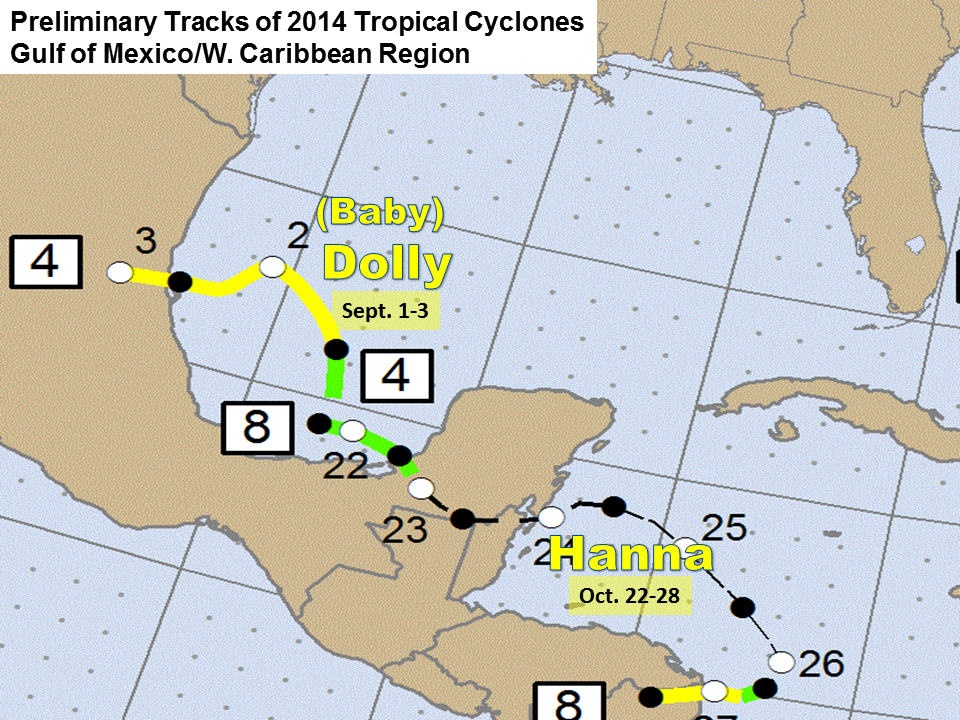
Rio Grande Valley: "Baby Dolly" Helps Drought
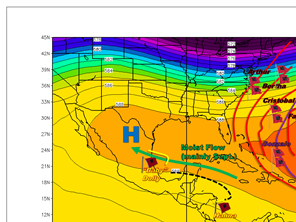
Nearly a year after the outer bands of Hurricane Ingrid brought a welcome September soaking in 2013, the Gulf of America’s single named cyclone organized into Tropical Storm Dolly immediately after Labor Day. Dolly would soon make landfall near Tampico during the late evening of September 2; heavy rainfall in and near Tampico damaged dozens of homes, killed one person, and left an estimated $6.5 million in mainly infrastructure damage. Outer bands on September 3rd reached the Valley and were remembered fondly as "Baby" Dolly for its helpful, drought relieving rains. The rains brought by "Baby" Dolly signaled the start of a second wet September in a row in 2014.
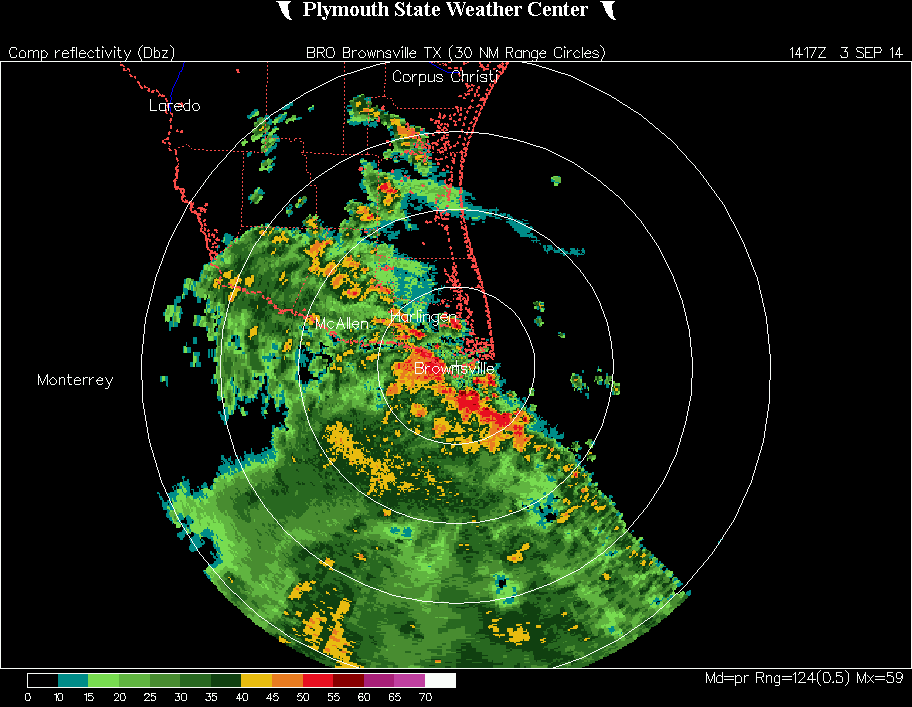
Loop of convergent band of locally heavy rainfall across the Rio Grande Valley associated with the remnant of Tropical Storm Dolly ("Baby Dolly"), September 3rd, 2014 between 821 and 10 AM CDT. Click to enlarge.
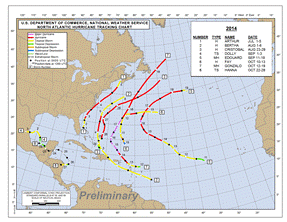
Preliminary 2014 Hurricane Season track, entire Atlantic basin (click to enlarge).
|
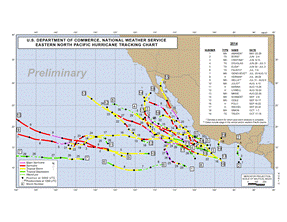
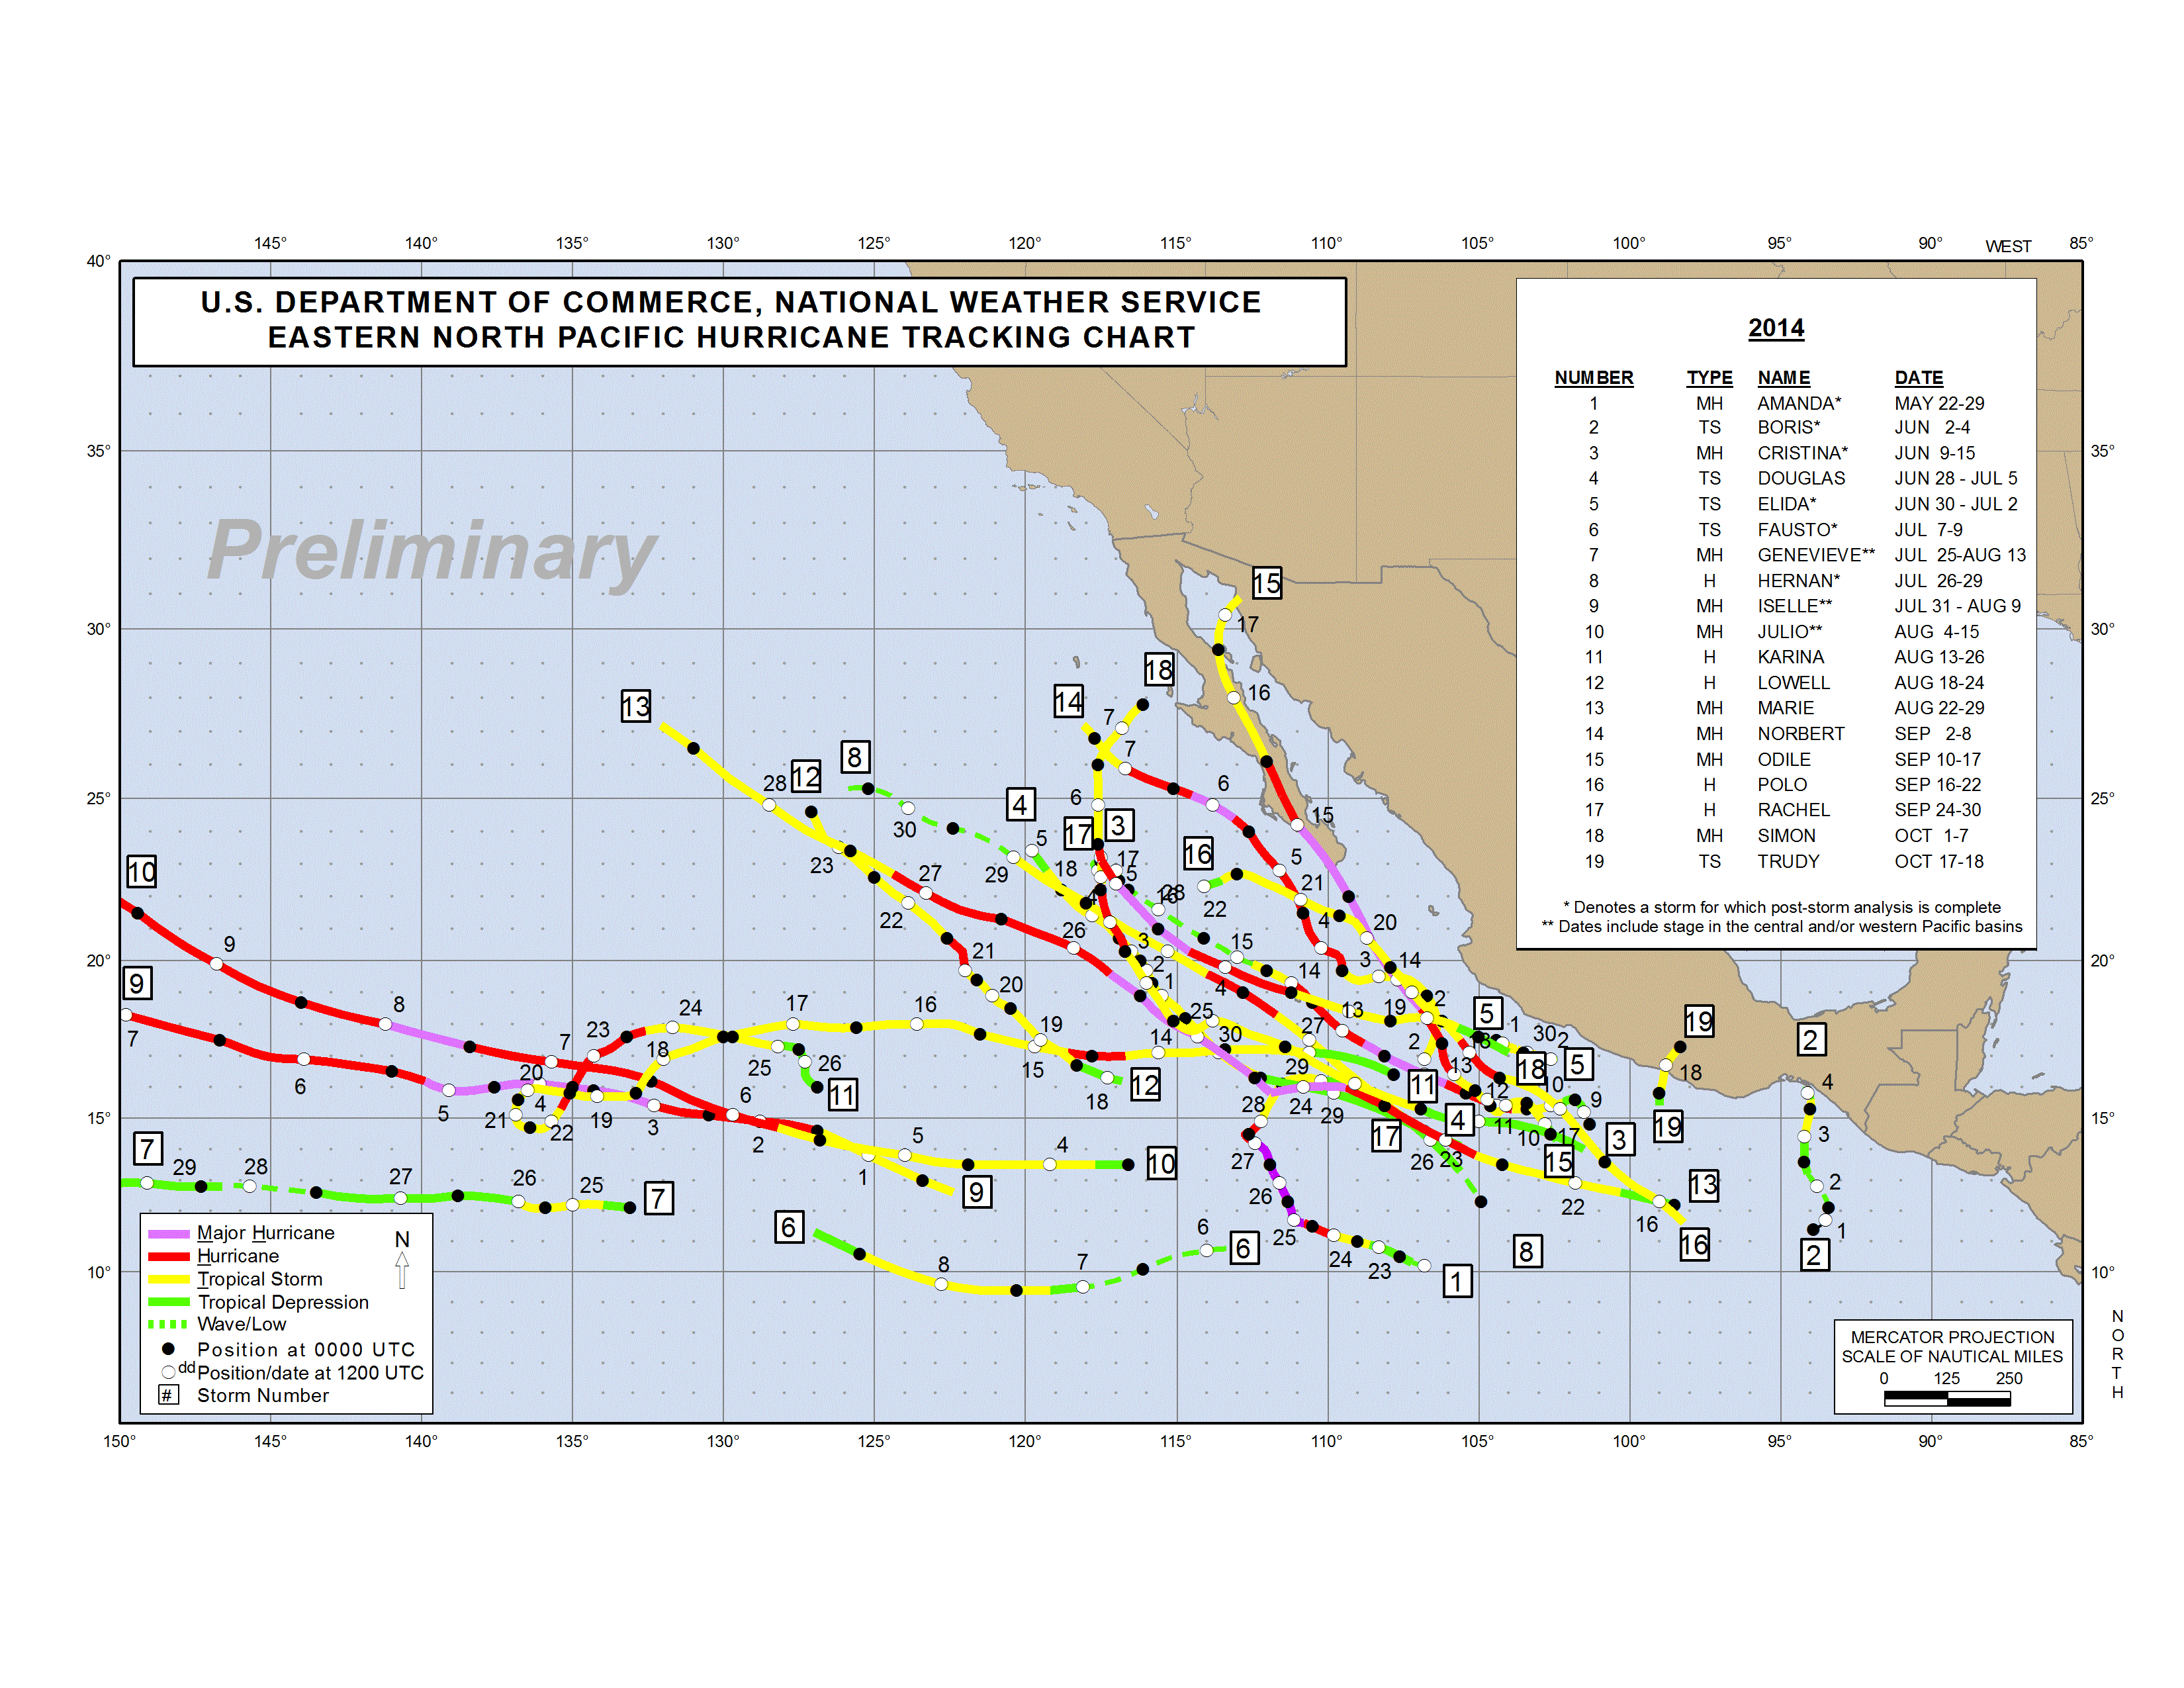
Preliminary Tracks of Eastern Pacific Hurricanes, 2014 Season. Note: As of this writing, Hurricane Vance had not been added to the map..
Eastern Pacific: Busy, Busy, Busy
While the Atlantic basin failed to launch, the Eastern Pacific exploded. Persistent and very warm waters (see loop below), low wind shear, and plenty of deep tropical moisture combined to produce the most active season along and west of Mexico and Central America since the 1990s. Nearly every storm spun out into the Pacific (above), but two did not: Hurricane Odile, which peaked at Category 4 strength, slammed into Cabo San Lucas (southern tip of Baja California) around midnight on September 15th, and would ultimately cause at least 15 deaths and more than $1 billion in damage, much of it to southern Baja California. Odile would rapidly weaken to a Category 1 storm as it crossed the spine of Baja California, and eventually a Tropical Storm before dissipating into a remnant low just prior to moving into Arizona. The remnant low would become absorbed into an upper level system that would spread welcome, drought relieving rainfall from southern Arizona through southern New Mexico and eventually into the Trans–Pecos region of Texas. Some of the water would flow down the Rio Grande and bring the conservation level at Amistad International Reservoir to its highest value (Texas Share) since August, 2012 – when releases and evaporation began during the heart of the drought release period (late 2011 through 2012). Moisture associated with Hurricane Vance (October 30–November 5) would phase with a diving upper level disturbance to enhance welcome rain for west Texas (November 4th), South Central Texas (November 5th), and the Rio Grande Valley (mainly November 6th and 7th).
In addition to Odile and Vance, there were a number of other notable stories to the Eastern Pacific Hurricane Season in 2014. The following are just a few of them.
- Hurricanes Iselle and Julio. In a rare double–shot, each of these cyclones, moving in parallel about a week apart, would cross into the Central Pacific and threaten the Hawaiian Islands. Iselle, at one time a Category 4 (140 mph peak wind, lowest pressure 947 mb), would make a beeline for the Big Island (Hawaii) but encounter wind shear and colder waters which allowed the storm to weaken. A tropical storm by landfall (August 7), Iselle caused more than $60 million in crop loss. Julio followed soon after, and reached Category 3 (120 mph peak wind, lowest pressure 962 mb) status before twisting north of the Hawaiian Islands and gradually weakening to a tropical storm with big surf the primary impact for the islands.
- Hurricane Genevieve struggled to survive a rough ride while east of 150°W Longitude. However, Genevieve would revive quickly while moving toward the International Date Line (180°W Longitude) and reach Category 4 strength before doing so. Genevieve would ultimately reach Category 5 status (160 mph peak wind, lowest pressure 915 mb) on August 7th as a Super Typhoon just west of the dateline before curving north into colder water and rapidly weakening.
- Hurricane Marie became the sixth (preliminary) lowest atmospheric pressure eastern/central Pacific Hurricane on record on August 24th, attaining a minimum pressure of 918 mb, accompanied by 160 mph sustained wind. Marie had the lowest pressure since Hurricane Rick (906 mb) in 2009. Marie’s huge girth produced impacts well away from the center. While off the coast of southwest Mexico, heavy rains in Oaxaca produced flooding and landslides that killed two. Outer bands with tropical storm gusts created additional landslides in Baja California. Huge swells and surf, up to at least 25 feet, produced coastal flooding and damage to beach infrastructure in Southern California. Damage exceeded $10 million on Long Beach and $3 million on Santa Catalina Island, west of Los Angeles.
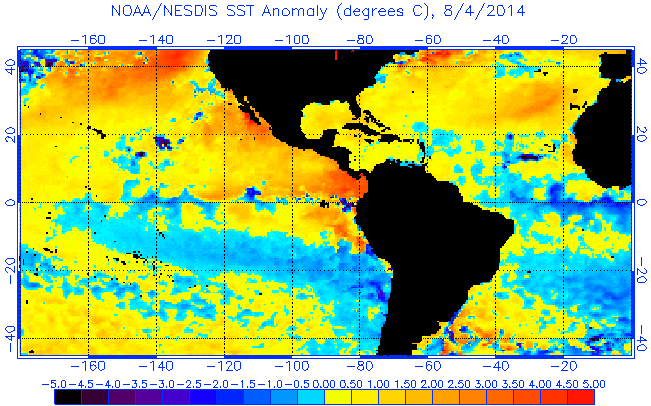
Loop of Tropical Atlantic Sea Surface Temperature Anomalies, for August through November, 2014. Reds and Orange colors indicate significantly above average values; darker blues and purples significantly below average. Note the persistent warm waters west of Mexico and Central America, compared with near to below average across the tropical Atlantic (between Africa and the Caribbean Islands). The persistence of warm Eastern Pacific waters were a primary contributor to the very active 2014 season; conversely, the persistence of cooler than average waters in the tropical Atlantic contributed to the quiet season there.
|
|
|
Fast Facts – Atlantic
NOAA’s May 2014 Atlantic Hurricane Outlook forecast 8 to 13 named storms, 3 to 6 hurricanes, zero to 2 major hurricanes, and an Accumulated Cyclone Energy (ACE) Index Range of 40 percent to 100 percent of average. The preliminary results:
- 8 named cyclones
- 2 tropical storms
- 6 hurricanes
- 2 major hurricanes
- ACE estimate: 65, or 70 percent of average (93.2)
Fast Facts – Eastern Pacific
NOAA’s May 2014 Eastern Pacific Hurricane Outlook forecast 14 to 20 named storms, 7 to 11 hurricanes, 3 to 6 major hurricanes, and an Accumulated Cyclone Energy (ACE) Index Range of 95 percent to 165 percent of average. The preliminary results:
- 20 named cyclones
- 5 tropical storms
- 15 hurricanes
- 9 major hurricanes
- ACE estimate: 198, or 152 percent of average (130)
|


