 Photos from Brownsville flooding during the afternoon of October 30, 2015. Credits: City of Brownsville, Brownsville Herald, NWS Brownsville/Rio Grande Valley, NWS Brownsville Facebook contributors. |
|
| Brownsville Takes (Another) Flood Turn Atmospheric Energy, Unseasonable Warmth/Humidity Set Stage for 4–7 Inches |
|
|
This time, Brownsville took the main hit. While the remnants of a tropical storm were not a factor, the atmosphere "exploded" into action on the day prior to Halloween, dumping buckets of rain on the City of Brownsville, mainly from downtown east toward the Port, and including all of the neighborhoods in Southmost, which took the brunt of the torrents. City–wide, 4 to 7 inches fell, with highest totals in the more densely populated sections of town where poor drainage is more of an issue as well. The heaviest rainfall, four to six inches, fell in a two to three hour window between 11 AM and 2 PM. Flooding rapidly ensued, transitioning from nuisance to more life–threatening in less than an hour; by noon, feet of water were inundating some roads and by 2 PM up to 5 feet covered one of the most prone areas of town – the "Four Corners" area where State Road 4 (International Blvd.) intersects State Road 48 (Boca Chica Blvd./Padre Island Highway). Neighborhood roads in Southmost were inundated with two to three feet of water, and dozens of homes and businesses flooded due to a combination of high water that filtered into homes and vehicles that created waves of water which surged into them. At Brownsville/South Padre Island International Airport, the 6.5 inches that fell with the storms was the most rapid accumulation since 6.48 inches fell with a tropical feed of moisture on September 19, 2010. For the day, the 6.55 inches fell just behind Hurricane Dolly’s 6.68 inches, and the value ranked 3rd highest daily total all–time in October, dating back to 1878, but was the highest total to occur without the aid of a tropical cyclone (depression, storm, or hurricane). For some, particularly downtown, the total on October 30th nearly mirrored those from August 31, 2015. 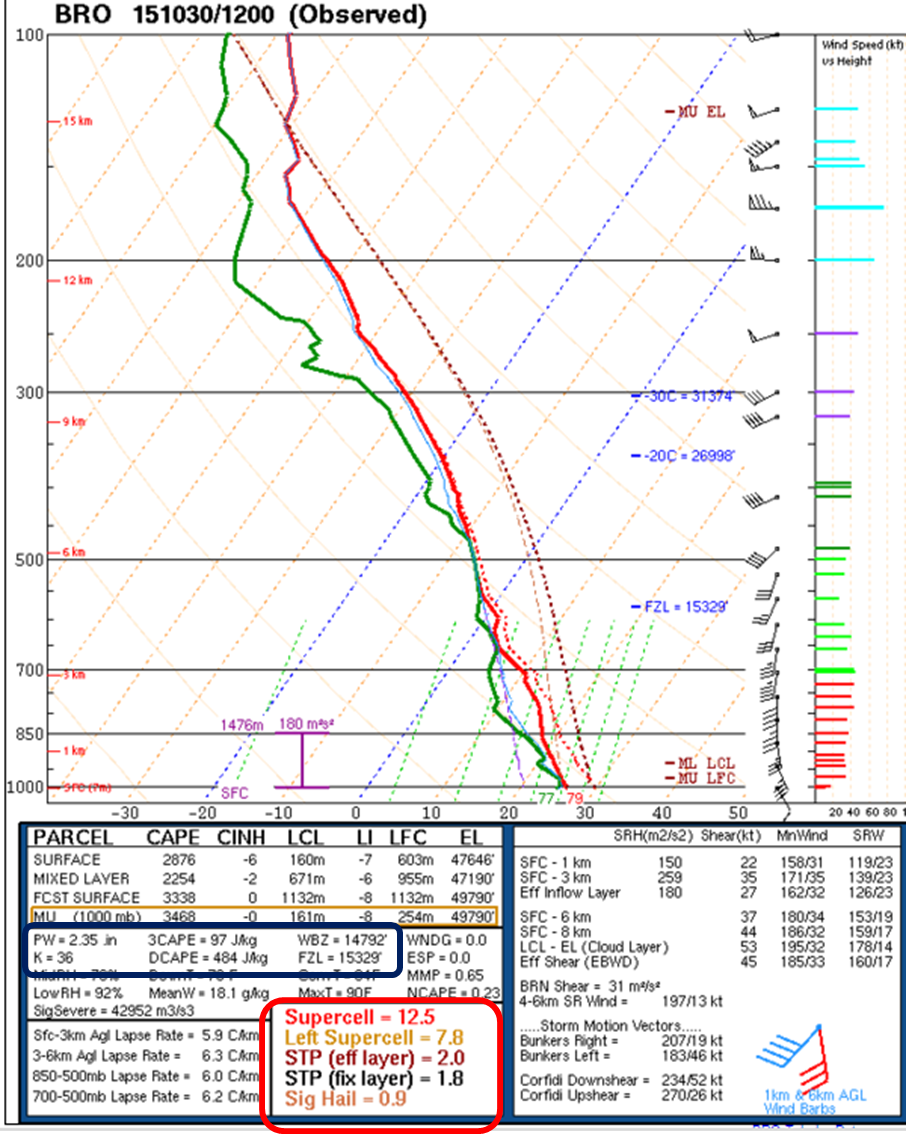 Atmospheric profile at Brownsville, TX, 7 AM October 30, 2015. Note the unusually high moisture content in the blue outline area (2.35 inches of precipitable water, which was the highest on record, dating back to 1948) and tropical nature of the atmosphere (wet bulb zero height near 15,000 feet, more common in August and September). In addition, very impressive wind shear and "turning" of the winds (red outline) was present, which earlier set the stage for a mini–supercell to spawn two small tornadoes in Willacy County at daybreak. |
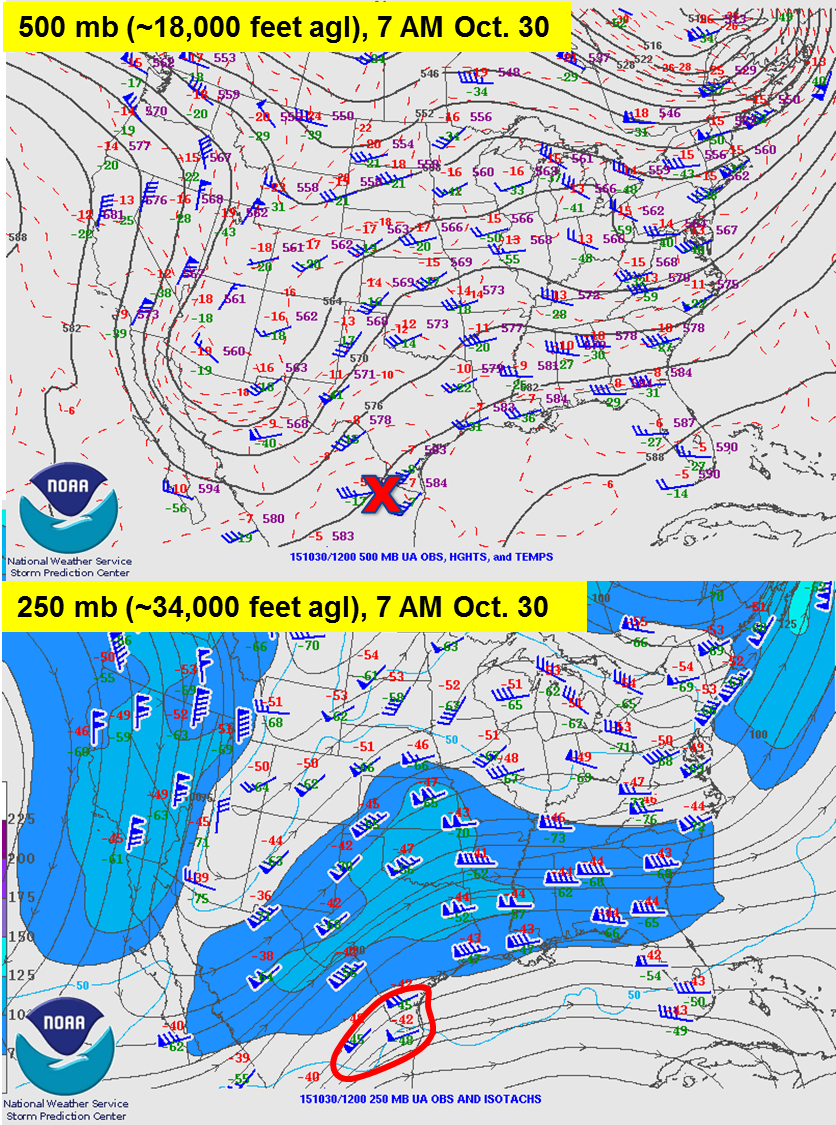 500 mb flow(top) and 250 mb flow (bottom) at 7 AM October 30, 2015. Though subtle, the red "X" at 500 mb indicated a mini short wave that energized the tropical moisture; at 250 mb, the Lower Valley was in a favorable location of an upper jet streak for rapid uplift. Why the Atmosphere Went "Boom"! If flooding rain weren’t enough, excessive, nearly continuous cloud to ground lightning featured in the core; the statuesque NWS Brownsville/Rio Grande Valley Doppler Radar dome was in the way of one such strike, captured here, courtesy of Electronic Technician Derek Urch. By stroke of luck, and skill, backup circuit boards were in stock and were installed later during the afternoon when conditions improved, and the radar was back in service by early evening. Several thousand Lower Valley residents did lose power for a time, however. A final damage estimate from the flooding and lightning will be available at a later date. |
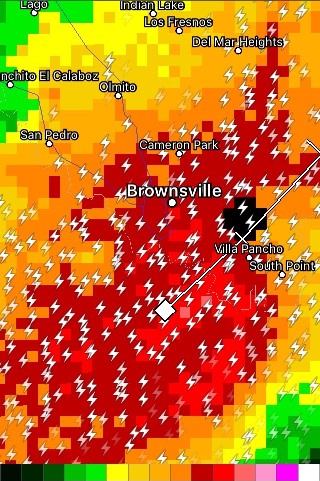 Composite Reflectivity screenshot, 1119 AM October 30th, showing core of heaviest precipitation (red/maroon colors) as well as nearly continuous cloud to ground lightning strikes, just prior to the radar itself being struck by lightning. |
|
 Photos from central Willacy County on October 31, 2015, the day after flooding resurgence in areas that had just begun to drain just a couple days earlier. Credits: NWS Brownsville/Rio Grande Valley survey team. By the afternoon of October 30th, rural, agricultural central Willacy County had to wonder what they had done to deserve such a cruel fate. After a three–day slam (October 22 to 24) that left up to 14 inches of rain, two early morning small tornado producing storms (with their own locally heavy rain) were followed by the northern end of the Brownsville deluge by mid to late morning on the 30th. Radar and observations indicated another 2 to 4+ inches fell over the same areas, raising water levels once again. Pity San Perlita (above). Following several days of dry weather between the 25th and 28th finally drained the majority of water, the still–saturated soil and full drainage ditches and pipes quickly overflowed that afternoon; high water of 1 to 3 feet covered many streets and surrounded more than a dozen buildings. The American Red Cross, along with the Salvation Army, had already opened a shelter after the initial events a week earlier. In total, an estimated, preliminary monthly rain total of 14 to 18 inches, perhaps 20 inches in some locations, gave Willacy County an October to remember; combined with the pockets of 10+ inches from southeast Hidalgo through northwest Cameron, as well as around Brownsville, rainfall for the Lower and Mid Valley likely exceeded benchmark recent Octobers in 1997 and 2002. 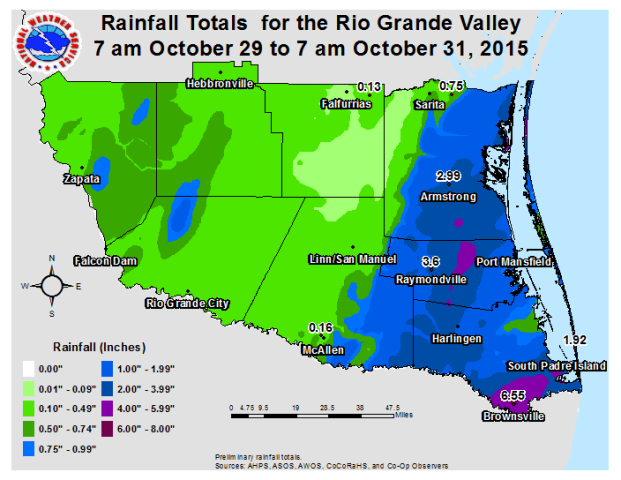 Note the areas in purple (4 to nearly 6 inches in central Willacy), and pockets of 6 to 7 inches in Brownsville. Even Weslaco wasn’t spared; another 2 to 3 inches fell on the east side of town into Mercedes. |

