Middle Tennessee Drought Information
 |
 |
| Current Drought Conditions | 2-Month Drought Change |
 |
 |
| Monthly Drought Outlook | Seasonal Drought Outlook |
 |
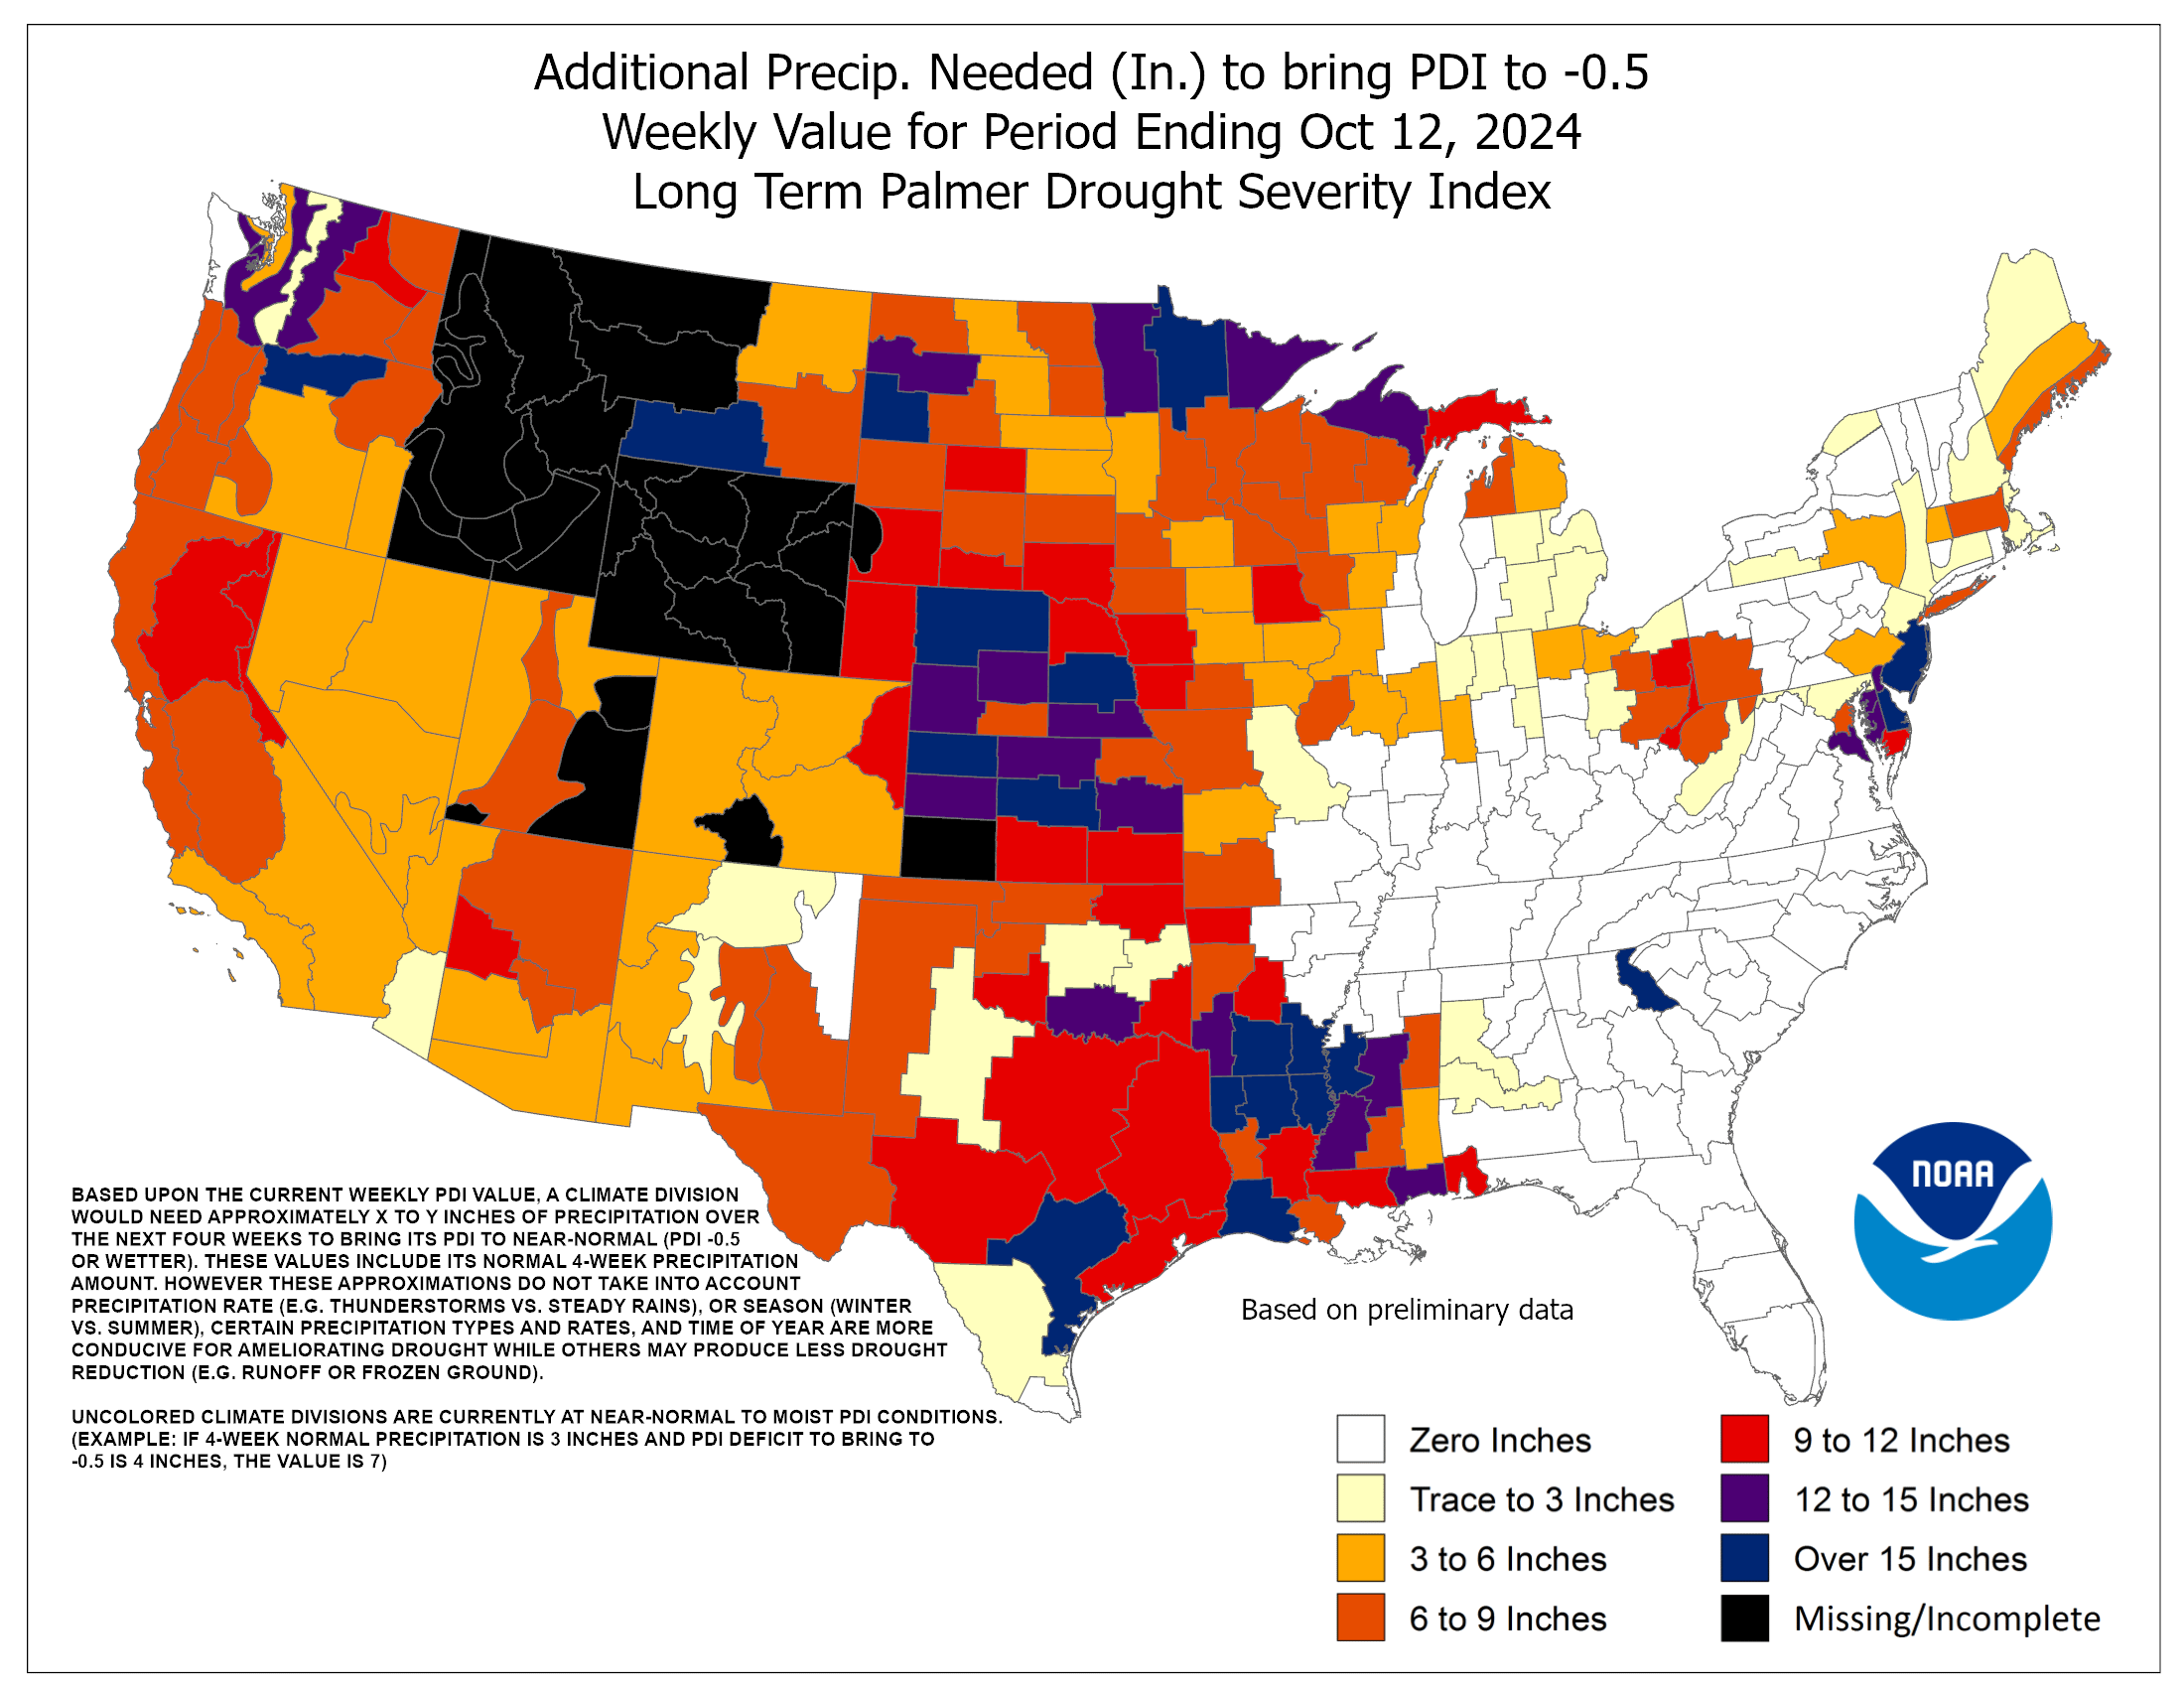 |
| Palmer Drought Severity Index | Precipitation needed to end current drought |
Precipitation
|
|
 |
|
| Precipitation Past 30 Days | 30-Day Departure From Normal | 30-Day % of Normal |
|
|
 |
|
| Precipitation Past 60 Days | 60-Day Departure From Normal | 60-Day % of Normal |
|
|
 |
|
| Precipitation Past 90 Days | 90-Day Departure From Normal | 90-Day % of Normal |
 |
 |
 |
| Precipitation Past 6 Months | 6-Month Departure From Normal | 6-Month % of Normal |
|
|
 |
|
| Precipitation Past 1 Year | 1-Year Departure From Normal | 1-Year % of Normal |
Agricultural Impacts
Reports/bulletins issued by the US Department of Agriculture:
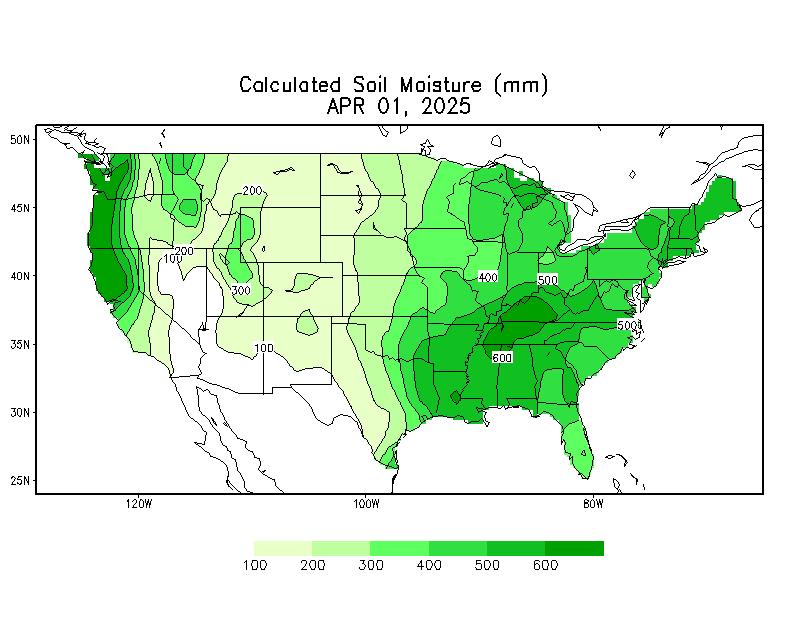
| Current Crop Moisture Index | Current Soil Moisture | Current Soil Moisture Anomalies |
 |
 |
 |
Hydrological Impacts
| Tennessee Streamflow Compared to Normal |
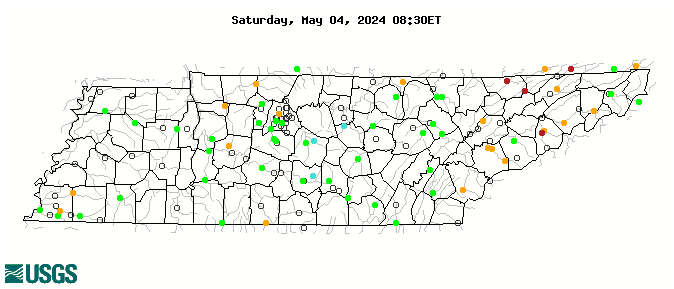 |
| Tennessee real-time streamflow compared to normal. Green is near normal, blue above normal, and orange/red are below normal. |
Long-Range Outlooks
| Temperature | Precipitation | |
| 6-10 Day Outlook |  |
 |
| 8-14 Day Outlook |  |
 |
| 1-Month Outlook |  |
 |
| 3-Month Outlook |  |
 |


