John D. Gordon, Bobby Boyd, Mark A. Rose, and Jason B. Wright
Warning & Forecast Office Old Hickory, Tennessee
Date Submitted: April 19, 2000
Note: See updated research on the April 16, 1998 tornado outbreak at https://www.weather.gov/ohx/19980416
Abstract
On April 16, 1998 a tornado outbreak struck middle Tennessee. More than 20 supercells were identified on radar, and 10 confirmed tornadoes struck the area. Nashville itself was struck by three tornadoes (one rated F3 and two rated F2) which overshadowed the most violent and dangerous tornado of the event, an F5 which struck Lawrence County. The rarity of an F5 itself is noteworthy, especially considering that this may be the only F5 tornado to occur in the history of Tennessee.
Besides an in-depth discussion on the Lawrence County F5 tornado, this paper will discuss proposals to downgrade the three former Tennessee F5 tornadoes, in 1952 and 1974. Strong evidence will be provided to prove why the authors feel the Lawrence County F5 tornado is the only F5 in Tennessee history.
1. Introduction
On April 16, 1998, a tornado outbreak struck middle Tennessee. More than 20 supercells were identified by radar, and 10 tornadoes were confirmed. The Warning & Forecast Office (WFO) in Old Hickory (OHX) issued 200 severe weather warnings on April 16, including 106 tornado warnings, in less than 18 hours. The Nashville metropolitan area was struck by three tornadoes- one rated F3, which struck the downtown area, and two rated F2. The F3 hit the downtown area. However, the most violent and dangerous tornado of the entire event, the Lawrence County F5 (figure 1), was nearly forgotten.
There may be two reasons why the Lawrence County tornado did not receive the attention of the Nashville tornadoes: 1) it struck four remote counties in southwest middle Tennessee, and 2) a major metropolitan area (Nashville) was hit by three tornadoes. The resulting intensive media coverage of the Nashville tornadoes simply overshadowed the impact of F5 winds in rural Lawrence County.
Several papers have been written on F5 tornadoes: Andover, KS, Jarrell, TX, and Plainfield, IL. However, the Lawrence County F5 was perhaps the first bonafide F5 in Tennessee history. Because F5s account for less than one percent of all tornadoes, this paper will analyze events surrounding the "Forgotten F5" in Lawrence County.
Official National Weather Service (NWS) records, obtained from the Storm Prediction Center (SPC), in 1999 listed three F5 tornadoes in Tennessee since records began in 1950. Extensive research by the authors has shown that these three ratings are likely erroneous. (The lead author worked extensively with the SPC to consider downgrading these three F5s, which occurred in 1952 and 1974, to F4 ratings.)
Besides an in-depth discussion of the Lawrence County F5 tornado, this paper will discuss proposals to downgrade the three former F5 tornadoes, and why the authors feel the Lawrence County F5 tornado of 1998 is the only legitimate F5 in Tennessee history.
2. Synoptic and Mesoscale Features
The synoptic scale pattern at 1500 UTC on April 16 (not shown), derived from the initial analysis of the Rapid Update Cycle (RUC), was characterized by a long wave trough across the central United States. A series of short wave troughs were embedded in the flow from Oklahoma to Wisconsin. At 300 millibar (mb), a 110 knot polar jet stretched from Oklahoma to Lower Michigan, while a 110 knot subtropical jet extended from Texas to southern Alabama. At 700 mb, a strong southwesterly dry air intrusion had moved into western Tennessee (<50% relative humidity). At 850 mb, the thermal ridge was west of the moist axis with dew points of 10oC across Tennessee. In addition, a 40 knot 850 mb southwesterly jet extended from central Mississippi into southern Tennessee. Finally, a surface low was centered over southwest Michigan with a cold front extending southwest into west Tennessee.
The 1500 UTC RUC 6-hour forecast (not shown) revealed several noteworthy upper level features. The most impressive of these was the 110 knot polar jet extending from southwest Missouri into northern Indiana, and the 120 knot subtropical jet extending from central Texas into western Alabama. Detailed studies of transverse circulations in the exit and entrance regions of jet streaks were undertaken by Uccellini and Johnson (1979), Hakim and Uccellini (1992), and Thiao, et al. (1995). These studies showed vertical motion fields are significantly enhanced when the ascending branch of a thermally direct circulation in the entrance region of a jet streak is coupled with the ascending branch of a thermally indirect circulation associated with the exit region of a second jet streak. As the ascending branches of the subtropical and polar jet streaks merged over middle Tennessee on April 16, 1998, upward vertical motion further intensified in the mid and upper levels.
The ageostrophic flow associated with the lower branch of the transverse indirect circulation likely contributed to the intensification of the 850 mb low level jet, and backing of the low level wind field across middle Tennessee. The 850 mb low level jet increased to 45 knots and stretched from northeast Alabama to western Virginia. In addition, the 850 mb dew points increased to 18oC across middle Tennessee. A negatively tilted trough at 500 mb was oriented across west Tennessee and western Kentucky. The combination of the negatively tilted trough and the pronounced diffluent region between two branches of the jet set the stage for what Hales (1996) identifies as the most massive severe weather outbreak pattern.
A composite chart, advocated by Miller (1972), can be very useful when forecasting severe weather. Including all surface and upper air features on one map allows the operational forecaster to better assess the potential for severe convection. Figure 2 shows the 6 hour forecast composite chart from the 1500 UTC RUC.
The 700 mb dry air intrusion (<50% relative humidity) increased the SWEAT (Severe Weather Threat) (figures 5a and 5b) to near 500. Convective Available Potential Energy (CAPE) increased to near 1600 J kg-1, lifted indices decreased to -7, and total totals remained at 55. These values correspond to the moderate to strong range of the Imy (1998) and Miller (1972) severe weather parameter checklist. (Section 4 will discuss the evolution of the wind field across middle Tennessee on April 16, especially over Lawrence County.)
3. Nashville Tornadoes
On April 16, 1998, Nashville became the first major U.S. city (>100,000) in nearly 20 years to be struck by an F2 (or larger) tornado in the downtown area. Shreveport, LA took two direct hits in 1978: April 17 (F2) and December 3 (F4). On November 15, 1989, Huntsville, AL was struck by an F4. This tornado hit the southern portion of the city (Grazulis 1993). On March 1, 1997, Little Rock, AR was struck by an F4. This tornado hit the south part of the city, then moved northeastward (Storm Data 1997). On April 8, 1998, the western suburbs of Birmingham, AL were struck by an F5. This storm lifted 2-3 miles west of downtown Birmingham (Peters and Murphy 1998).
On the morning of April 16, local media began continuous live coverage of the tornado outbreak. This coverage rapidly intensified to a national level when Nashville was struck by an F3 tornado in the downtown area at 2030 UTC. All three national news networks either led off with coverage of the Nashville tornadoes or reported it during the first five minutes of the newscast. The local, state, and national news justifiably focused on the Nashville tornadoes, thus greatly overshadowing the Lawrence County F5. The tracks, F-scale ratings, times of occurrence, and track lengths are shown as figure 4.
4. Lawrence County Tornado
Around daybreak on April 16, showers and thunderstorms from west Tennessee and northern Mississippi moved into southwest middle Tennessee. This convection left an outflow boundary across Wayne and Lawrence Counties of southwest middle Tennessee. We hypothesize this boundary played a significant role in the formation of the Lawrence County tornado. The severe thunderstorm that spawned this tornado formed over McNairy County (3 counties west of Lawrence). Strong reflectivity structures were evident at ranges over 100 nautical miles (nm) from KOHX. Golfball size hail was reported in McNairy County between 2120 and 2125 UTC.
Supercell reflectivity characteristics quickly evolved in southern Hardin County (2 counties west of Lawrence). This included an inflow notch, tight reflectivity gradient, and a weak echo region. In southern Hardin County, 101 nm from KOHX, a rotational velocity (Vr) of 45 knots at 0.5o elevation was calculated at 2140 UTC. Due to the sparse population of southern Hardin County, no severe weather reports were received. However, the supercell strengthened as it moved into Wayne County (one county west of Lawrence). "Classic textbook" supercell signatures apparent in the reflectivity products included: 1) a bounded weak echo region (BWER) capped by high reflectivities (>57 dBz) aloft; 2) a hook echo; and 3) a strong reflectivity gradient along the right storm flank.
The 1800 UTC special sounding and hodograph (figures 5a and 5b) indicated a storm motion of 249o at 36 knots. A fairly representative hodograph (figure 3b) of the tornadic supercell environment was constructed with the 2200 UTC KOHX WSR-88D VAD Wind Profile (VWP) using SHARP (Hart and Korotky 1991). A mean storm motion of 260o at 41 knots was determined by analyzing reflectivity data. This storm motion fits the supercell profile very well since it was nearly 30o to the right of the mean wind.
Recent observations have shown that boundaries play a much more significant role in the formation of tornadoes than previously thought (Markowski 1998). Outflow boundaries, documented by Wakimoto et al. (1998), Pryzbylinski et al. (1993), and Maddox et al. (1980), serve as a rich source of baroclinically generated horizontal vorticity which may enhance the potential for low level mesocyclone development. The Atkins and Weisman (1998) cloud modeling study between supercells and pre-existing boundaries concluded that the low-level mesocyclone forms much earlier and is much stronger in simulations when a boundary is present.
Johns et al. (1990) and many others have discussed that veering of environmental winds can lead to supercell convection. This veering of horizontal winds with height gives a component of vorticity along the storm relative wind called streamwise horizontal vorticity (Davies-Jones et al. 1990). Storm relative helicity (SRH) depends directly on streamwise horizontal vorticity and the low level storm relative wind. The SRH is one measure of the rotational potential for a storm moving through a vertically sheared environment, but it is important to remember that SRH varies explicitly with storm motion. In addition to the outflow boundary over Wayne and Lawrence Counties, large pressure falls, possibly induced by the mid level (~700 mb) jet, across eastern middle Tennessee likely induced a localized backing of the low level winds. This increased the low level shear and the SRH.
Davies-Jones et al. (1990) and Johns et al. (1993) have shown that SRH over 400 m2s-2, along with adequate instability, can significantly enhance the potential for strong and even violent tornadoes. Based on the WSR-88D VWP, the 0-3 kilometer (km) SRH increased dramatically from 145 m2s-2 at 1800 UTC to 342 m2s-2 at 2200 UTC (figure 3a). The F2 tornado was first spotted in Nashville at 2230 UTC. However, the SRH was likely stronger in Lawrence County due to the aforementioned boundary and large pressure falls.
The energy-helicity index (EHI), which combines SRH and instability into a dimensionless index (Davies 1993) was another useful index. Davies (1993) found that EHI values over 4, along with sufficient mid level winds and storm relative inflow, suggest that violent tornadoes are possible. At 1800 UTC, the EHI at Nashville was 1.3, but more than doubled by 2200 UTC to 2.7 (figure 3a). Again, the EHI was likely much higher across Wayne and Lawrence ounties.
A large range folded area was present from the 80 nm range bin to the 100 nm range bin at all elevation angles. This prevented a detailed scan-by-scan analysis of storm relative motion (SRM). A useable 0.5o elevation SRM product was obtained in eastern Hardin County and Wayne County approximately every other volume scan. The initial tornado warning for Wayne County was issued at 2143 UTC. Seven minutes later, at 2150 UTC, an F4 tornado began 11 miles south of Clifton in Wayne County. The tornado was one mile wide at times, tracked 23 miles in Wayne County, killing 3 people. The initial tornado warning for Lawrence County was issued at 2156 UTC, with the storm crossing into Lawrence County at 2215 UTC.
Based on areal and ground storm surveys, the tornado intensified and produced damage, including some F5 damage, for 50 additional minutes. At 2220 UTC, the supercell finally exited the range folded area and showed a Vr of 40 knots at 0.5o elevation. Figure 6 contains both Vr and rotational shear (Vs) derived from KOHX 0.5o SRM products. This storm exhibited a strong, persistent, deep rotation, which characterizes a supercell (Doswell 1996), for one hour, beginning at 2220 UTC. The mesocyclone maintained an average depth of 15.4 kft during this time. The 2240 UTC reflectivity and SRM products (figures 7a and 7b) showed both a classic hook signature and a strong mesocyclone. Figure 7b contains several pixels of gate-to-gate shear. Despite the appearance of impressive rotational shear, the rotational velocity values are questionable because of improper dealiasing.
This one mile wide violent tornado struck largely rural areas of Lawrence County for 23 miles. Fortunately, no one was killed. It completely leveled many well constructed homes, wiping the foundations clean (Lawrence County Skywarn 1998), debarked several trees (figure 8), and hurled a one-ton pickup truck more than 100 meters (Storm Data 1998), all of which are described as F5 damage (Fujita 1973).
The OSF mesocyclone strength nomogram (Andra 1997) consistently showed a strong mesocyclone from 2220 UTC (end of the range folded area) until the tornado dissipated in Maury County at 2330 UTC. Vs values steadily increased from 0.022 sec-1 at 2220 UTC to 0.033 sec-1 at 2305 UTC (figure 6). Falk's (1998) tornadic nomogram was not available for the April 1998 outbreak. However, a post-analysis of the Vs nomogram indicated "probable tornado" to "tornado likely" during this time.
At 2255 UTC, strong reflectivity developed on the southwest flank of the storm, which gives evidence of a rear flank downdraft (RFD) (figures 9a and 9b). (Note: The mesocyclone shown in figure 9b is likely further southeast of the indicated position. Therefore we cannot conclusively place quantitative rotational values on the storm.) The RFD rapidly spread outward from the rear flank and wrapped cyclonically into the right storm flank, resulting in increased convergence and updrafts along the gust front. The RFD increased from a subtle feature to a "classic" RFD in the reflectivity and velocity data. Figures 9a and 9b illustrate this. (Ironically, the RPG selected the storm identification for the Lawrence County F5 as "F5.")
On average, rotational velocity values decreased slightly between 2310 UTC and 2330 UTC, with values decreasing below 50 knots (figure 6). The tornado weakened slightly to F4 across Giles and Maury Counties, producing extensive damage for nearly 17 additional miles.
5. Tennessee F5 Tornadoes
According to the SPC database there have been three F5 tornadoes in Tennessee. The first occurred on March 21, 1952 in Marshall County, Mississippi and Fayette County, in west Tennessee, which is one county east of Shelby County (Memphis). The second and third F5s occurred in Lincoln and Franklin Counties in middle Tennessee during the Super Outbreak of April 3, 1974. One of the co-authors (Bobby Boyd), who worked the Super Outbreak as a radar operator, questioned the 1974 ratings. Mr. Boyd's thorough memory of the 1974 Super Outbreak led to a chain of events which shifted the scope of the paper. The paper's original focus widened from a case study to include a detailed examination of former F5 tornadoes in Tennessee.
In 1973, Fujita and Pearson created the F-scale for rating tornadoes. A few years later, Dr. Schaeffer at the National Severe Storms Forecast Center hired more than 50 college students to rate tornadoes that occurred prior to the NWS F-scale implementation (Grazulis, personal communication). One student was hired per state, except Texas, which required several students. The 1952 storm was rated by one student, who used such data as photographs, newspaper articles, and information from emergency management. The storm originated near Byhalia, Mississippi and ended near Moscow, Tennessee. The college student rated the storm F4 in Mississippi and F3 in Tennessee. However, the SPC database shows this storm as F5.
Mr. Boyd conducted an independent survey of the 1952 storm, much like Grazulis (1993). Mr. Boyd traveled to Fayette County, visited several newspaper offices, and the Tennessee State Library and Archives in Nashville. The only evidence which might suggest the possibility of an F5 was a reference in the Memphis Sommerville Gazette of a "concrete block building being destroyed." Based on newspaper accounts not indicating "incredible damage" (Fujita 1974) in Fayette County, the authors believe the concrete building referenced was probably not a steel-reinforced structure. The authors concur with the student analyst and Grazulis (1993).
In figure 10 (Fujita 1974), the highest rating tornadoes #97 and #98 achieved was F4. Mr. Boyd was the primary radar operator at the Weather Service Meteorological Observatory at OHX during the super outbreak and vividly remembers the event. From discussions with several NWS employees, including the former state climatologist, the authors were unable to locate anyone who recalled whether the NWS had performed a storm disaster survey in middle Tennessee. However, Professor Fujita and some of his graduate students performed both ground and aerial surveys.
Furthermore, the authors researched several newspaper articles and pictures and spoke with the Lincoln County, TN Emergency Management Agency. All articles the authors researched indicated F3 and F4 damage in Tennessee and Alabama with both tornadoes. In fact, there was "devastating damage," including well-constructed homes leveled, steel structures badly damaged, and many deaths. However, the authors were unable to locate reference to the "incredible damage" that results from an F5.
The authors sent a detailed letter to the SPC recommending the two tornadoes from 1974, and the 1952 tornado mentioned above, be downgraded to F4. The SPC agreed to all three of these changes. The SPC database now reflects the conclusions of Professor Fujita's map of 1974, and Grazulis' 1952 tornado writeup (1993).
6. Summary And Conclusions
The April 16, 1998 tornado outbreak was a wake-up call to most of the nation. Tornadoes can hit large metropolitan areas. In fact, Nashville, the nation's 16th largest city, was struck by 3 tornadoes. Meteorologically, the event reiterated that when the combination of a Great Plains-type air mass interacts with upper level ageostrophic direct and indirect circulations, the probability of severe weather increases. In addition, it is critical to monitor areas for mesoscale boundaries when other factors are favorable for severe weather (Markowski et al. 1998). Atkins and Weisman (1998) found that the low level mesocyclone forms much earlier, and is also much stronger in simulations when a boundary is present. Early morning thunderstorms over Wayne and Lawrence Counties left a boundary over the area. This boundary and strong vertical wind shear created a favorable environment for severe thunderstorms.
The authors suggested that the three former F5 tornadoes in Tennessee should be reclassified as F4. These changes have been adopted, making the April 16, 1998 Lawrence County tornado the only documented F5 in the history of Tennessee.
Acknowledgements
The authors thank the following persons for their assistance with this paper: Thomas Grazulis, Director of the Tornado Project; Dr. Joe Schaeffer, Director, and Dan McCarthy, Warning Coordination Meteorologist, SPC; Derrel Martin, Meteorologist-in-Charge (MIC), Henry Steigerwaldt, Science-and-Operations-Officer (SOO), Darrel Massie, Lead Forecaster, and Diann Coonfield, Meteorologist Intern, WFO OHX; Rusty Pfost, MIC, WFO Miami, FL, Dave Andra, SOO, WFO Norman, OK, and John Ferree, Operational Support Facility, Norman, OK.
Authors
John Gordon has been a lead forecaster at WFO OHX since December, 1998. Previously, John served as a journeyman forecaster at WFO Springfield, MO from 1994 to 1998. Mr. Gordon joined the NWS in 1993 at Jackson, MS. He attended Parks College of St. Louis University, where he earned a B.S. degree in Meteorology in 1986. After graduation, he served six years in the Air Force at Tinker AFB, OK, and the European Forecast Unit in Germany. John has written several papers on a variety of topics, and is also a flight meteorologist with the Air Force Reserve Hurricane Hunters.
Bobby Boyd is a journeyman forecaster at WFO OHX. Mr. Boyd joined the Weather Bureau at Memphis, TN in March, 1969, and was transferred to Old Hickory in July, 1970. He worked the WSR-57 radar during the super outbreak of April 3-4, 1974. Mr. Boyd converted from meteorological technician to journeyman forecaster in 1994.
Mark Rose is a journeyman forecaster at WFO OHX. He previously served as a Navy weather observer (1988-1991) before attending Memphis State University. He graduated in 1994 with a B.S. degree in Geography. Mr. Rose joined the NWS at Montgomery, AL in May, 1994, and was transferred to OHX in June, 1995. Mr. Rose has authored or co-authored many technical papers, including publications in Weather and Forecasting and National Weather Digest.
Jason B. Wright received his B.S. degree in Meteorology from the University of Wisconsin-Madison in 1991. He served at four NWS offices as a meteorologist intern: WSMO Hondo, TX, NWSO Knoxville, WFO Albuquerque, NM, and WFO OHX. He was promoted to his current position, journeyman forecaster, in September, 1998. Mr. Wright's interests include operational meteorology, with an emphasis on public education.
References
Andra, D.L., 1997: The origin and evolution of the WSR-88D mesocyclone recognition nomogram. Preprints, 28th Conf. Radar Meteorology, Austin, TX, AMS (Boston), 364-365.
Atkins, N.T., and M.L. Weisman, 1998: The influence of pre-existing boundaries on supercell evolution. Preprints, 19th Conf. Severe Local Storms, Minneapolis, MN, AMS (Boston), 334-337.
Davies, J.M., 1993: Hourly helicity, instability, and EHI in forecasting supercell tornadoes. Preprints, 17th Conf. Severe Local Storms, St. Louis, MO, AMS (Boston), 107-111.
Davies-Jones, R.P., D.W. Burgess, and M. Foster, 1990: Test of helicity as a tornado forecast parameter. Preprints, 16th Conf. Severe Local Storms, Kananaskis Park, Alberta, AMS (Boston), 588-592.
Doswell, C.A., III, 1996: What is a supercell? Preprints, 18th Conf. Severe Local Storms, San Francisco, CA, AMS (Boston), 641.
Evans, M., 1997: A study on the relationship between CAPE, storm-relative helicity and tornadoes in Michigan. CR Applied Research Paper 18-06, NWS, CR-Headquarters, SSD, Kansas City, MO, 7 pp.
Falk, K.W., 1998: Rotational shear nomogram for tornadoes. Preprints, 19th Conf. Severe Local Storms, Minneapolis, MN, AMS (Boston), 733-735.
Fujita, T.T., 1973: Tornadoes around the world. Weatherwise, 26, 56-62.
__________, 1974: Jumbo tornado outbreak of 3 April 1974. Weatherwise, 27, 116-126.
Grazulis, T.P., 1993: Significant Tornadoes 1680-1991. The Tornado Project of Environmental Films, 1326 pp.
Hakim, G.J. and L.W. Uccellini, 1992: Diagnosing coupled jet-streak circulations for a Northern Plains snow band from Operational Nested-Grid Model. Wea. Forecasting, 7, 26-47.
Hales, J.E., 1996: Severe weather forecasting. Personal SPC notes, Severe Weather Workshop, NWS Tulsa, OK.
Hart, J.A., and W.D. Korotky, 1991: The SHARP Workstation- V 1.50. A Skew-T/Hodograph Analysis and Research Program for the IBM and Compatible PC. User's Manual. NWS Charleston, WV, 62 pp.
Imy, D., 1998: Severe weather forecasting. Personal SPC notes, Severe Weather Workshop, NWS Springfield, MO.
Johns, R.H., J.M. Davies, and P.W. Leftwich, 1993: Some wind and instability parameters associated with strong and violent tornadoes. Part II: Variations in the combinations of wind and instability parameters. Geophys. Monogr., 79, 583-590.
Lawrence County Skywarn, 1998: April 16, 1998 tornado information. Lawrence County Skywarn Homepage at https://www.lawrencecountyskywarn.org/april16.html.
Maddox, R.A., L.R. Hoxit, and C.F. Chappell, 1980: A study of tornadic thunderstorm interactions with thermal boundaries. Mon. Wea. Rev., 108, 322-336.
Markowski, P.M., E.N. Rasmussen, and J.M. Straka, 1998: The occurrence of tornadoes in supercells interacting with boundaries during VORTEX 95. Wea. and Forecasting, 13, 852-859.
Miller, R.C., 1972: Notes on analysis and severe storm forecasting procedures of the Air Force Global Weather Center. AWS Tech. Report 200 (Rev.), Headquarters Air Weather Service, Scott AFB, 106 pp.
National Oceanic and Atmospheric Administration, 1997: Storm Data, 39, No. 3, National Climatic Data Center, Asheville, NC.
National Oceanic and Atmospheric Administration, 1998: Storm Data, 40, No. 4, National Climatic Data Center, Asheville, NC.
Peters, B., and R. Murphy, 1998: April 8, 1998 tornado. National Weather Service Birmingham Alabama Home Page at https://www.srh.noaa.gov/bmx/april_08_1998/april_08_1998.html.
Przybylinski, R.W., J.T. Snow, E.M. Agee, and J.T. Curran, 1993: The use of volumetric radar data to identify supercells: A case study of June 2, 1990. In Proceedings, Tornado Symposium III. (C. Church, ed.) Amer. Geophys. Union.
Thiao, W., R.A. Scofield, and J. Robinson, 1995: The relationship between water vapor plumes and extreme rainfall events during the summer season. Nat'l. Wea. Digest, 19:3, 26-50.
Uccellini L.W., and D.R Johnson, 1987: The coupling of upper- and lower-tropospheric jet streaks and implications for the development of severe convective storms. Mon. Wea. Rev., 115, 682-703.
Wakimoto, R.M., C.-H. Liu, and H.-Q. Cai, 1998: The Garden City, Kansas storm during VORTEX 95. Part I. Overview of the storm's life cycle and mesocyclogenesis. Mon. Wea. Rev., 126, 372-392.
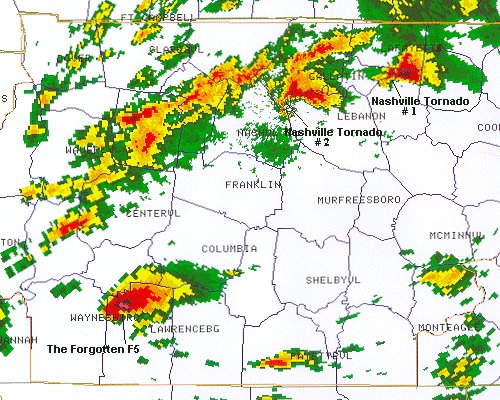
Figure 1
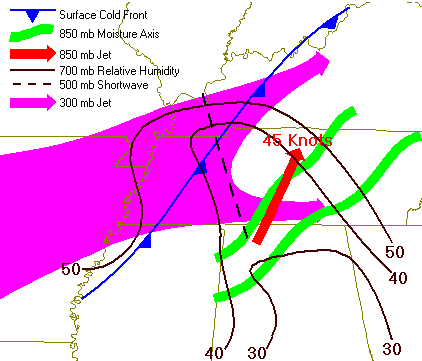
Figure 2
Figure 3a
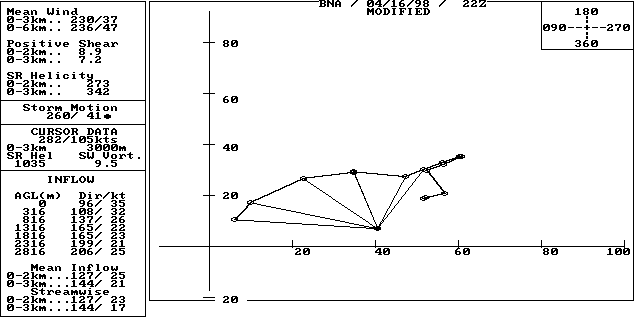
Figure 3b
Figure 4
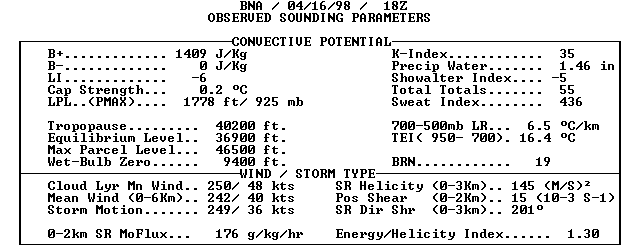
Figure 5a
Figure 5b
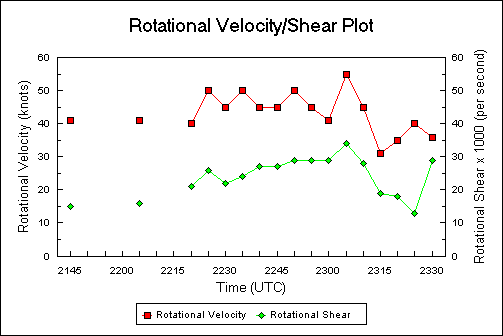
Figure 6
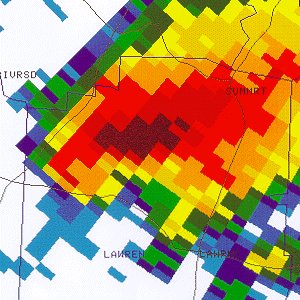
Figure 7a
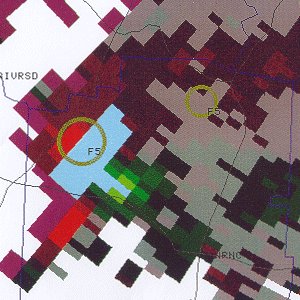
Figure 7b
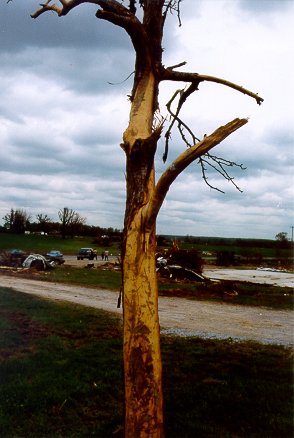
Figure 8
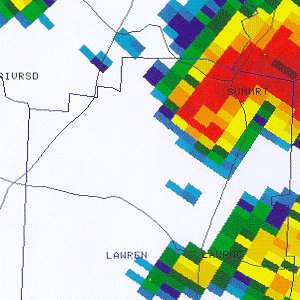
Figure 9a
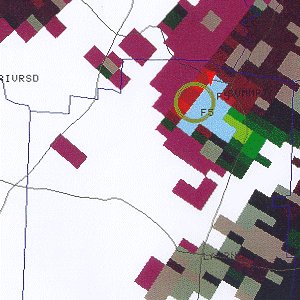
Figure 9b
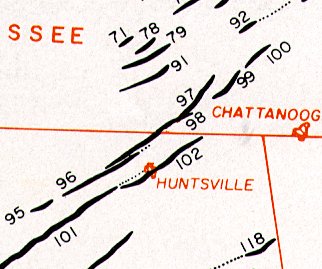
Figure 10

