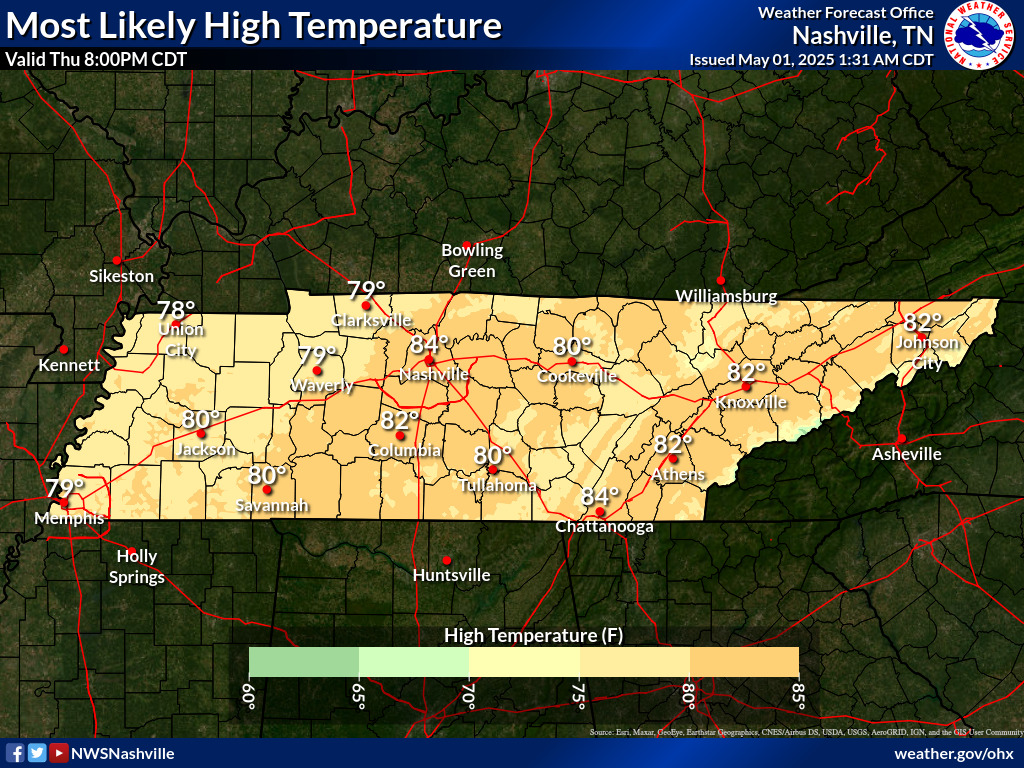
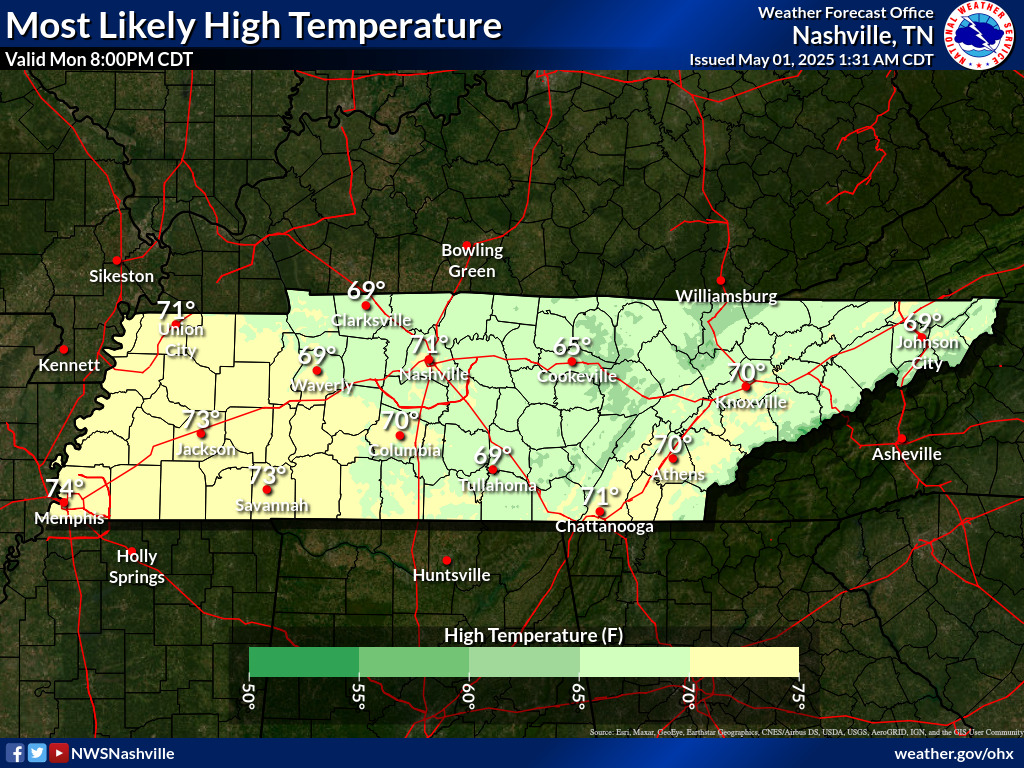
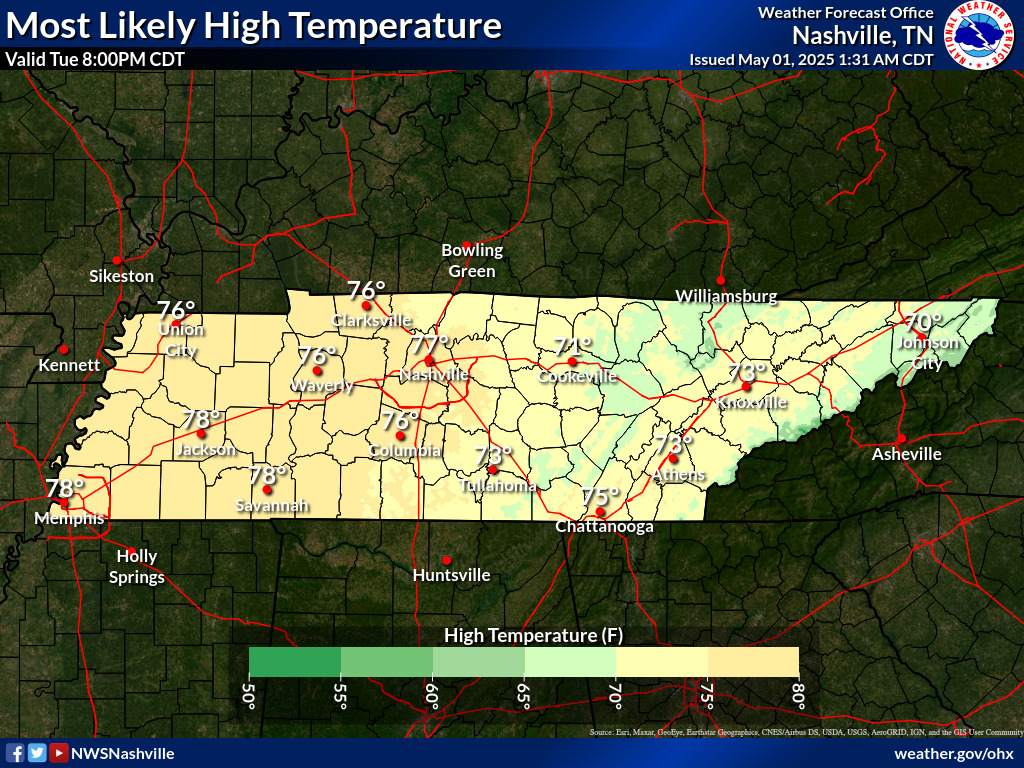
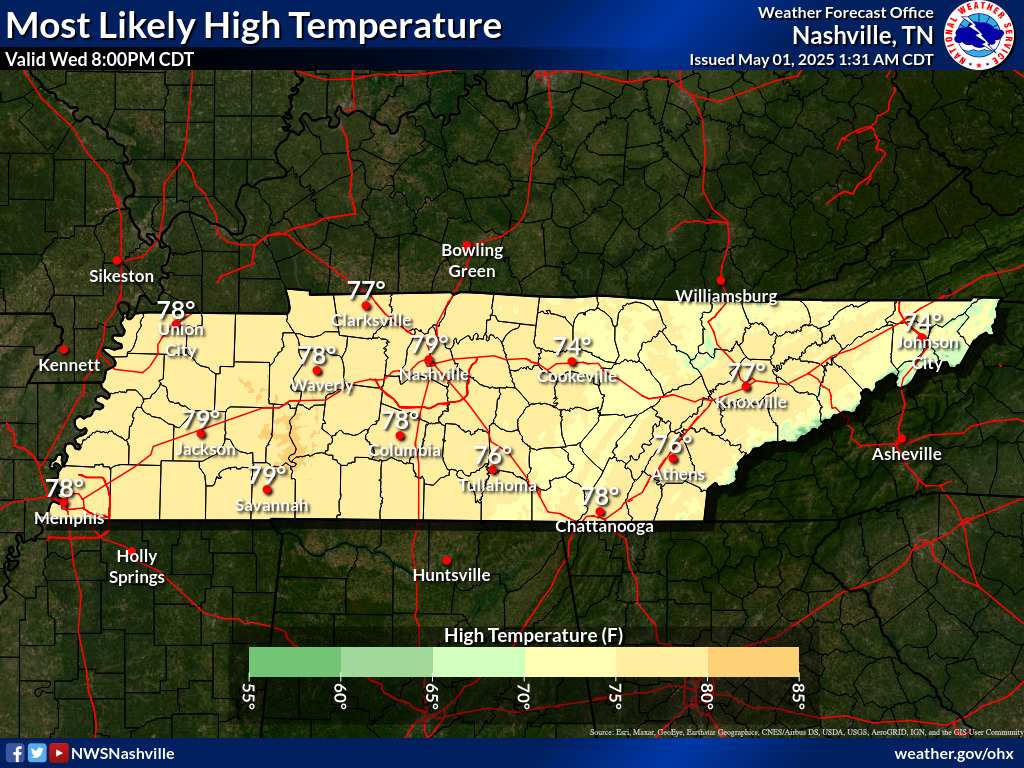
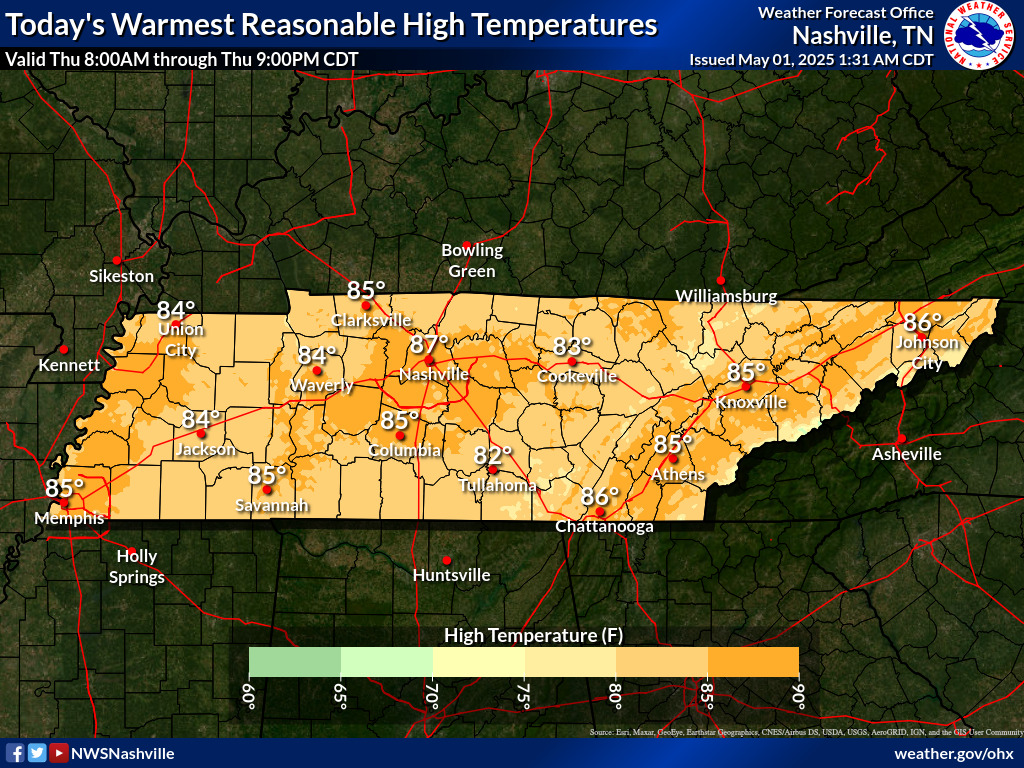
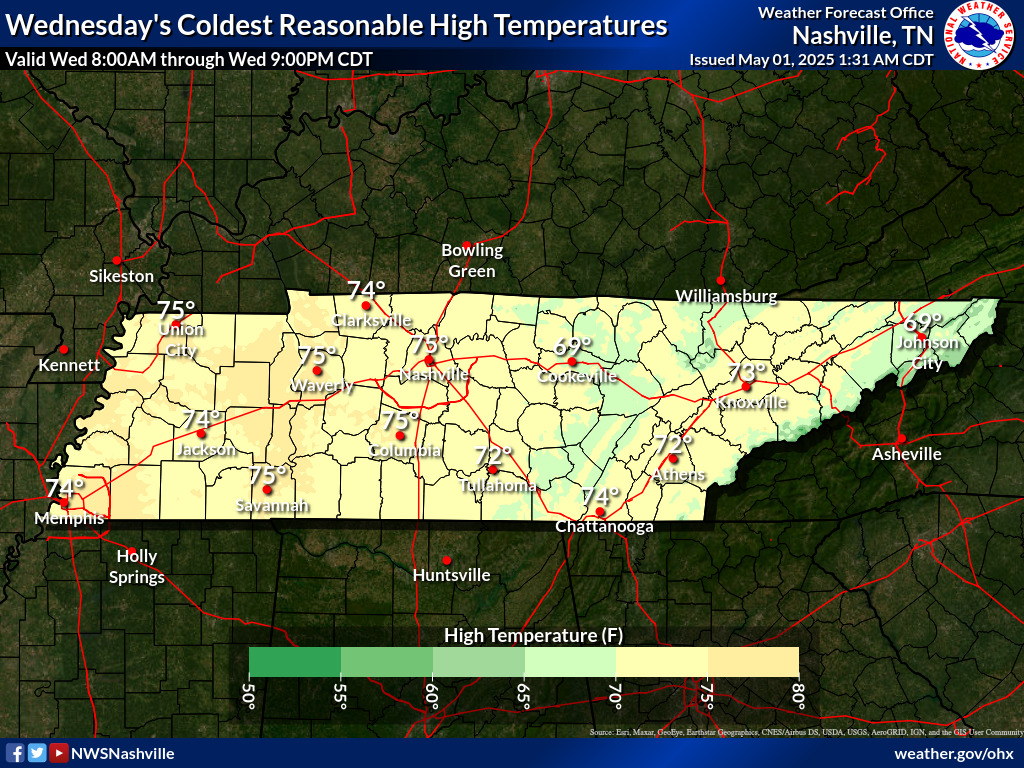
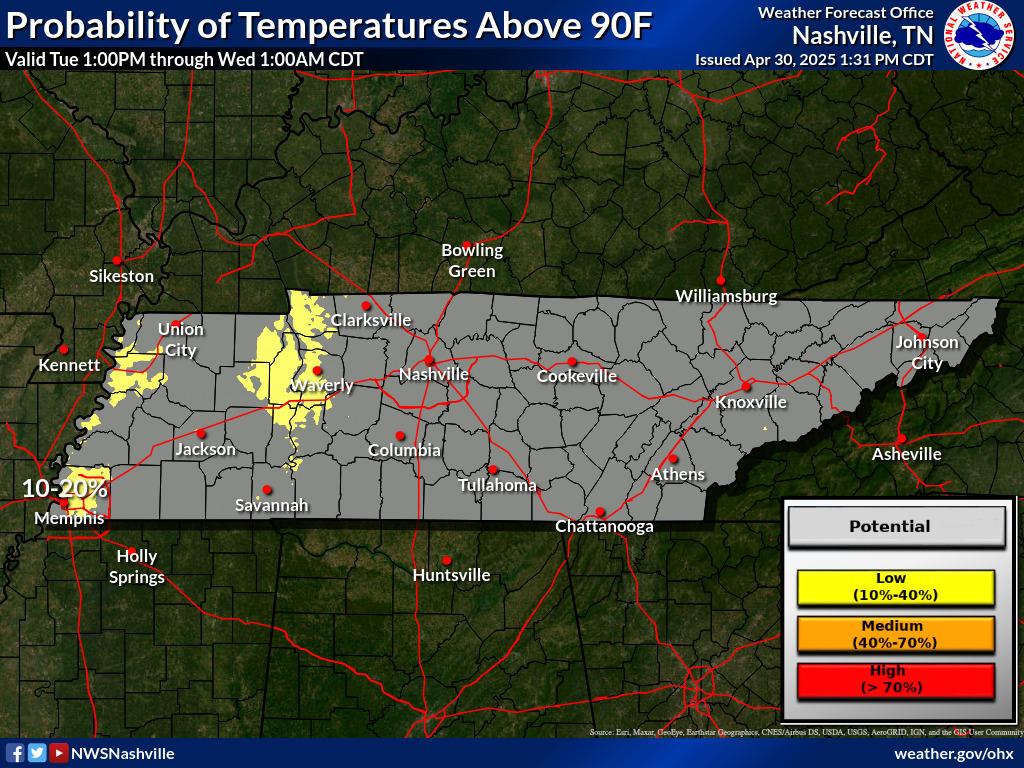
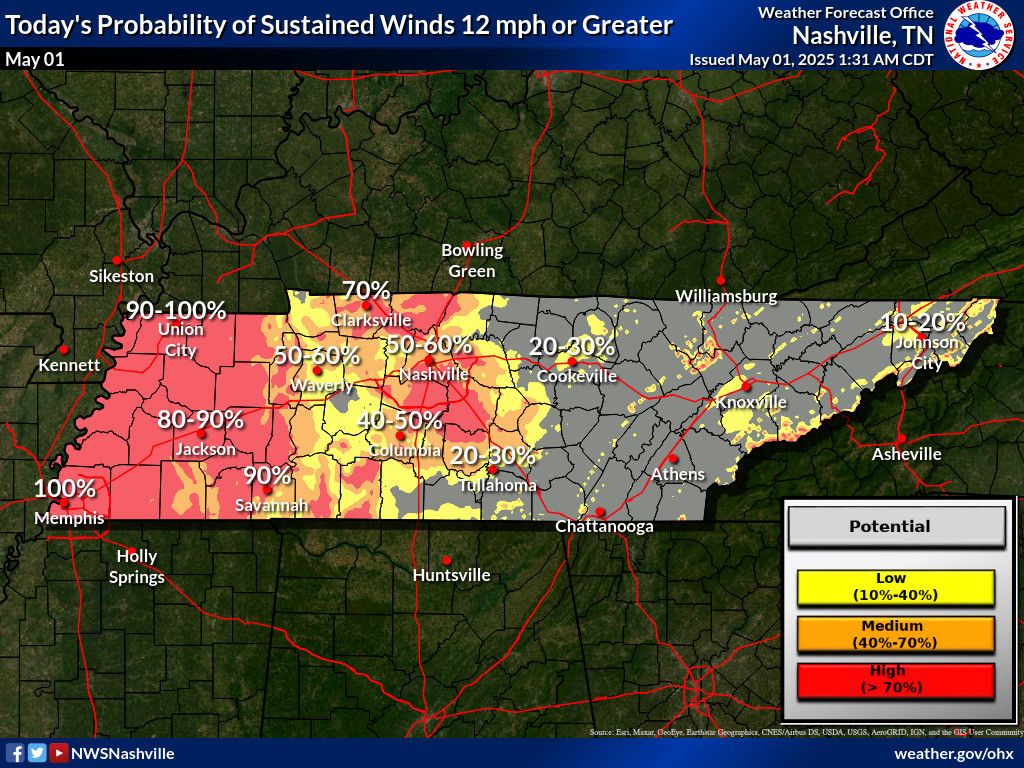
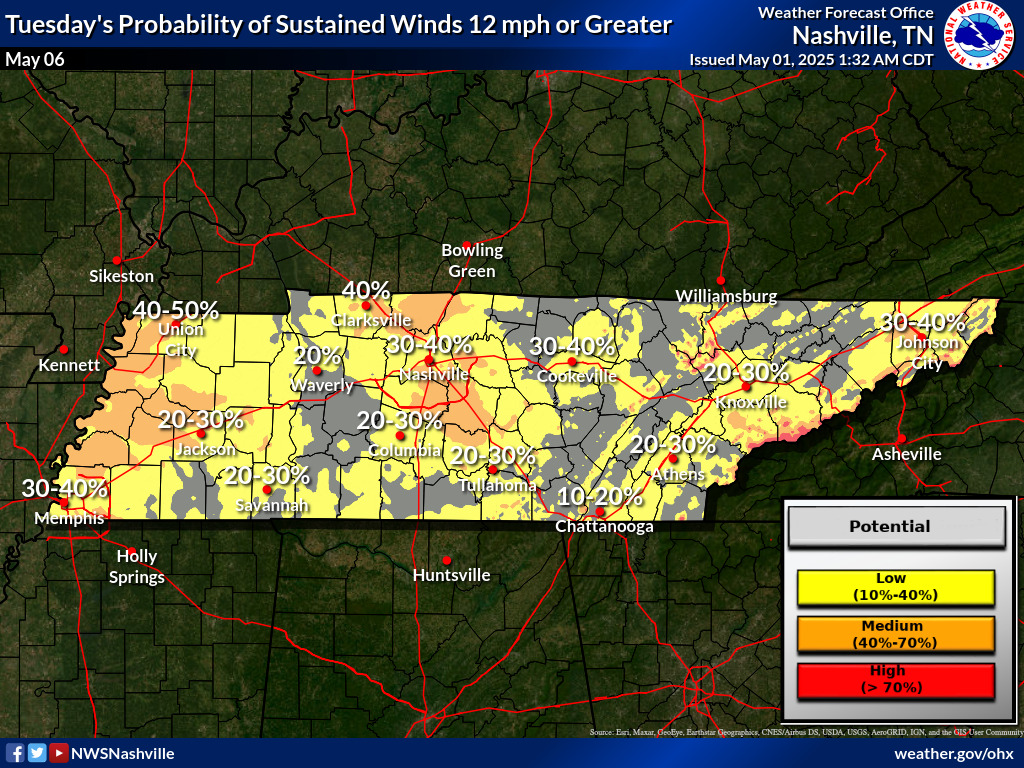
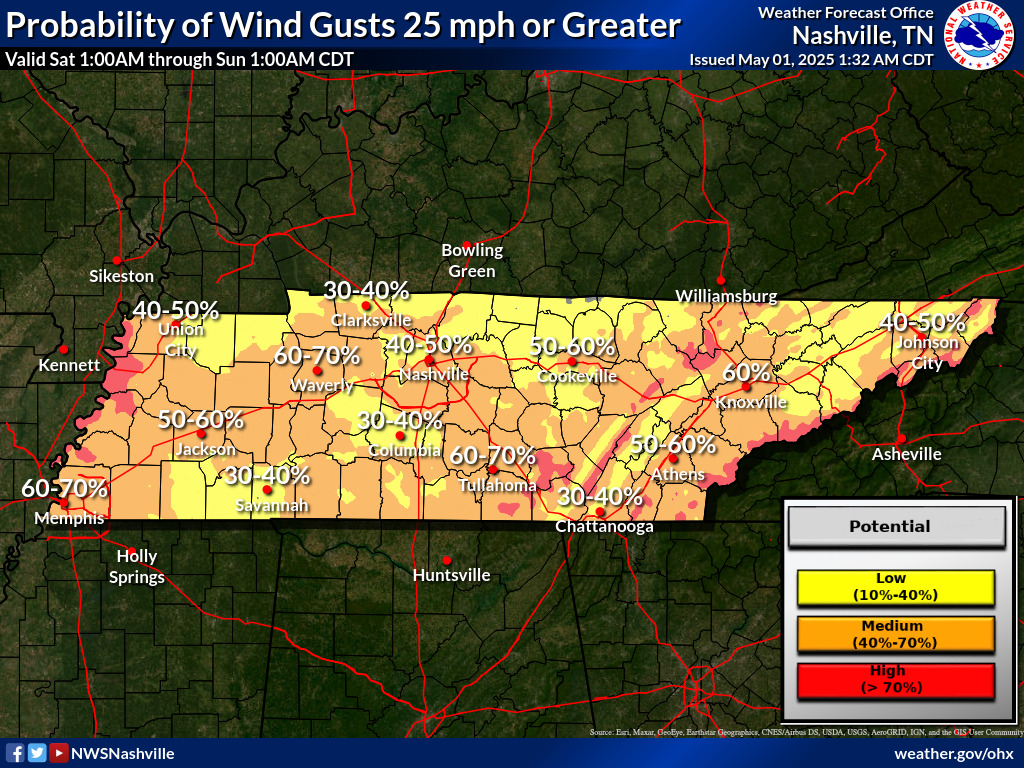
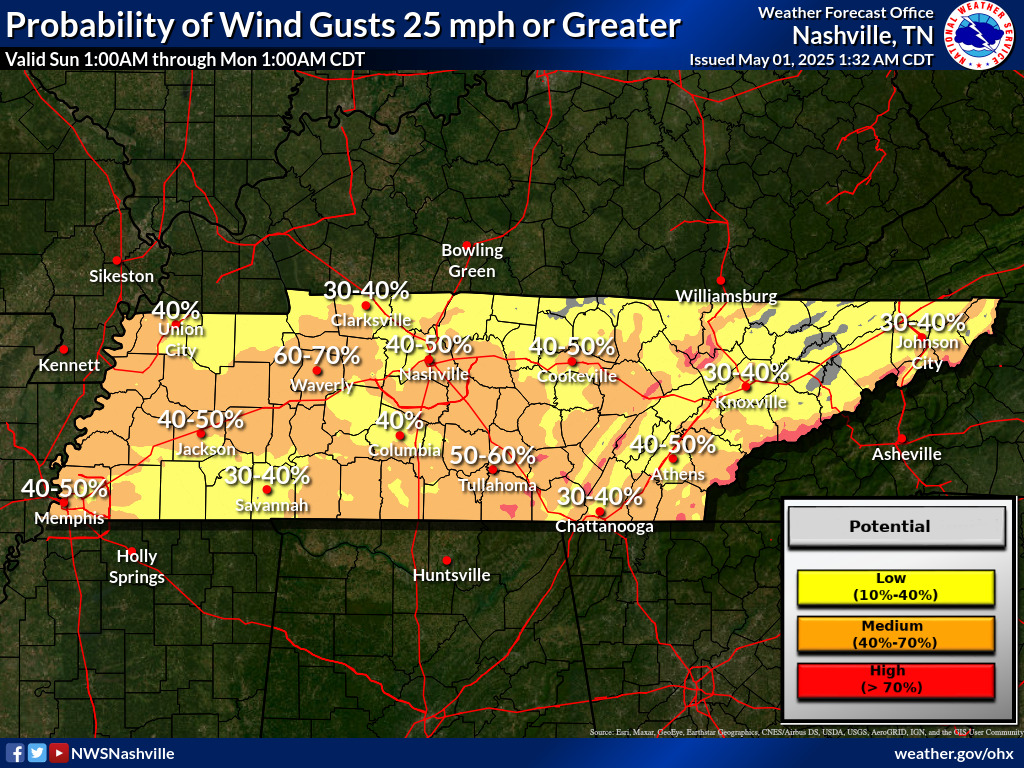
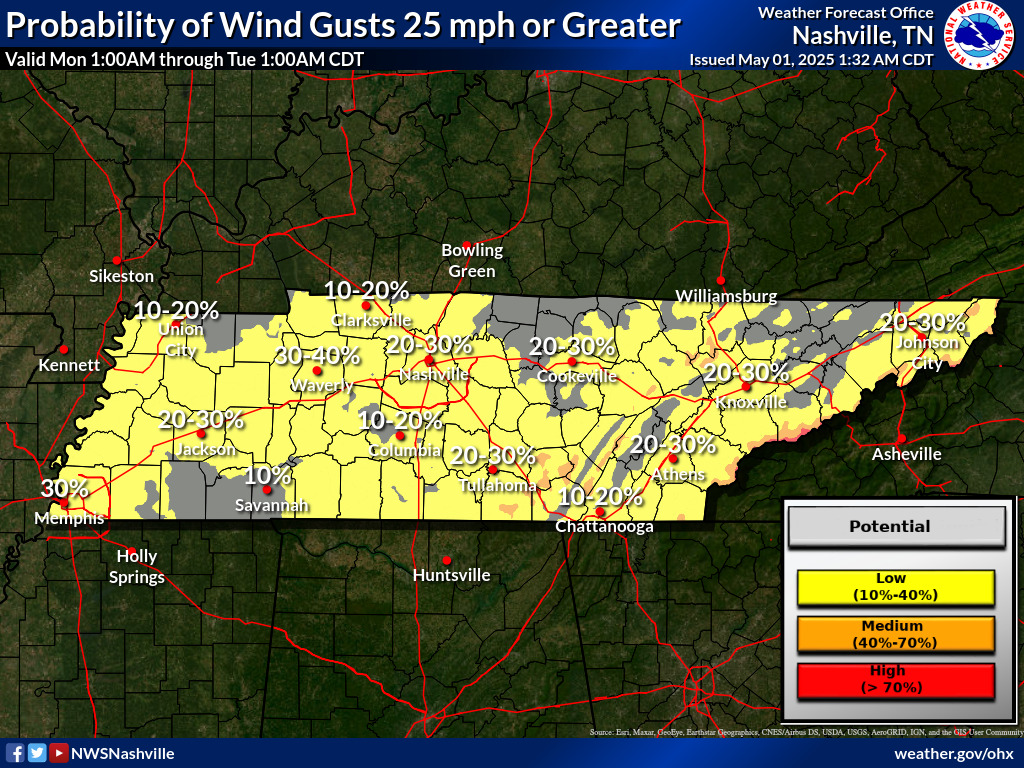
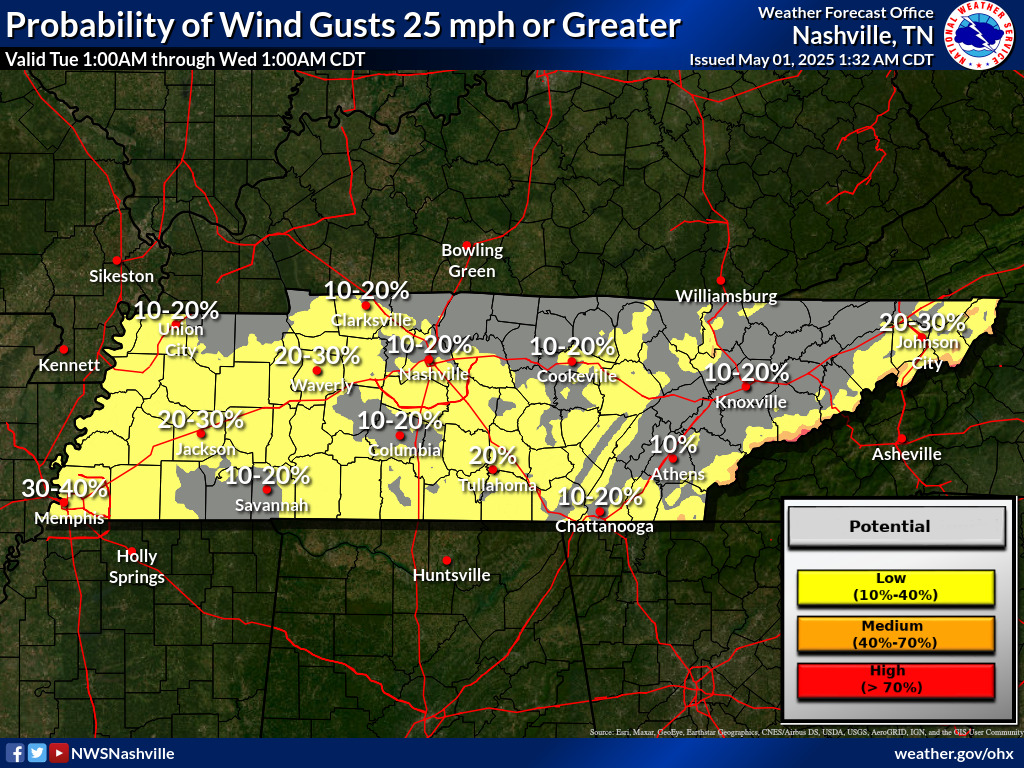
Welcome to the NWS Nashville Probabilistic Decision Support Services Page. Information contained here is intended to show a range of weather possibilities that the area could experience over the next 7 days for certain weather variables (i.e. temperature, precipitation, etc.). Graphics shown on this page are the official forecast as well as graphics generated/derived from the National Weather Service (NWS) National Blend of Models (NBM) version 4.1.
The NWS NBM was implemented nationally to provide a consistent suite of calibrated forecast guidance based on a blend of both NWS and non-NWS model output. The NBM serves as an initial starting point of reference to help forecasters deliver the most consistent and accurate weather forecasts and warnings to the Nation.
Graphics on this page are generally updated twice per day at 4:00 AM and 4:00 PM.

