Last Updated: 6/30/2026. This page is updated when new information is received and reviewed for completeness. Statistics and graphics courtesy of John Jensenius (National Lightning Safety Council). This data is preliminary and does not necessarily represent all fatalities to date.
| No. | Date | Day | ST | City/County | Age | Sex | Location | Activity |
|---|---|---|---|---|---|---|---|---|
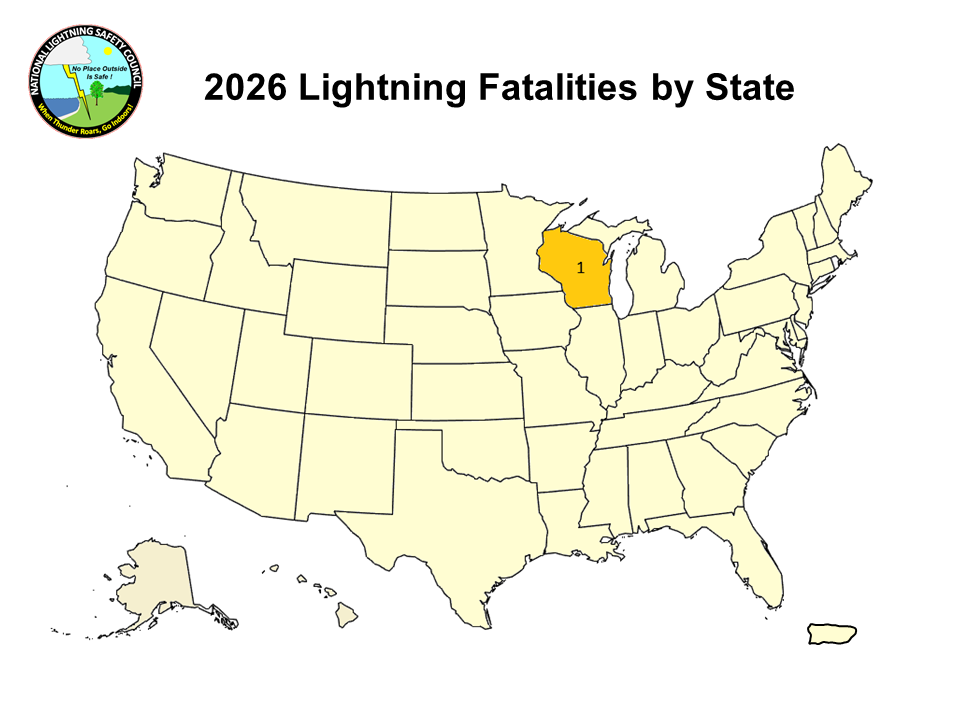
| 1 | 4-15-2026 | Wednesday | WI | Pewaukee | 41 | M | Gas station parking lot | Walking to vehicle |
| 2 | 5-31-2026 | Sunday | FL | Santa Rosa County | 18 | M | River | Kayaking |
| 3 | 7-03-2026 | Friday | FL | Fort Myers Beach | 51 | M | Beach | In water |
| 4 | 7-03-2026 | Friday | IL | Serena | 7 | F | Backyard | Unknown |
(Direct Fatalities Only)
| State | Gender | Age* | Day Of Week* | By Month | ||||||||||||||||
|---|---|---|---|---|---|---|---|---|---|---|---|---|---|---|---|---|---|---|---|---|
| WI | 1 | M | 3 (75%) | 0-9 | 1 (25%) | Sun | 1 (25%) | 26 | 25 | 24 | 23 | 22 | 21 | 20 | 19 | 18 | 17 | 16 |
10 Yr Avg
|
|
| FL | 2 | F | 1 (25%) | 10-19 | 1 (25%) | Mon | 0 (00%) | Jan | 0 | 0 |
0
|
0
|
0 |
0
|
0
|
0
|
0
|
0
|
0
|
0
|
| IL | 1 | 20-29 | 0 (00%) | Tue | 0 (00%) | Feb | 0 | 0 |
0
|
0
|
0 |
0
|
0
|
0
|
1
|
0
|
0
|
0
|
||
| 30-39 | 0 (00%) | Wed | 1 (25%) | Mar | 0 | 0 | 1 | 0 |
0
|
0
|
0
|
0
|
0
|
0
|
2
|
0
|
||||
| 40-49 | 1 (25%) | Thu | 0 (00%) | Apr | 1 | 2 | 0 | 3 |
0
|
0
|
0
|
0
|
1
|
0
|
4
|
1
|
||||
| 50-59 | 1 (25%) | Fri | 2 (50%) | May | 1 | 0 | 3 | 3 |
0
|
0
|
4
|
1
|
2
|
2
|
1
|
2
|
||||
| 60-69 | 0 (00%) | Sat | 0 (00%) | Jun | 0 | 7 | 4 | 1 | 2 |
2
|
2
|
7
|
5
|
2
|
4
|
4
|
||||
| 70-79 | 0 (00%) | Jul | 2 | 5 | 3 | 1 | 7 |
4
|
8
|
6
|
7
|
7
|
12
|
6
|
||||||
| 80-89 | 0 (00%) | Aug | - | 1 | 2 | 4 | 7 |
4
|
2
|
5
|
2
|
3
|
13
|
4
|
||||||
| Sep | - | 5 | 1 | 1 | 4 |
1
|
1
|
3
|
2
|
2
|
3
|
2
|
||||||||
| Oct | - | 1 | 0 | 0 | 0 |
0
|
0
|
0
|
1
|
0
|
0
|
0
|
||||||||
| Nov | - | 0 | 0 |
0
|
0 |
0
|
0
|
0
|
0
|
0
|
0
|
0
|
||||||||
| Dec | - | 0 |
0
|
0 |
0
|
0
|
0
|
0
|
0
|
0
|
0
|
0
|
||||||||
| Year | 4 | 21 | 14 | 14 | 20 |
11
|
17
|
22
|
21
|
16
|
40
|
20**
|
||||||||
| *Due to rounding, percentages may not add up to 100 percent. | ** Note: Data are considered preliminary. Refer to Storm Data for official data. | |||||||||||||||||||
|
Note: Monthly averages are based on a 10-year average from 2016 to 2025. Due to rounding, the sum of the monthly averages may not equal the yearly average. |
||||||||||||||||||||

