| No. |
Date |
Day |
ST |
City/Couty |
Age |
Sex |
Location |
Activity |
Victim |
| 1 |
5/3 |
Fri |
TX |
San Angelo |
48 |
M |
State Park |
Camping |
Robert Klemme |
| 2 |
6/6 |
Thu |
TX |
San Antonio |
21 |
M |
Rooftop |
Unloading shingles |
Joshua Favor |
| 3 |
6/9 |
Sun |
FL |
Volusia County |
45 |
M |
Highway |
Riding Motorcycle |
Benjamin Austin Lee |
| 4 |
6/13 |
Thu |
PA |
Westmoreland County |
18 |
M |
At park, on island in lake |
Fishing |
Breden A. McGowan |
| 5 |
6/13 |
Thu |
PA |
Westmoreland County |
18 |
F |
At park, on island in lake |
Fishing |
Kaitlyn E. Rosesteel |
| 6 |
6/19 |
Sun |
AL |
Africatown |
59 |
M |
On ladder |
Working on roof |
Charles Jackson |
| 7 |
6/23 |
Sun |
KY |
Murray |
41 |
F |
Parking Lot |
Walking |
Jamie Elder |
| 8 |
6/27 |
Thu |
TX |
Spring |
55 |
M |
Landscaping |
|
|
| 9 |
7/4 |
Thu |
SC |
Lawshee Plantation |
44 |
M |
Beach of river |
Family get-together |
Ryan Gamble |
| 10 |
7/14 |
Sun |
CO |
Boulder County |
36 |
M |
Hiking Trail |
Hiking |
Peter Jornroth |
| 11 |
7/20 |
Sat |
IN |
Bremen |
65 |
M |
Lake |
Boating |
Richard Eberhardt |
| 12 |
7/21 |
Sun |
FL |
Clearwater Beach |
32 |
M |
Beach |
Beach Activities |
Garry Perks |
| 13 |
7/30 |
Tue |
FL |
Wellington |
20 |
F |
Rooftop |
Roof Repair |
Romelia Ramirez |
| 14 |
8/4 |
Sun |
ND |
Richardton |
32 |
M |
Hiking/Biking |
Trail Work |
Kyle Brierley |
| 15 |
8/15 |
Thu |
AL |
Gulf Shores |
28 |
M |
Neighborhood development |
Home construction |
Kristopher Herronen |
| 16 |
8/23 |
Fri |
NC |
Kitty Hawk |
23 |
M |
Beach |
Beach Activities |
Matthew Summerill |
| 17 |
8/30 |
Fri |
OH |
Spring Grove Village |
27 |
F |
In cemetery under tree |
Running |
Danielle Brosious |
| 18 |
8/30 |
Fri |
OH |
Spring Grove Village |
55 |
F |
In cemetery under tree |
Running |
Patricia Herlinger |
| 19 |
9/14 |
Sat |
VA |
Bath County |
12 |
M |
Under trees near house |
Playing |
Ian Hall |
| 20 |
9/28 |
Sat |
KS |
Montgomery County |
33 |
M |
State Park |
Running/Trail Race |
Thomas Stanley |
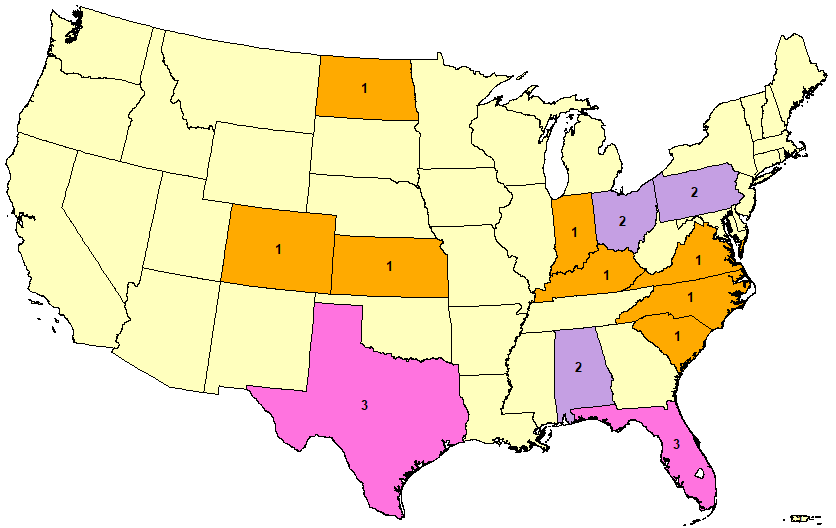
Lightning Fatalities 2019 by State
|
2019 Lightning Fatality Demographics
|
|
State
|
Gender
|
Age*
|
Day Of Week*
|
By Month
|
| AL |
2 |
F |
5 (25%) |
0-9 |
0 (0%) |
Sun |
6 (30%) |
|
2019 |
18 |
17 |
16 |
15 |
14 |
13 |
12 |
11 |
10 |
09
|
10 Yr Avg
|
| CO |
1 |
M |
15 (75%) |
10-19 |
3 (15%) |
Mon |
0 (0%) |
Jan |
0 |
0
|
0 |
0
|
0
|
0
|
0
|
0
|
0
|
0
|
0
|
0
|
| FL |
3 |
|
20-29 |
5 (25%) |
Tue |
1 (5%) |
Feb |
0 |
1 |
0 |
0
|
0
|
0
|
0
|
0
|
0
|
0
|
0
|
0
|
| IN |
1 |
|
30-39 |
4 (20%) |
Wed |
0 (0%) |
Mar |
0 |
0 |
0 |
2
|
0
|
0
|
0
|
1
|
0
|
0
|
1
|
0
|
| KS |
1 |
|
40-49 |
4 (20%) |
Thu |
6 (30%) |
Apr |
0 |
1 |
0 |
4
|
2
|
0
|
1
|
2
|
0
|
0
|
1
|
1
|
| KY |
1 |
|
50-59 |
3 (15%) |
Fri |
4 (20%) |
May |
1 |
2 |
2 |
1
|
4
|
5
|
5
|
0
|
1
|
4
|
2
|
3
|
| NC |
1 |
|
60-69 |
1 (5%) |
Sat |
3 (15%) |
Jun |
7 |
5 |
2 |
4
|
11
|
3
|
2
|
3
|
5
|
7
|
12
|
5
|
| ND |
1 |
|
70-79 |
0 (0%) |
|
|
Jul |
5 |
7 |
7 |
12
|
5
|
9
|
6
|
13
|
9
|
11
|
11
|
9
|
| OH |
2 |
|
80-89 |
0 (0%) |
|
|
Aug |
5 |
2 |
3 |
13
|
4
|
5
|
4
|
7
|
6
|
4
|
3
|
5
|
| PA |
2 |
|
|
|
|
|
Sep |
2 |
2 |
2 |
3
|
2
|
3
|
5
|
2
|
4
|
2
|
4
|
3
|
| SC |
1 |
|
|
|
|
|
Oct |
0 |
1
|
0 |
0
|
0
|
1
|
0
|
1
|
1
|
1
|
1
|
1
|
| TX |
3 |
|
|
|
|
|
Nov |
0 |
0
|
0 |
0
|
0
|
0
|
0
|
0
|
0
|
0
|
0
|
0
|
| VA |
1 |
|
|
|
|
|
Dec |
0 |
0
|
0 |
1
|
0
|
0
|
0
|
0
|
0
|
0
|
0
|
0
|
| |
|
|
|
|
|
|
Year |
20 |
21 |
16 |
40
|
28
|
26
|
23
|
29
|
26
|
29
|
35
|
27**
|
| *Due to rounding, percentages may not add up to 100 percent. |
** Note: Data are considered preliminary. Refer to Storm Data at https://www.ncdc.noaa.gov/IPS/sd/sd.html for official data. |
| Note: Monthly averages are based on a 10-year average from 2009 to 2018. Due to rounding, the sum of the monthly averages may not equal the yearly average. |
Fatality statistics for past years
|

