| No. | Date | Day | ST | City/County | Age | Sex | Location | Activity |
| 1 | 5/5 | Tue | SC | Chester County | 32 | M | Home | Getting out of car |
| 2 | 5/27 | Wed | FL | Port St. Lucie | 41 | M | Residential area | Work: lawn care |
| 3 | 5/27 | Wed | TX | China | 51 | M | Subdivision | Construction |
| 4 | 5/28 | Thu | FL | Middleburg | 35 | M | Rooftop | Work, roofing |
| 5 | 6/6 | Sat | CO | La Plata County | 65 | F | Subdivision, near tree | Walking |
| 6 | 6/28 | Sun | TX | Royce City (Dallas County) | 61 | F | Open area by metal fence | Weed Wacking |
| 7 | 7/2 | Thu | TX | Eagle Ford | 16 | M | In yard, under tree | Moving hammock |
| 8 | 7/3 | Fri | GA | Moultrie | 9 | F | Wooden shelter, near tree | Walking |
| 9 | 7/6 | Mon | PA | Bradford County | 43 | M | Open field under deer blind | Working on deer blind |
| 10 | 7/6 | Mon | PA | Bradford County | 34 | M | Open field under deer blind | Working on deer blind |
| 11 | 7/8 | Wed | IN | Evansville | 34 | M | Warehouse rooftop | Roofing |
| 12 | 7/19 | Sun | MO | St. Louis | 28 | M | Under tree | Had been playing soccer |
| 13 | 7/25 | Sat | CA | Sierra County | 47 | M | Lake | Jetskiing |
| 14 | 7/31 | Fri | MT | Glendive | 65 | F | Walking on road under a tree | Walking |
| 15 | 8/5 | Wed | NC | Wilmington | 77 | M | Yard | Cutting up tree limbs |
| 16 | 8/5 | Wed | NC | Wilmington | 42 | M | Yard | Cutting up tree limbs |
| 17 | 9/10 | Thu | FL | Apopka | 58 | M | Yard, next to tree | Grilling |
(Direct Fatalities Only)
|
State
|
Gender
|
Age*
|
Day Of Week*
|
By Month
|
||||||||||||||||
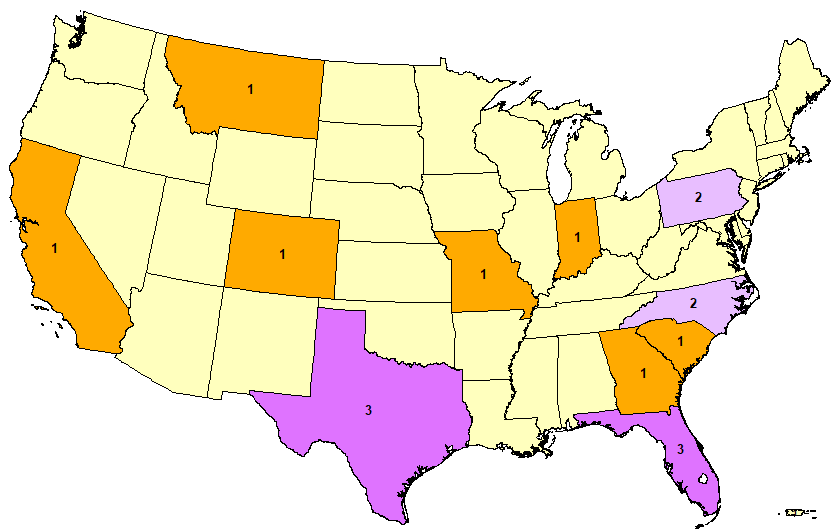
| CA | 1 | F | 4 (24%) | 0-9 | 1 (6%) | Sun | 2 (12%) | 2020 | 19 | 18 | 17 | 16 | 15 | 14 | 13 | 12 | 11 | 10 |
10 Yr Avg
|
|
| CO | 1 | M | 13 (76%) | 10-19 | 1 (6%) | Mon | 2 (12%) | Jan | 0 | 0 |
0
|
0 |
0
|
0
|
0
|
0
|
0
|
0
|
0
|
0
|
| FL | 3 | 20-29 | 1 (6%) | Tue | 1 (6%) | Feb | 0 | 0 | 1 | 0 |
0
|
0
|
0
|
0
|
0
|
0
|
0
|
0
|
||
| GA | 1 | 30-39 | 4 (24%) | Wed | 5 (29%) | Mar | 0 | 0 | 0 | 0 |
2
|
0
|
0
|
0
|
1
|
0
|
0
|
0
|
||
| IN | 1 | 40-49 | 4 (24%) | Thu | 2 (12%) | Apr | 0 | 0 | 1 | 0 |
4
|
2
|
0
|
1
|
2
|
0
|
0
|
1
|
||
| MO | 1 | 50-59 | 2 (12%) | Fri | 2 (12%) | May | 4 | 1 | 2 | 2 |
1
|
4
|
5
|
5
|
0
|
1
|
4
|
3
|
||
| MT | 1 | 60-69 | 3 (18%) | Sat | 2 (12%) | Jun | 2 | 7 | 5 | 2 |
4
|
11
|
3
|
2
|
3
|
5
|
7
|
5
|
||
| NC | 2 | 70-79 | 1 (6%) | Jul | 8 | 5 | 7 | 7 |
12
|
5
|
9
|
6
|
13
|
9
|
11
|
8
|
||||
| PA | 2 | 80-89 | 0 (0%) | Aug | 2 | 5 | 2 | 3 |
13
|
4
|
5
|
4
|
7
|
6
|
4
|
5
|
||||
| SC | 1 | Sep | 1 | 2 | 2 | 2 |
3
|
2
|
3
|
5
|
2
|
4
|
2
|
3
|
||||||
| TX | 3 | Oct | 0 | 0 | 1 | 0 |
0
|
0
|
1
|
0
|
1
|
1
|
1
|
1
|
||||||
| Nov | 0 | 0 |
0
|
0 |
0
|
0
|
0
|
0
|
0
|
0
|
0
|
0
|
||||||||
| Dec | 0 | 0 |
0
|
0 |
1
|
0
|
0
|
0
|
0
|
0
|
0
|
0
|
||||||||
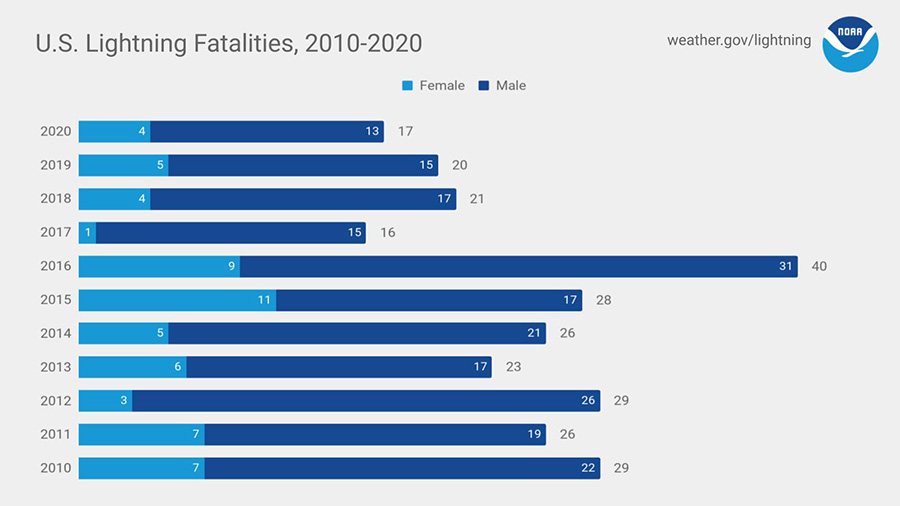
| Year | 17 | 20 | 21 | 16 |
40
|
28
|
26
|
23
|
29
|
26
|
29
|
26**
|
||||||||
| *Due to rounding, percentages may not add up to 100 percent. | ** Note: Data are considered preliminary. Refer to Storm Data for official data. | |||||||||||||||||||
|
Note: Monthly averages are based on a 10-year average from 2010 to 2019. Due to rounding, the sum of the monthly averages may not equal the yearly average. |
||||||||||||||||||||