Last Updated: 10/4/2023. This page is updated when new information is received and reviewed for completeness. Statistics and graphics courtesy of John Jensenius (National Lightning Safety Council). This data is preliminary and does not necessarily represent all fatalities to date.
| No. | Date | Day | ST | City/County | Age | Sex | Location | Activity |
| 1 | 4/6 | Thu | VA | Louisa County | 73 | M | Lake | Boating |
| 2 | 4/15 | Sat | PA | Chester County | 48 | M | Roadway | Driving car |
| 3 | 4/16 | Sun | FL | Brevard County | 39 | M | On water | Boating |
| 4 | 5/15 | Mon | TX | Valley Mills | 34 | M | Driveway | Walking home from bus stop |
| 5 | 5/15 | Mon | TX | Valley Mills | 6 | M | Driveway | Walking home from bus stop |
| 6 | 5/22 | Mon | FL | Deltona | 24 | M | Rooftop | Construction |
| 7 | 6/21 | Wed | NE | Garden City | 24 | M | Open area | On horse checking on cattle |
| 8 | 7/24 | Mon | NY | Lincoln | 39 | M | Under tree | Roofing |
| 9 | 8/5 | Mon | OK | Mayes Cnty | teen | F | Creek | Swimming |
| 10 | 8/7 | Mon | AL | Florence | 28 | M | Parking lot | Working |
| 11 | 8/23 | Wed | FL | Clearwater | 73 | F | Sidewalk | Walking |
| 12 | 8/25 | Fri | KY | Sherburne | 39 | M | Sidewalk | Walking |
| 13 | 9/12 | Tue | GA | Acworth | 29 | M | Golf course | Golfing |
| 14 | 9/26 | Tue | FL | Putnam Cnty | 16 | F | Under tree | Hunting |
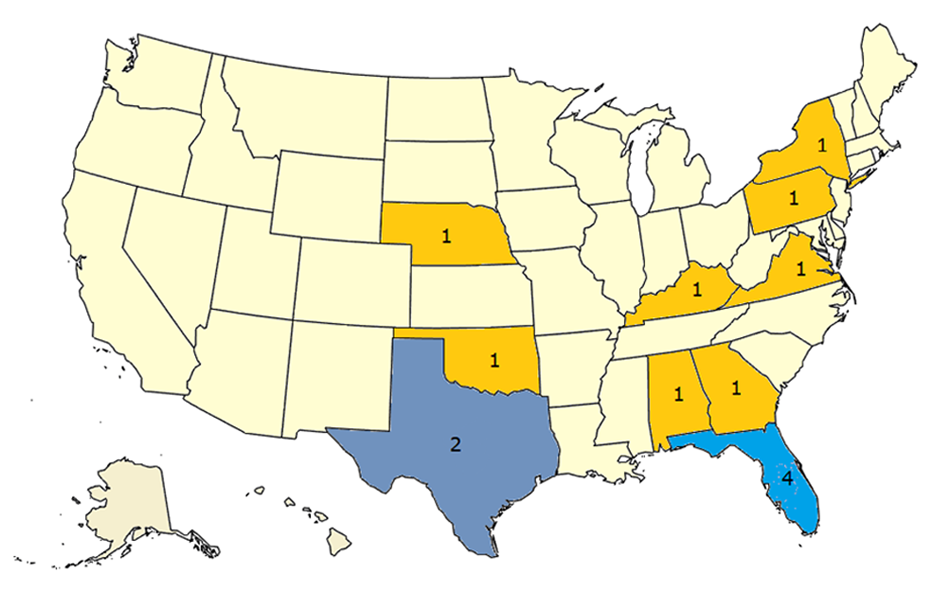
Lightning Fatalities 2023 by State
(Direct Fatalities Only)
|
State
|
Gender
|
Age*
|
Day Of Week*
|
By Month
|
||||||||||||||||
| FL | 4 | M | 11 (79%) | 0-9 | 1 (7%) | Sun | 1 (7%) | 23 | 22 | 21 | 20 | 19 | 18 | 17 | 16 | 15 | 14 | 13 |
10 Yr Avg
|
|
| PA | 1 | F | 3 (21%) | 10-19 | 2 (14%) | Mon | 5 (38%) | Jan | 0 | 0 |
0
|
0
|
0 |
0
|
0
|
0
|
0
|
0
|
0
|
0
|
| TX | 2 | 20-29 | 4 (29%) | Tue | 2 (14%) | Feb | 0 | 0 |
0
|
0
|
0 |
1
|
0
|
0
|
0
|
0
|
0
|
0
|
||
| NE | 1 | 30-39 | 4 (29%) | Wed | 2 (15%) | Mar | 0 | 0 | 0 | 0 |
0
|
0
|
0
|
2
|
0
|
1
|
0
|
0
|
||
| NY | 1 | 40-49 | 1 (7%) | Thu | 1(7%) | Apr | 3 | 0 | 0 | 0 |
0
|
3
|
0
|
4
|
2
|
0
|
1
|
1
|
||
| OK | 1 | 50-59 | 0 (00%) | Fri | 1 (7%) | May | 3 | 0 | 0 | 4 |
1
|
2
|
2
|
1
|
4
|
5
|
5
|
2
|
||
| AL | 1 | 60-69 | 0 (00%) | Sat | 2 (14%) | Jun | 1 | 2 | 2 | 2 | 7 |
5
|
2
|
4
|
11
|
3
|
2
|
4
|
||
| KY | 1 | 70-79 | 2 (14%) | Jul | 1 | 7 | 4 | 8 | 5 |
7
|
7
|
12
|
5
|
9
|
6
|
8
|
||||
| VA | 1 | 80-89 | 0 (00%) | Aug | 4 | 6 | 4 | 2 | 5 |
2
|
3
|
13
|
4
|
5
|
4
|
5
|
||||
| GA | 1 | Sep | 2 | 4 | 1 | 1 | 3 |
2
|
2
|
3
|
2
|
3
|
5
|
2
|
||||||
| Oct | - | 0 | 0 | 0 | 0 |
1
|
0
|
0
|
0
|
1
|
0
|
0
|
||||||||
| Nov | - | 0 | 0 |
0
|
0 |
0
|
0
|
0
|
0
|
0
|
0
|
0
|
||||||||
| Dec | - | 0 |
0
|
0 |
0
|
0
|
0
|
1
|
0
|
0
|
0
|
0
|
||||||||
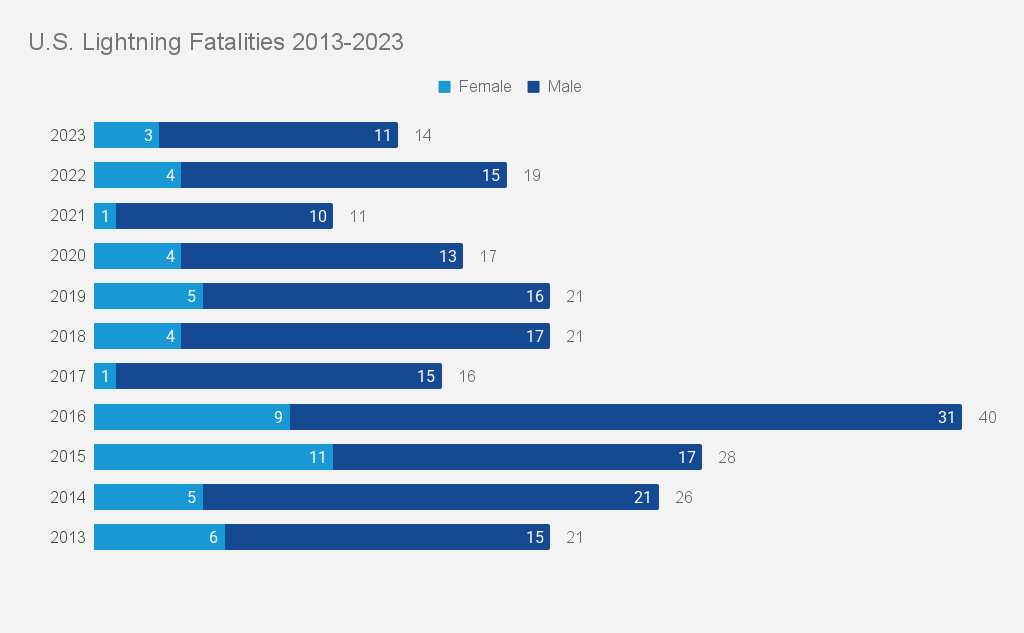
| Year | 14 | 19 | 11 | 17 | 21 |
21
|
16
|
40
|
28
|
26
|
23
|
22**
|
||||||||
| *Due to rounding, percentages may not add up to 100 percent. | ** Note: Data are considered preliminary. Refer to Storm Data for official data. | |||||||||||||||||||
|
Note: Monthly averages are based on a 10-year average from 2013 to 2023. Due to rounding, the sum of the monthly averages may not equal the yearly average. |
||||||||||||||||||||
Source: National Lightning Safety Council

