Last Updated: 09/24/2024. This page is updated when new information is received and reviewed for completeness. Statistics and graphics courtesy of John Jensenius (National Lightning Safety Council). This data is preliminary and does not necessarily represent all fatalities to date.
| No. | Date | Day | ST | City/County | Age | Sex | Location | Activity |
| 1 | 3/3/ | Sunday | FL | Tallahassee | 73 | M | Field in park | Walking |
| 2 | 5/3/ | Friday | TX | Montgomery County | 39 | M | Outside home | Placing tarp over vehicle |
| 3 | 5/25 | Saturday | CO | Jackson County | 51 | M | Open field | Branding feeding cattle |
| 4 | 6/23 | Sunday | NJ | Seaside Park | 59 | M | Beach | Warning children of storm |
| 5 | 6/27 | Thursday | TX | Bryan | 7 | F | Outside home | Family gathering |
| 6 | 6/28 | Friday | MO | Holden | 53 | M | Parking lot | At rodeo |
| 7 | 6/30 | Sunday | FL | Davie | 19 | M | Under tree in park | Running |
| 8 | 7/20 | Saturday | AL | Smiths Station | 67 | M | Flea market | At flea market |
| 9 | 7/21 | Sunday | FL | Quincy | 32 | M | Roof | Roofing |
| 10 | 7/25 | Thursday | FL | St. Petersburg | 16 | F | Under tree | Hanging out with friends |
| 11 | 8/18 | Sunday | UT | Bear River | 24 | M | River | Fishing |
| 12 | 8/31 | Saturday | FL | Naples | 24 | M | Beach | Swimming |
| 13 | 9/18 | Wednesday | FL | Pembroke Pines | 16 | M | Neighborhood | Riding bike |
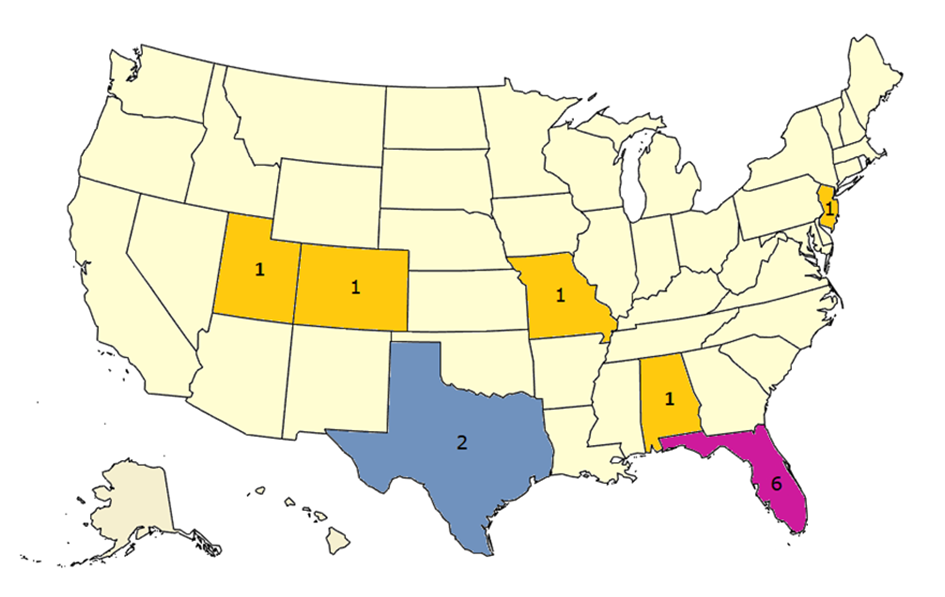
Lightning Fatalities 2024 by State
(Direct Fatalities Only)
| State | Gender | Age* | Day Of Week* | By Month | ||||||||||||||||
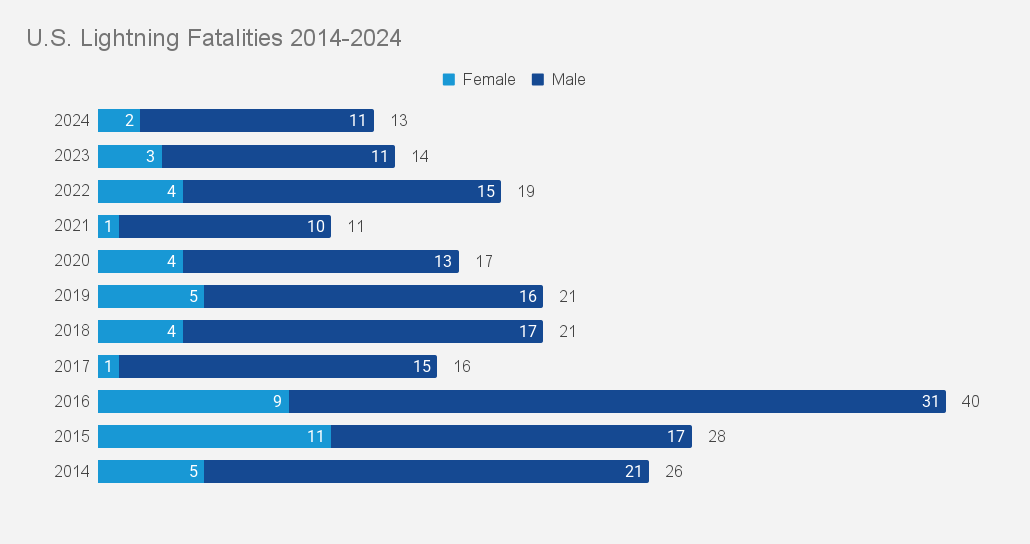
| CO | 1 | M | 11(85%) | 0-10 | 1(08%) | Sun | 5 (38%) | 2024 | 2023 | 22 | 21 | 20 | 19 | 18 | 17 | 16 | 15 | 14 | 10-yr Average | |
| FL | 6 | F | 2(15%) | 10-19 | 3 (23%) | Mon | 0 (00%) | Jan | 0 | 0 | 0 | 0 | 0 | 0 | 0 | 0 | 0 | 0 | 0 | 0 |
| NJ | 1 | 20-29 | 2 (15%) | Tue | 0 (00%) | Feb | 0 | 0 | 0 | 0 | 0 | 0 | 1 | 0 | 0 | 0 | 0 | 0 | ||
| TX | 2 | 30-39 | 2 (15%) | Wed | 1 (08%) | Mar | 1 | 0 | 0 | 0 | 0 | 0 | 0 | 0 | 2 | 0 | 0 | 0 | ||
| MO | 1 | 40-49 | 0 (00%) | Thu | 2 (15%) | Apr | 0 | 3 | 0 | 0 | 0 | 0 | 1 | 0 | 4 | 2 | 0 | 1 | ||
| AL | 1 | 50-59 | 3 (23%) | Fri | 2 (15%) | May | 2 | 3 | 0 | 0 | 4 | 1 | 2 | 2 | 1 | 4 | 5 | 2 | ||
| UT | 1 | 60-69 | 1(08%) | Sat | 3(23%) | Jun | 4 | 1 | 2 | 2 | 2 | 7 | 5 | 2 | 4 | 11 | 3 | 4 | ||
| 70-79 | 1(08%) | Jul | 3 | 1 | 7 | 4 | 8 | 5 | 7 | 7 | 12 | 5 | 9 | 7 | ||||||
| 80-89 | 0 (00%) | Aug | 2 | 4 | 6 | 4 | 2 | 5 | 2 | 3 | 13 | 4 | 5 | 5 | ||||||
| Sep | 1 | 2 | 4 | 1 | 1 | 3 | 2 | 2 | 3 | 2 | 3 | 3 | ||||||||
| Oct | - | 0 | 0 | 0 | 0 | 0 | 1 | 0 | 0 | 0 | 1 | 0 | ||||||||
| Nov | - | 0 | 0 | 0 | 0 | 0 | 0 | 0 | 0 | 0 | 0 | 0 | ||||||||
| Dec | - | 0 | 0 | 0 | 0 | 0 | 0 | 0 | 1 | 0 | 0 | 0 | ||||||||
| YEAR | 13 | 14 | 19 | 11 | 17 | 21 | 21 | 16 | 40 | 28 | 26 | 22** | ||||||||
| *Due to rounding, percentages may not add up to 100 percent. | ** Note: Data are considered preliminary. Refer to Storm Data for official data. | |||||||||||||||||||
| Note: Monthly averages are based on a 10-year average from 2014 to 2023. Due to rounding, the sum of the monthly averages may not equal the yearly average. | ||||||||||||||||||||
Source: National Lightning Safety Council

