Last Updated: 7/2/2025. This page is updated when new information is received and reviewed for completeness. Statistics and graphics courtesy of John Jensenius (National Lightning Safety Council).
| No. | Date | Day | ST | City/County | Age | Sex | Location | Activity |
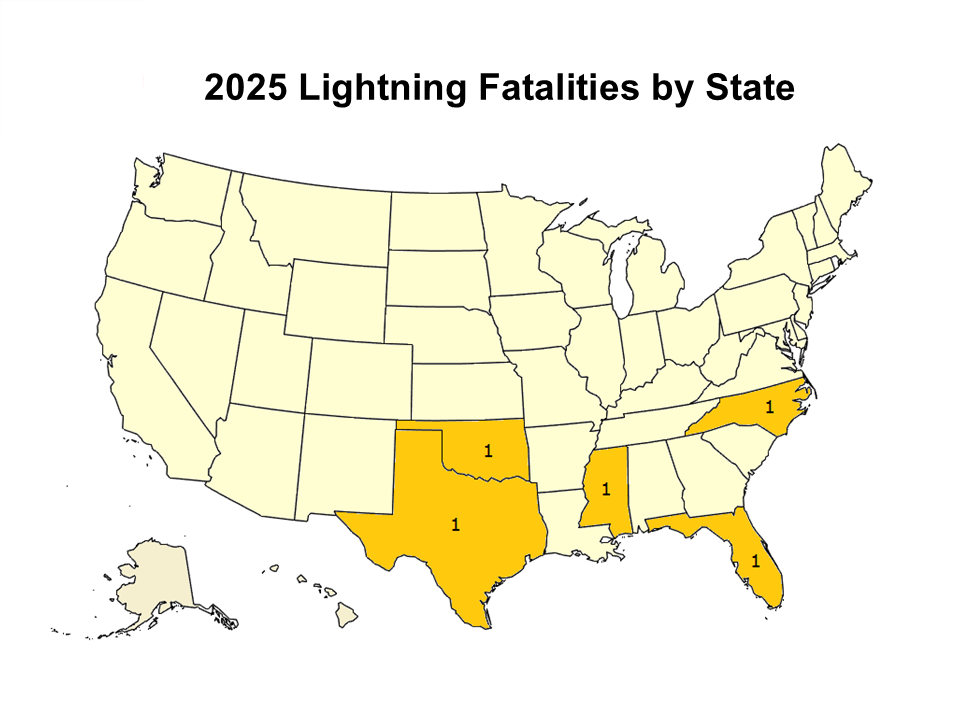
| 1 | 4/11 | Friday | NC | Goldsboro | 39 | M | River/creek | Fishing from boat |
| 2 | 4/22 | Tuesday | MS | Rankin Cnty | 68 | M | Reservoir | Fishing from boat |
| 3 | 6/8 | Sunday | TX | Gunter | 41 | M | Golf course | Golfing |
| 4 | 6/20 | Friday | FL | New Smyrna Beach | 29 | M | Beach | Standing in water |
| 5 | 6/27 | Friday | OK | Eufaula | 57 | F | Neighborhood | Walking |
(Direct Fatalities Only)
|
State
|
Gender
|
Age*
|
Day Of Week*
|
By Month
|
||||||||||||||||
| NC | 1 | M | 4 (80%) | 0-9 | 0 (0%) | Sun | 1 (20%) | 25 | 24 | 23 | 22 | 21 | 20 | 19 | 18 | 17 | 16 | 15 |
10 Yr Avg
|
|
| MS | 1 | F | 1 (20%) | 10-19 | 0 (0%) | Mon | 0 (00%) | Jan | 0 | 0 |
0
|
0
|
0 |
0
|
0
|
0
|
0
|
0
|
0
|
0
|
| TX | 1 | 20-29 | 1 (20%) | Tue | 1 (20%) | Feb | 0 | 0 |
0
|
0
|
0 |
0
|
0
|
1
|
0
|
0
|
0
|
0
|
||
| FL | 1 | 30-39 | 1 (20%) | Wed | 0 (0%) | Mar | 0 | 1 | 0 | 0 |
0
|
0
|
0
|
0
|
0
|
2
|
0
|
0
|
||
| OK | 1 | 40-49 | 1 (20%) | Thu | 0 (0%) | Apr | 2 | 0 | 3 | 0 |
0
|
0
|
0
|
1
|
0
|
4
|
2
|
1
|
||
| 50-59 | 1 (20%) | Fri | 3 (60%) | May | 0 | 2 | 3 | 0 |
0
|
4
|
1
|
2
|
2
|
1
|
4
|
2
|
||||
| 60-69 | 1 (20%) | Sat | 0 (0%) | Jun | 3 | 4 | 1 | 2 | 2 |
2
|
7
|
5
|
2
|
4
|
11
|
4
|
||||
| 70-79 | 0 (0%) | Jul | - | 2 | 1 | 7 | 4 |
8
|
5
|
7
|
7
|
12
|
5
|
6
|
||||||
| 80-89 | 0 (0%) | Aug | - | 2 | 4 | 6 | 4 |
2
|
5
|
2
|
3
|
13
|
4
|
5
|
||||||
| Sep | - | 1 | 1 | 4 | 1 |
1
|
3
|
2
|
2
|
3
|
2
|
2
|
||||||||
| Oct | - | 0 | 0 | 0 | 0 |
0
|
0
|
1
|
0
|
0
|
0
|
0
|
||||||||
| Nov | - | 0 | 0 |
0
|
0 |
0
|
0
|
0
|
0
|
0
|
0
|
0
|
||||||||
| Dec | - | 0 |
0
|
0 |
0
|
0
|
0
|
0
|
0
|
1
|
0
|
0
|
||||||||
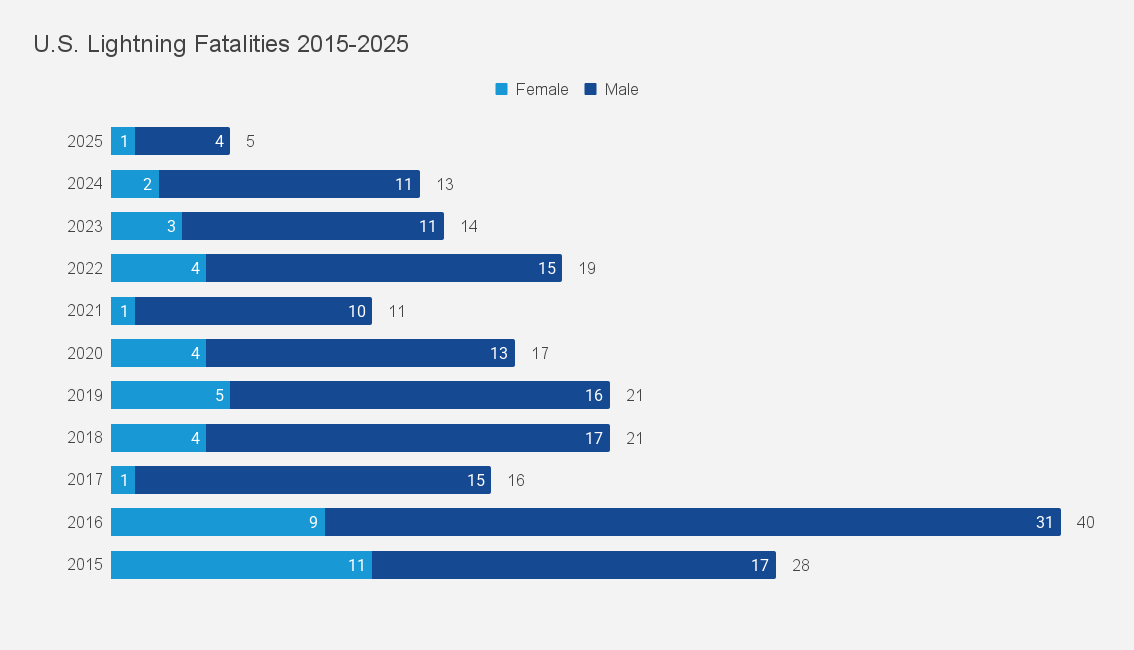
| Year | 4 | 12 | 15 | 19 | 11 |
17
|
21
|
21
|
16
|
40
|
28
|
20**
|
||||||||
| *Due to rounding, percentages may not add up to 100 percent. | ** Note: Data are considered preliminary. Refer to Storm Data for official data. | |||||||||||||||||||
|
Note: Monthly averages are based on a 10-year average from 2015 to 2024. Due to rounding, the sum of the monthly averages may not equal the yearly average. |
||||||||||||||||||||