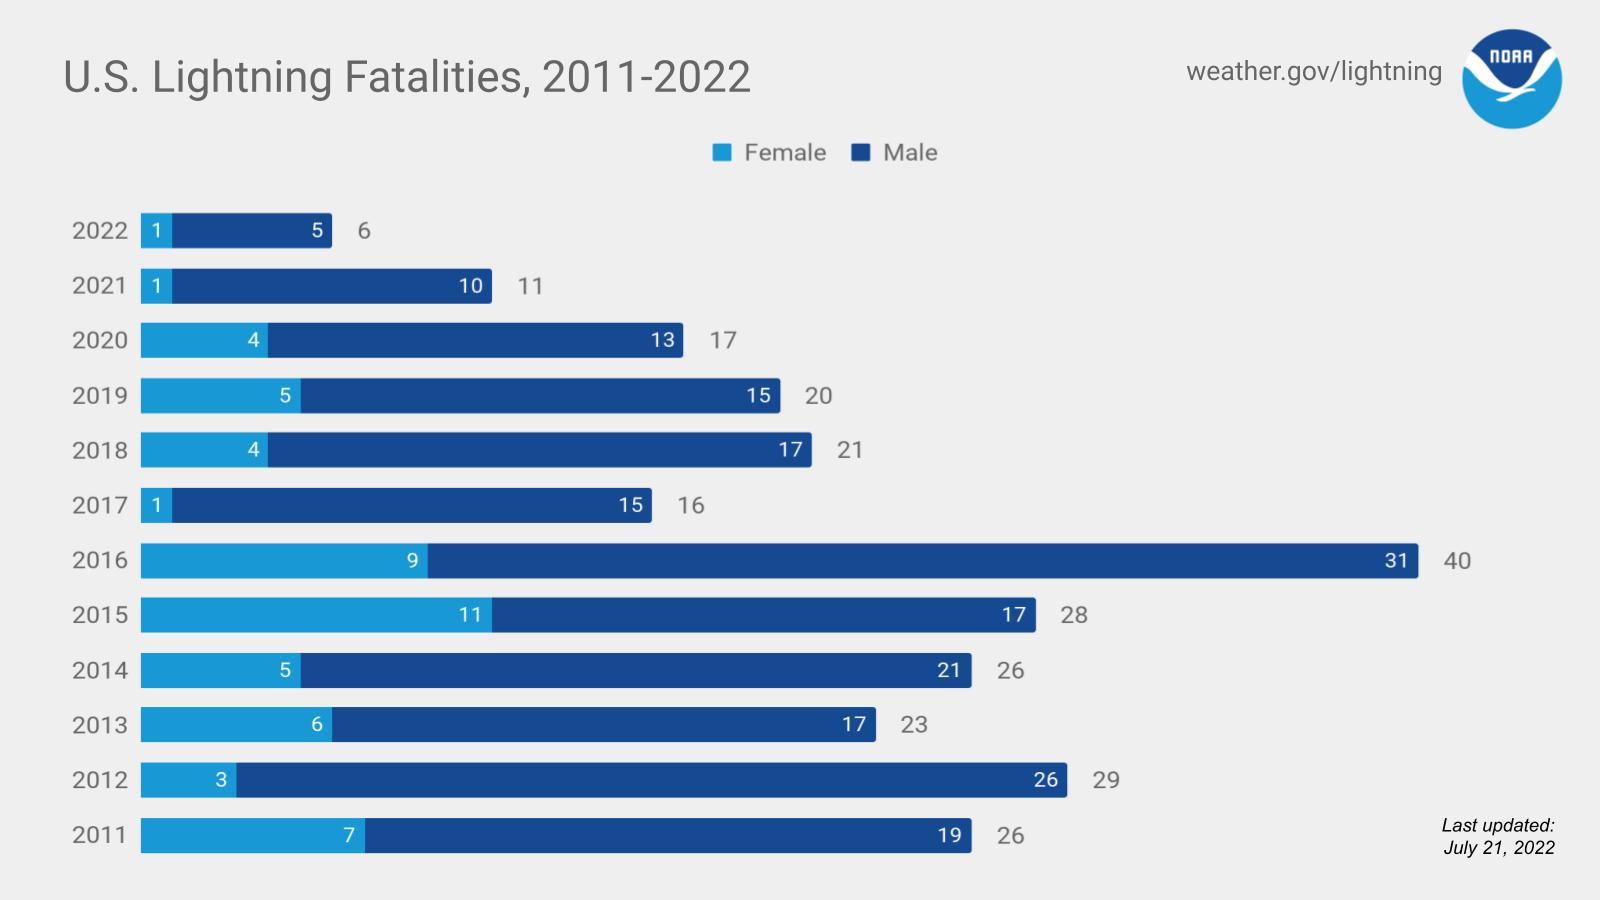
Last Updated: 10/4/2021. This page is updated when new information is received and reviewed for completeness. Statistics and graphics courtesy of John Jensenius (National Lightning Safety Council). This data is preliminary and does not necessarily represent all fatalities to date.
| No. | Date | Day | ST | City/County | Age | Sex | Location | Activity |
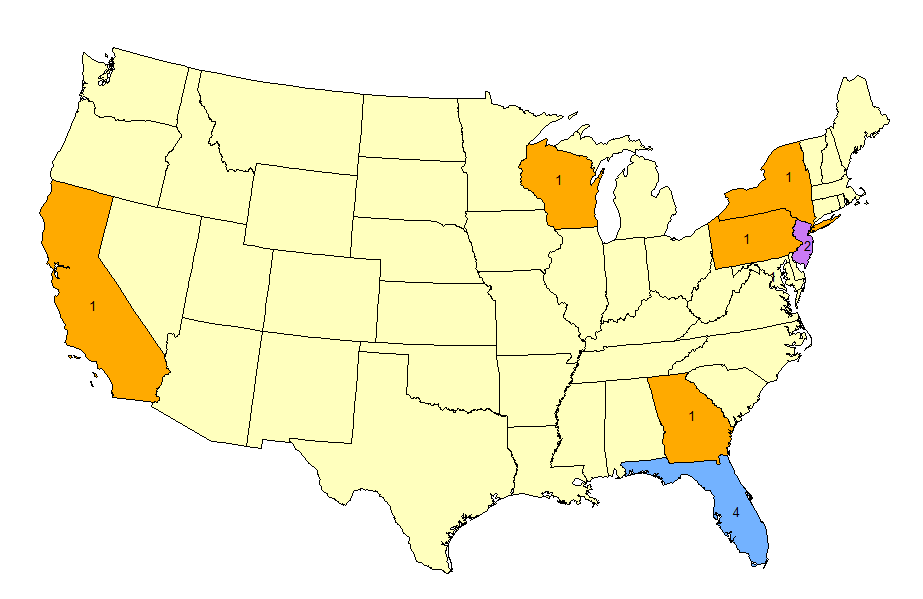
| 1 | 6/9 | Wed | NJ | Burlington County | 70 | M | Golf course under tree | Golfing |
| 2 | 6/12 | Sat | GA | Tybee Island | 15 | F | In water at beach | Beach activities |
| 3 | 7/16 | Fri | PA | Taylor | 71 | M | Golf course | Golfing |
| 4 | 7/17 | Sat | FL | Marco Island | 17 | M | Beach | Beach activities |
| 5 | 7/24 | Sat | FL | Sanibel Island | 41 | M | Beach | Beach activities |
| 6 | 7/30 | Fri | CA | Fresno County | 37 | M | Trail | Hiking |
| 7 | 8/12 | Thu | NY | Bronx | 13 | M | Beach | Beach activities |
| 8 | 8/24 | Tue | WI | Menomonie | 60 | M | Construction site | Construction |
| 9 | 8/25 | Wed | FL | St. Petersburg | 59 | M | Golfing course | Golfing |
| 10 | 8/30 | Mon | NJ | South Seaside Park | 19 | M | Beach | Lifeguarding |
| 11 | 9/7 | Tue | FL | Lakewood Ranch | 19 | M | Roof | Roofing |
(Direct Fatalities Only)
Last Updated: 3/4/2021. This page is updated when new information is received and reviewed for completeness.
|
State
|
Gender
|
Age*
|
Day Of Week*
|
By Month
|
||||||||||||||||
| NJ | 2 | M | 10 (91%) | 0-9 | 0 (0%) | Sun | 0 (0%) | 21 | 20 | 19 | 18 | 17 | 16 | 15 | 14 | 13 | 12 | 11 |
10 Yr Avg
|
|
| GA | 1 | F | 1 (9%) | 10-19 | 5 (45%) | Mon | 1 (9%) | Jan | 0 |
0
|
0
|
0 |
0
|
0
|
0
|
0
|
0
|
0
|
0
|
0
|
| PA | 1 | 20-29 | 0 (0%) | Tue | 2 (18%) | Feb | 0 |
0
|
0
|
1 |
0
|
0
|
0
|
0
|
0
|
0
|
0
|
0
|
||
| FL | 4 | 30-39 | 1 (9%) | Wed | 2 (18%) | Mar | 0 | 0 | 0 | 0 |
0
|
2
|
0
|
0
|
0
|
1
|
0
|
0
|
||
| CA | 1 | 40-49 | 1 (9%) | Thu | 1 (9%) | Apr | 0 | 0 | 0 | 1 |
0
|
4
|
2
|
0
|
1
|
2
|
0
|
1
|
||
| NY | 1 | 50-59 | 1 (9%) | Fri | 2 (18%) | May | 0 | 4 | 1 | 2 |
2
|
1
|
4
|
5
|
5
|
0
|
1
|
3
|
||
| WI | 1 | 60-69 | 1 (9%) | Sat | 3 (27%) | Jun | 2 | 2 | 7 | 5 |
2
|
4
|
11
|
3
|
2
|
3
|
5
|
4
|
||
| 70-79 | 2 (18%) | Jul | 4 | 8 | 5 | 7 |
7
|
12
|
5
|
9
|
6
|
13
|
9
|
8
|
||||||
| 80-89 | 0 (0%) | Aug | 4 | 2 | 5 | 2 |
3
|
13
|
4
|
5
|
4
|
7
|
6
|
5
|
||||||
| Sep | 1 | 1 | 3 | 2 |
2
|
3
|
2
|
3
|
5
|
2
|
4
|
3
|
||||||||
| Oct | 0 | 0 | 0 | 1 |
0
|
0
|
0
|
1
|
0
|
1
|
1
|
0
|
||||||||
| Nov | 0 | 0 |
0
|
0 |
0
|
0
|
0
|
0
|
0
|
0
|
0
|
0
|
||||||||
| Dec | 0 | 0 |
0
|
0 |
0
|
1
|
0
|
0
|
0
|
0
|
0
|
0
|
||||||||
| Year | 11 | 17 | 21 | 21 |
16
|
40
|
28
|
26
|
23
|
29
|
26
|
25**
|
||||||||
| *Due to rounding, percentages may not add up to 100 percent. | ** Note: Data are considered preliminary. Refer to Storm Data for official data. | |||||||||||||||||||
|
Note: Monthly averages are based on a 10-year average from 2012 to 2021. Due to rounding, the sum of the monthly averages may not equal the yearly average. |
||||||||||||||||||||