Last Updated: 9/26/2022. This page is updated when new information is received and reviewed for completeness. Statistics and graphics courtesy of John Jensenius (National Lightning Safety Council). This data is preliminary and does not necessarily represent all fatalities to date.
| No. | Date | Day | ST | City/County | Age | Sex | Location | Activity |
| 1 | 6/22 | Wed | CA | Pico Rivera | 52 | F | Path | Walking dogs |
| 2 | 6/29 | Wed | LA | Metaire | 24 | M | Roof | Roofing |
| 3 | 7/2 | Sat | GA | Mountain City | 39 | M | At a residence | Loading tools in van |
| 4 | 7/2 | Sat | KY | Madisonville | 38 | M | Field | Flying remote control plane |
| 5 | 7/3 | Wed | NC | Masonboro | 33 | M | Boat on beach | Boating activities |
| 6 | 7/6 | Wed | OH | Sidney | 50 | M | Highway | Fixing truck |
| 7 | 7/9 | Sat | AL | Brewton | 30s | M | Creek | Floating down creek |
| 8 | 7/19 | Tue | FL | New Symrna Beach | 27 | M | Neighborhood, near tree | Lawn care |
| 9 | 7/20 | Wed | GA | Fort Gordon | 41 | M | Army training exercise | |
| 10 | 8/2 | Tue | WY | Teton County | 22 | M | In tent | Camping |
| 11 | 8/4 | Thu | DC | Washington | 76 | M | In park | Tourism |
| 12 | 8/4 | Thu | DC | Washington | 75 | F | In park | Tourism |
| 13 | 8/4 | Thu | DC | Washington | 29 | M | In park | Business/Sightseeing |
| 14 | 8/4 | Thu | MD | Parkville | 35 | M | Parking lot | Window replacement |
| 15 | 8/18 | Thu | FL | Winter Springs | 42 | F | In park | Awaiting school dismissal |
| 16 | 9/4 | Sun | PR | Salinas | 33 | M | Ocean | Jet skiing |
| 17 | 9/4 | Sun | PR | Salinas | 26 | F | Ocean | Jet skiing |
| 18 | 9/15 | Thu | FL | Orlando | 13 | M | Lake | Crew/rowing |
| 19 | 9/15 | Thu | FL | Orlando | 11 | M | Lake | Crew/rowing |
(Direct Fatalities Only)
Last Updated: 9/26/2022. This page is updated when new information is received and reviewed for completeness.
|
State
|
Gender
|
Age*
|
Day Of Week*
|
By Month
|
||||||||||||||||
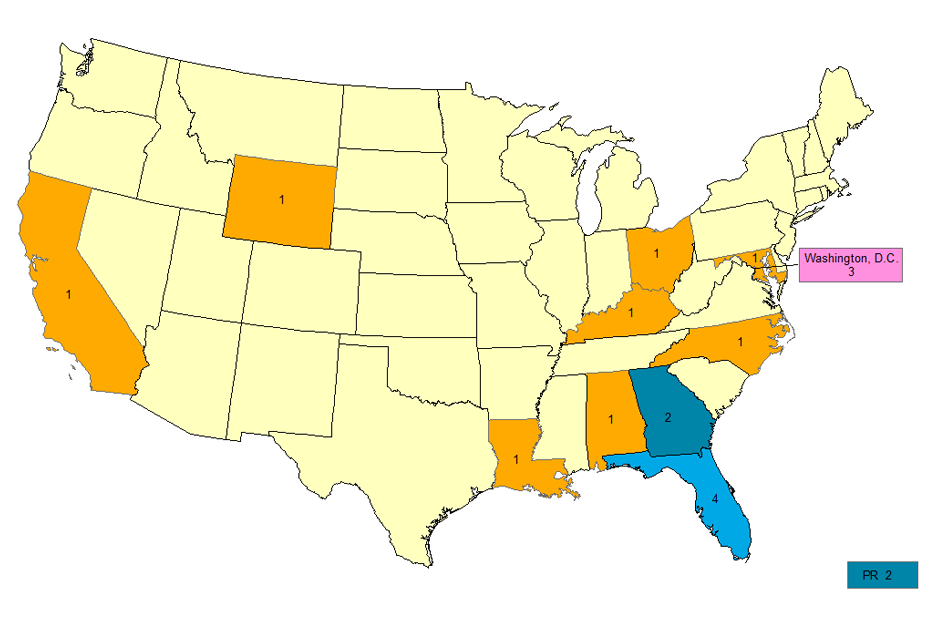
| CA | 1 | M | 15 (78%) | 0-9 | 0 (0%) | Sun | 3 (16%) | 22 | 21 | 20 | 19 | 18 | 17 | 16 | 15 | 14 | 13 | 12 |
10 Yr Avg
|
|
| GA | 2 | F | 4 (21%) | 10-19 | 2 (11%) | Mon | 0 (0%) | Jan | 0 |
0
|
0
|
0 |
0
|
0
|
0
|
0
|
0
|
0
|
0
|
0
|
| NC | 1 | 20-29 | 5 (26%) | Tue | 2 (11%) | Feb | 0 |
0
|
0
|
0 |
1
|
0
|
0
|
0
|
0
|
0
|
0
|
0
|
||
| KY | 1 | 30-39 | 6 (32%) | Wed | 4 (21%) | Mar | 0 | 0 | 0 | 0 |
0
|
2
|
0
|
0
|
0
|
1
|
0
|
0
|
||
| OH | 1 | 40-49 | 2 (11%) | Thu | 7 (37%) | Apr | 0 | 0 | 0 | 0 |
1
|
0
|
4
|
2
|
0
|
1
|
2
|
1
|
||
| AL | 1 | 50-59 | 2 (11%) | Fri | 0 (0%) | May | 0 | 0 | 4 | 1 |
2
|
2
|
1
|
4
|
5
|
5
|
0
|
2
|
||
| FL | 2 | 60-69 | 0 (0%) | Sat | 3 (16%) | Jun | 2 | 2 | 2 | 7 |
5
|
2
|
4
|
11
|
3
|
2
|
3
|
4
|
||
| WY | 1 | 70-79 | 2 (11%) | Jul | 7 | 4 | 8 | 5 |
7
|
7
|
12
|
5
|
9
|
6
|
13
|
8
|
||||
| DC | 3 | 80-89 | 0 (0%) | Aug | 6 | 4 | 2 | 5 |
2
|
3
|
13
|
4
|
5
|
4
|
7
|
5
|
||||
| MD | 1 | Sep | 4 | 1 | 1 | 3 |
2
|
2
|
3
|
2
|
3
|
5
|
2
|
2
|
||||||
| LA | 1 | Oct | - | 0 | 0 | 0 |
1
|
0
|
0
|
0
|
1
|
0
|
1
|
0
|
||||||
| PR | 2 | Nov | - | 0 |
0
|
0 |
0
|
0
|
0
|
0
|
0
|
0
|
0
|
0
|
||||||
| Dec | - | 0 |
0
|
0 |
0
|
0
|
1
|
0
|
0
|
0
|
0
|
0
|
||||||||
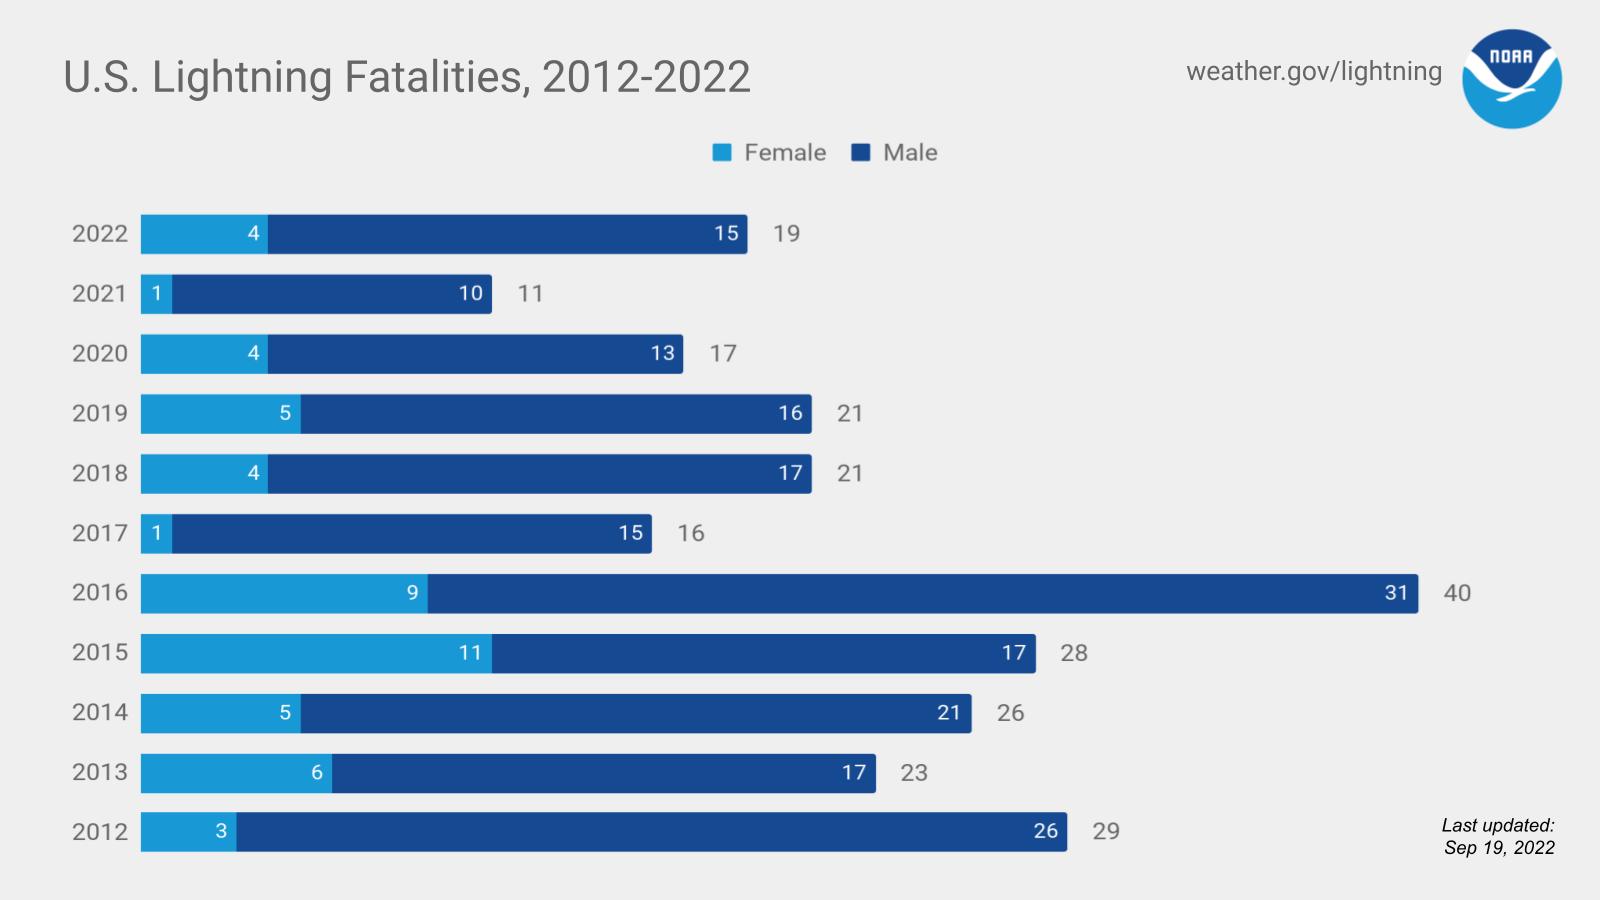
| Year | 19 | 11 | 17 | 21 |
21
|
16
|
40
|
28
|
26
|
23
|
29
|
23**
|
||||||||
| *Due to rounding, percentages may not add up to 100 percent. | ** Note: Data are considered preliminary. Refer to Storm Data for official data. | |||||||||||||||||||
|
Note: Monthly averages are based on a 10-year average from 2012 to 2021. Due to rounding, the sum of the monthly averages may not equal the yearly average. |
||||||||||||||||||||