
| Hover over or click station to get METAR and TAF (if available). | Flight Categories: |
KOMA - Omaha - Eppley Airfield
Forecast valid from 1800 GMT 12 Feb 2026 to 1800 GMT 13 Feb 2026
Latest observation at 1752 GMT 12 Feb 2026
For situational awareness. Not to be used for flight planning purposes
| Potential Impact | None | Slight | Moderate | High |
| Time | 1752Z | 12/19Z | 12/20Z | 12/21Z | 12/22Z | 12/23Z | 13/00Z | 13/01Z | 13/02Z | 13/03Z | 13/04Z | 13/05Z | 13/06Z | 13/07Z | 13/08Z | 13/09Z |
|---|---|---|---|---|---|---|---|---|---|---|---|---|---|---|---|---|
| VIS | 10 | >6 | >6 | >6 | >6 | >6 | >6 | >6 | >6 | >6 | >6 | >6 | >6 | >6 | >6 | >6 |
| CIG | ||||||||||||||||
| Cover | SCT | SKC | SKC | SKC | SKC | SKC | SKC | SKC | SKC | SKC | SKC | SKC | SKC | SKC | SKC | SKC |
| FltCat | VFR | VFR | VFR | VFR | VFR | VFR | VFR | VFR | VFR | VFR | VFR | VFR | VFR | VFR | VFR | VFR |
| WX | ||||||||||||||||
| WDir | 160 | 170 | 170 | 170 | 170 | 170 | 340 | 340 | 340 | 340 | 340 | 340 | 340 | 340 | 340 | 340 |
| WSpd | 11 | 10 | 10 | 10 | 10 | 10 | 2 | 2 | 2 | 2 | 2 | 2 | 2 | 2 | 2 | 2 |
| WGust |
FTUS43 KOMA 121721 RRA
KOMA 121720Z 1218/1318 17010KT P6SM SKC
     FM130000 34002KT P6SM SKC
| Potential Impact | None | Slight | Moderate | High |
| Time | OBS | 12/19Z | 12/20Z | 12/21Z | 12/22Z | 12/23Z | 13/00Z | 13/01Z | 13/02Z | 13/03Z | 13/04Z | 13/05Z | 13/06Z | 13/07Z | 13/08Z | 13/09Z |
|---|---|---|---|---|---|---|---|---|---|---|---|---|---|---|---|---|
| KGRI | ||||||||||||||||
| KLNK | ||||||||||||||||
| KOFK |
NOTE: TEMPO conditions in [brackets]. Keep in mind TEMPO conditions might be better (lower impact) than prevailing conditions.
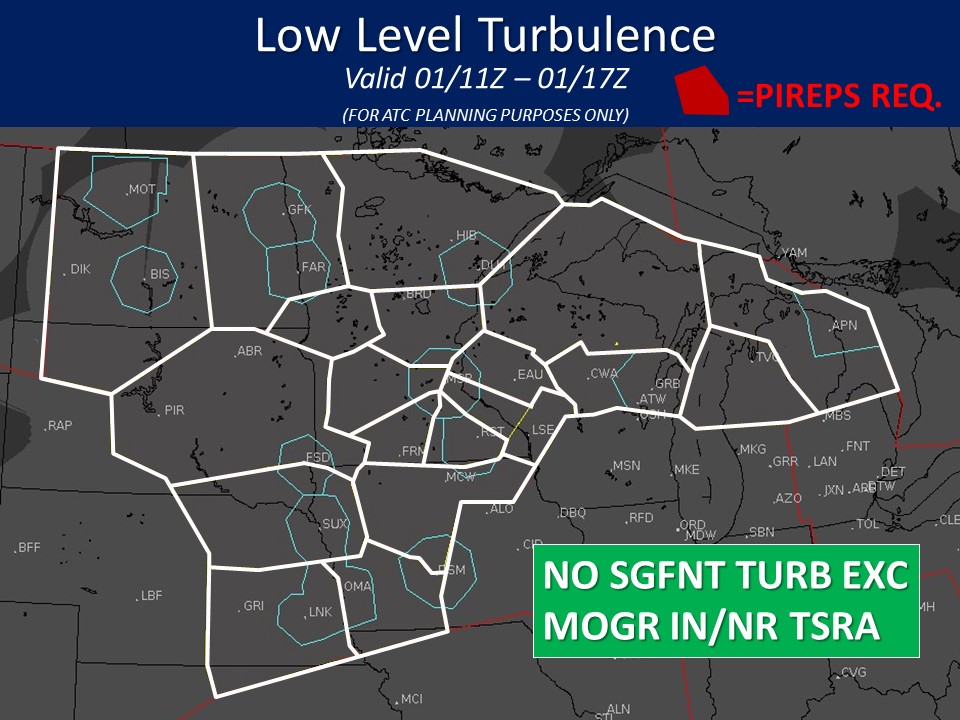
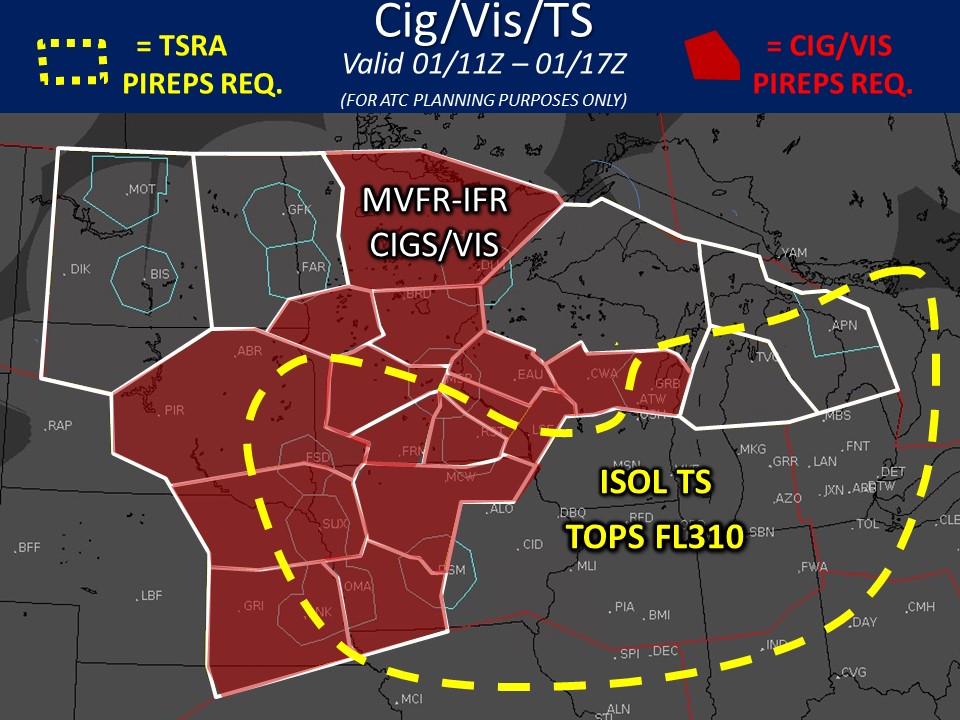
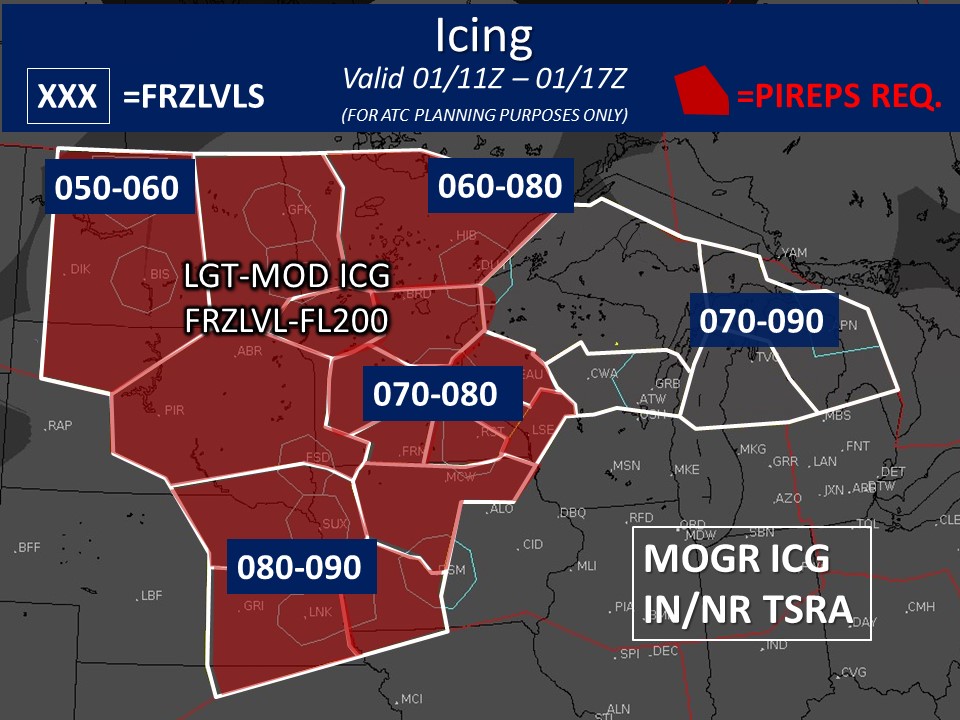
Bar graphs indicate the probability of selected flight category element. The color represents the difference (using 10% thresholds between categories) between the probability and the threshold required to make a categorical forecast. Solid black lines indicate the threshold value at each hour
Bar graphs indicate the probability of selected flight category element. The color represents the difference (using 10% thresholds between categories) between the probability and the threshold required to make a categorical forecast. Solid black lines indicate the threshold value at each hour
|
This Afternoon 
Sunny High: 58° |
Tonight 
Mostly Clear Low: 30° |
Friday 
Sunny High: 57° |
Friday Night 
Mostly Cloudy Low: 36° |
Saturday 
Chance Rain High: 60° |
Saturday Night 
Mostly Clear Low: 34° |
Sunday 
Sunny High: 62° |