National Weather Service United States Department of Commerce


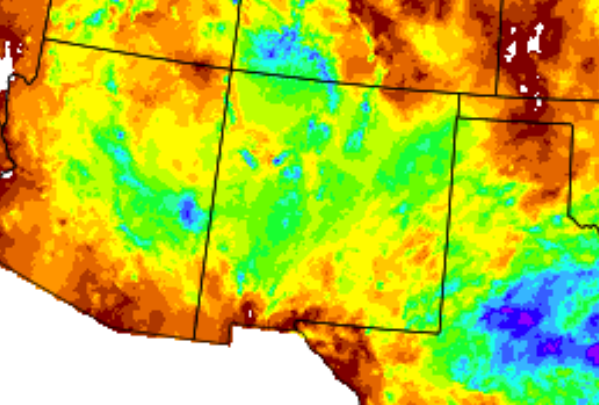
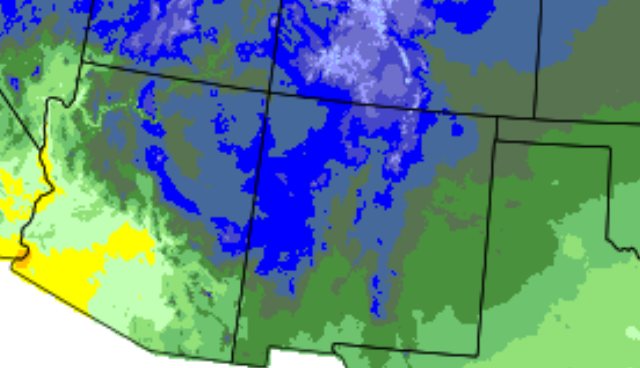
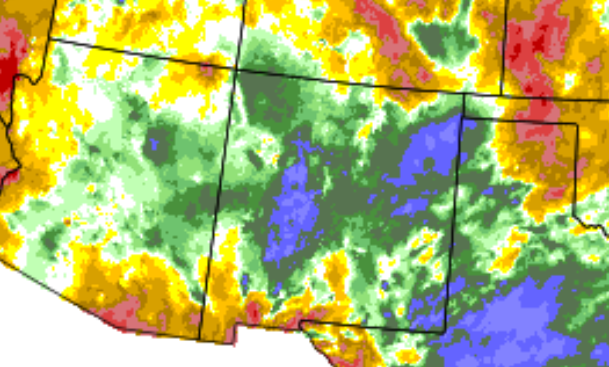
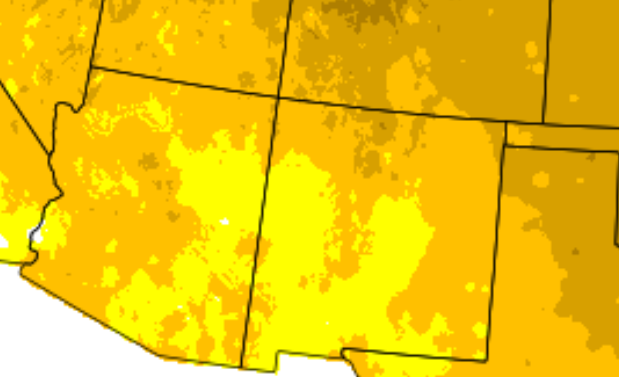
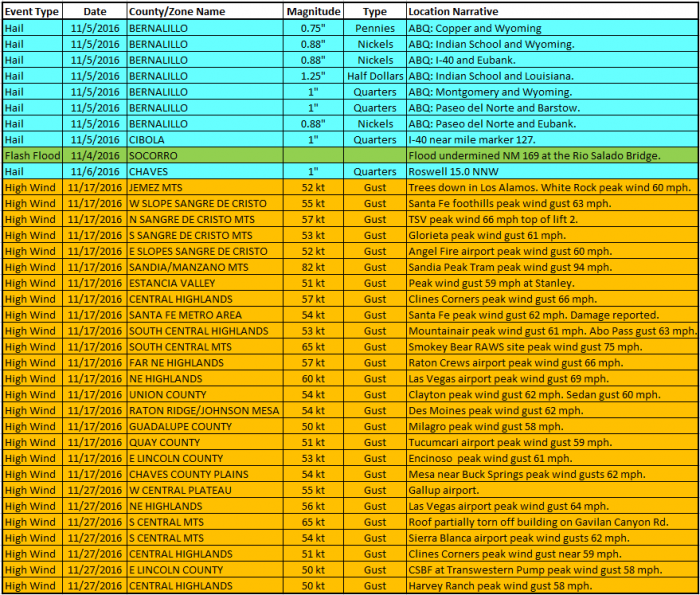
The start of November was quiet until the 4th through 6th as widespread rain and isolated severe weather struck New Mexico. The hardest hit was actually Albuquerque with numerous reports of nickel to quarter size hail on the 5th. Flash flooding occurred in Quay and Socorro Counties on the 6th. A mostly dry and unseasonably warm period ensued from the 7th through 16th. Then high winds and much colder air poured over the state on the 17th. The first round of snow finally arrived across the northern mountains on the 21st through 22nd. A more active period of weather impacted New Mexico nearing the end of the month, including light to moderate snow over the northwest half of the state from the 26th through early on the 29th.


Statewide Precipitation and Temperatures

Statewide Precipitation - Actual

Statewide Temperatures - Actual


Statewide Precipitation - Percent Of Normal Statewide Temperatures - Departure From Normal


   Climate Cities Temperatures and Precipitation

Albuquerque
 

There was 1.03 inches of precipitation measured at the Sunport in November 2016, compared to the normal of 0.57 inches, or 0.46 inches above normal.

The average temperature for Albuquerque in November 2016 was 48.3°, which was 3.4 degrees above the normal of 44.9°. This was tied for the 11th warmest November on record.

The average maximum temperature for the month was 58.6°. This was 2.8 degrees above the normal average maximum temperature of 55.8°.

The average minimum temperature for the month was 38.1°. This was 4.0 degrees above the normal average minimum temperature of 34.1 degrees.

There was 0.1 inches of snow in November 2016, while normal is 1.0 inch.

Records: 5th  Record daily rainfall 0.40 inches

 
 Clayton
 

There was 1.50 inches of precipitation measured at Clayton in October 2016, or 1.05 inches above the average of 0.45 inches.

The average temperature for Clayton in November 2016 was 48.2°, which was 4.6 degrees above the normal of 43.6°. This was the 6th warmest November on record.

The average maximum temperature for the month was 61.9°. This was 4.7 degrees above the normal average maximum temperature of 57.2 degrees.

The average minimum temperature for the month was 34.5°. This was 4.5 degrees above the normal average minimum temperature of 30.0°.

There was no snow at Clayton during November 2016, while normal is 3.0 inches.

Records: none

 
 Roswell
 

There was 0.71 inches of precipitation reported at Roswell during November of 2016, which is 0.13 inches above the normal of 0.58 inches.

The average temperature in Roswell for November 2016 was 53.2°, which is 3.9 degrees above the normal of 49.3 degrees. This was tied for the 7th warmest November on record.

The average maximum temperature for the month was 66.9°. This was 2.6 degrees above the average maximum temperature of 64.3 degrees.

The average minimum temperature for the month was 39.6°. This was 5.3 degrees above the normal average minimum temperature of 34.3°

Records: 1st Record Daily High 87

                5th Record Daily Rainfall 0.69 inches

Severe Weather
Storm reports are considered preliminary until a final review is certified in the NWS Storm Data publication.
Certified data is available three to four months post-event at: https://www.ncdc.noaa.gov/stormevents/