Experimental Gridded Soil Moisture Products
These experimental images are intended to be used as short-term and long-term drought assessment tools for the ABRFC basin. They are created empirically from our hydrologic model data, and based on a priori grids of the Sac-SMA hydrologic distributed model used at ABRFC. They are not directly based on any measured data, but derived from soil types, land use, and antecedent precipitation. On a very basic level, the hydrologic model takes rainfall at the surface, moves it slowly through the upper zones of the soil, and stores it in the lower zones. Typically, water in the upper zones moves through to the lower zones (or out through evaporation) on a time scale of days to a few weeks. The upper and lower zones have a variable depth and capacity, but generally, the upper zone is the first few inches of soil while the lower zone is the next few feet. The upper zone images below can indicate short-term wetness or dryness, while the lower zone images can indicate long-term wetness or dryness. The Total Zone images are a combination of the Upper and Lower zones into one zone. The grid resolution for the following images is the 4km x 4km Hydrologic Rainfall Analysis Project (HRAP) grid.
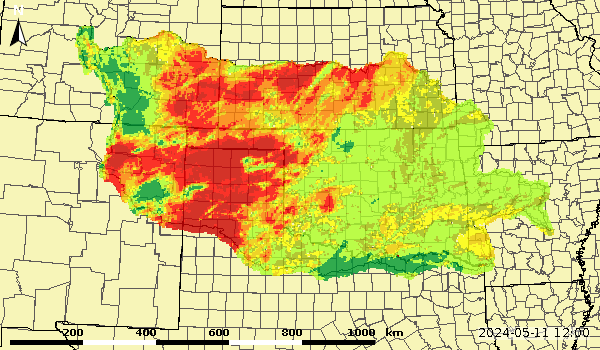
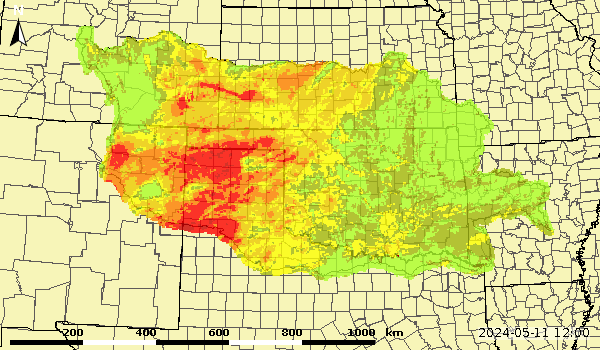
The first row of images shows the upper zone (short-term), lower zone (long-term), and total zone anomaly of the current percentage full of the zones with respect to the 16 year (1996-2011) current month average. It is representative of the current state of the soil zones compared to what may be expected for the current month.
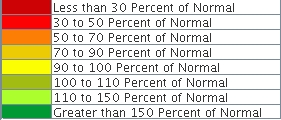
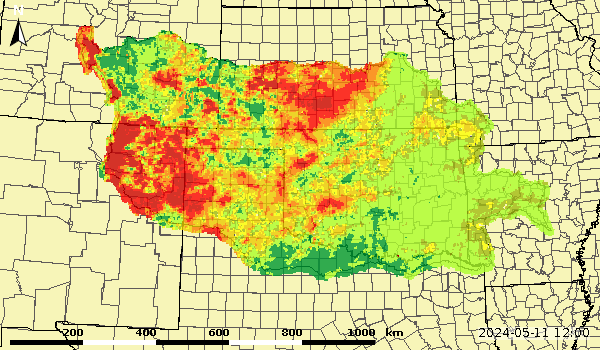
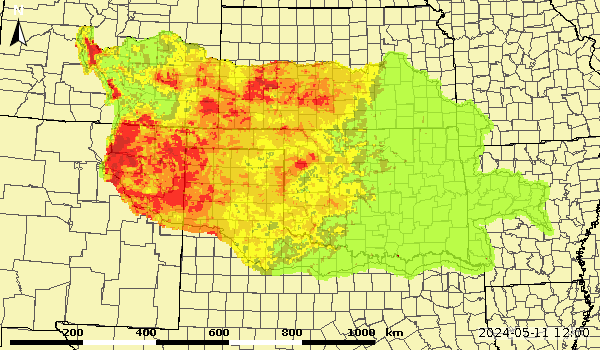
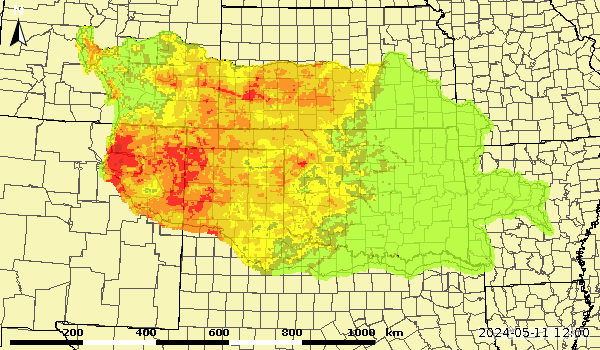
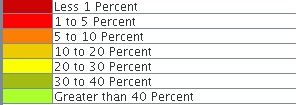
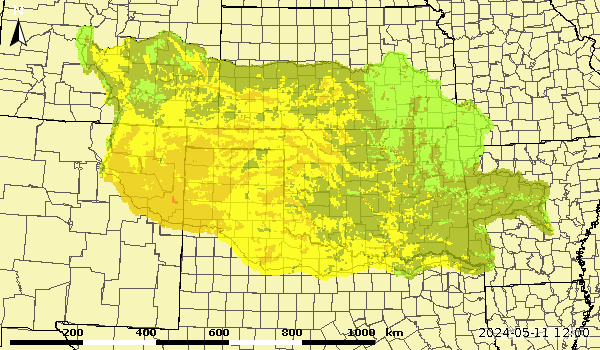
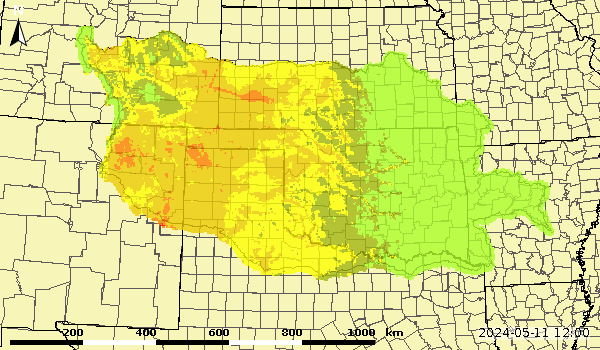
The second row of images shows the percentage full of the upper (short-term), lower (long-term), and total zones across the ABRFC. They are representative of the short-term and long-term wetness or dryness across the area. Generally, green areas are relatively wet, while orange and red areas are dry. Typically, it takes a few to several days for rainfall to move from the upper to the lower zones. Thus, in general on the long-term image the green areas depict areas that have been wet for the past few weeks, where orange and red areas show areas of that have been dry.
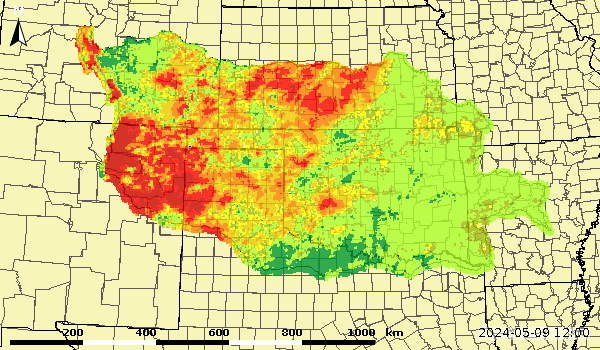
The third row of images shows the 16 year monthly average of the percentage fullness of the zones, and these images will change on the first day of every month.
Click on each image for a closer look.
File created: 2025-10-14 14:15Z
| Upper Zone Anomaly | Lower Zone Anomaly | Total Zone Anomaly |
|
|
|
|
| Upper Zone Percentage Full | Lower Zone Percentage Full | Total Zone Percentage Full |
|
|
|
|
| Upper Zone 16 Year Current Month Average | Lower Zone 16 Year Current Month Average | Total Zone 16 Year Current Month Average |
|
|
|
|