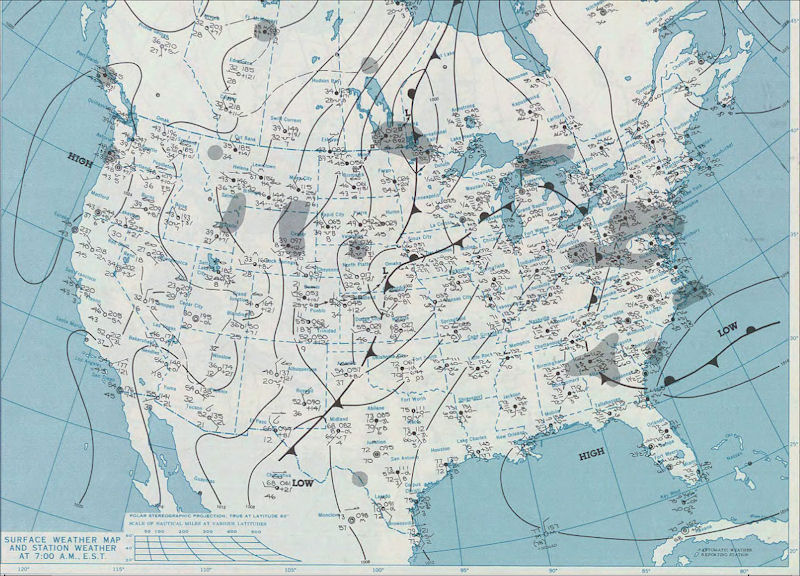
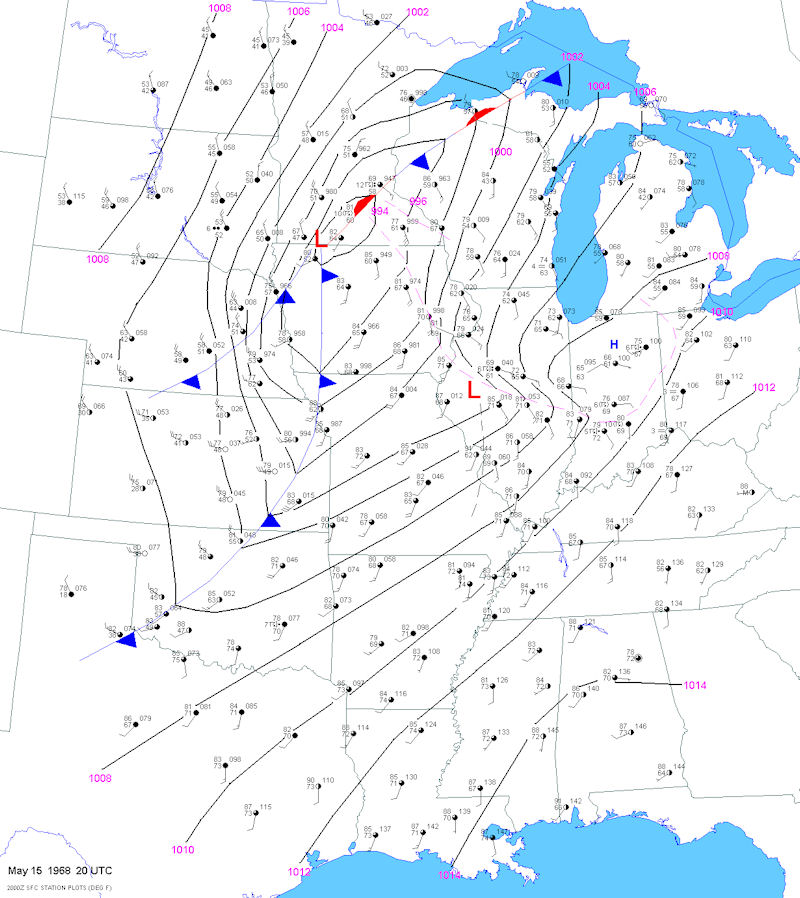
On May 14th, an occluded front moved east through the Upper Mississippi River Valley. This front stalled out across central Iowa and southern Wisconsin. A surface low developed along the tail end of this front across northeast Colorado and it moved east northeast into eastern Nebraska by 6 AM CDT on May 15th (Figure 1). Looking aloft, there was a slow moving anomalously deep trough (it was most noticeable at 850 mb where it was 2 to 3 standard deviations below normal across the eastern Dakotas and eastern Nebraska ) located across the central and northern Plains.
 |
 |
| Figure 1: Surface Map at 6 AM CDT on May 15, 1968. (This image was compliments of NOAA Central Library U.S. Daily Weather Maps Project.) | Figure 2: 850 mb (approximately 5,000 feet above ground) height anomalies at 7 AM CDT. The area in darker blue indicates that these heights were 2 to 3 standard deviations below normal. (This image was compliments of the Penn State Meteorology Department's NCEP/NCAR Reanalysis Mapper) |
The morning soundings on May 15th at both Omaha, Nebraska (Figure 3) and Topeka, Kansas (Figure 4) (both upper air sites located in the warm sector of this low pressure system and this would be the air mass located across Iowa later in the day) showed what meteorologists call a "loaded gun" sounding. This is where the atmosphere below is moist and if it is allowed to rise, it would be warmer than the air mass aloft (which is typically cooler and much drier). At the "interface" between these two layers, there is a layer of warm air (this typically called a "cap") which prevents the instability from being released. This cap allows the lowest layers of the atmosphere to warm (due to either diurnal heating or a warmer air mass moving into the region) and for the moisture to possibly increase (either by plant evapotranspiration or by being moved into the region by the low level winds). If the air mass above the cap remains cool and dry, the instability will continue to progressively increase. The energy from this potentially explosive atmosphere can only be released if the cap is eliminated by either this warm layer cooling (either by cooler air moving in aloft or this layer being lifted by a strong low pressure system) or the surface temperature has become warmer than the cap.
 |
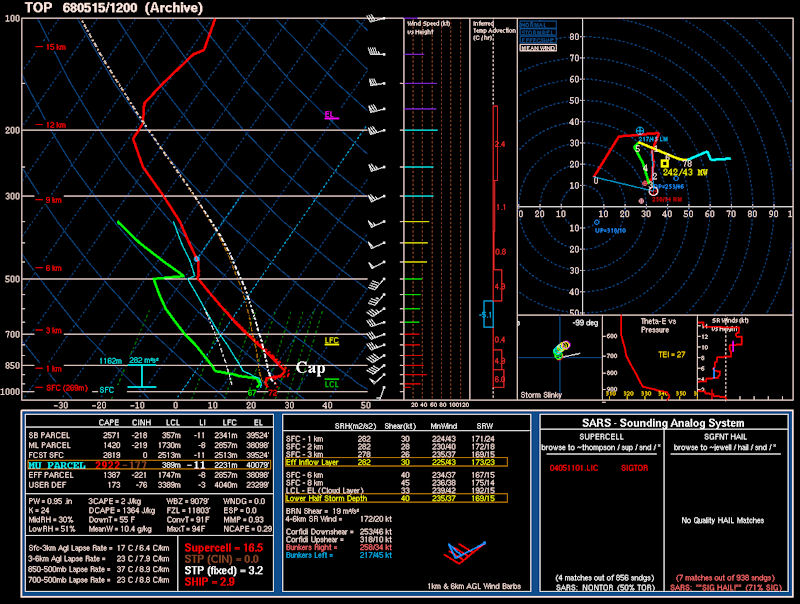 |
| Figure 3: Omaha, NE Upper Air Sounding at 7 AM CDT on May 15, 1968. (This image was compliments of Greg Carbin at the NCEP Storm Prediction Center.) | Figure 4: Topeka, KS Upper Air Sounding at 7 AM CDT on May 15, 1968. (This image was compliments of Greg Carbin at the NCEP Storm Prediction Center.) |
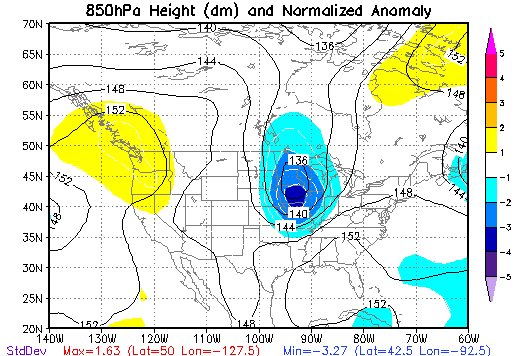
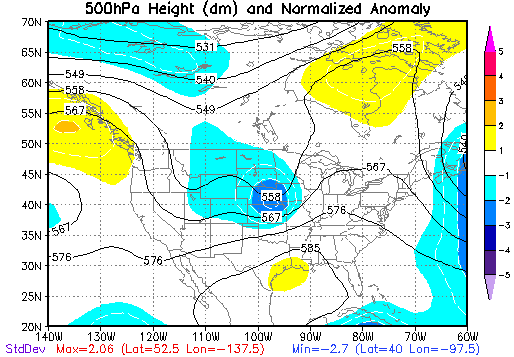
In the case of May 15th, the lift continued to progressively increase during the afternoon as the deepening upper level trough moved slowly east into the mid and upper Mississippi River Valley. By 7 PM CDT, the 850 mb trough (Figure 5) was a very impressive 3 to 4 standard deviations below normal and the 700 mb (Figure 6) and 500 mb (Figure 7) troughs were 2 to 3 standard deviations below normal. This lift slowly cooled the cap and eventually all of the instability that had built through the morning and early afternoon was able to be released through the rapid development of thunderstorms.
 |
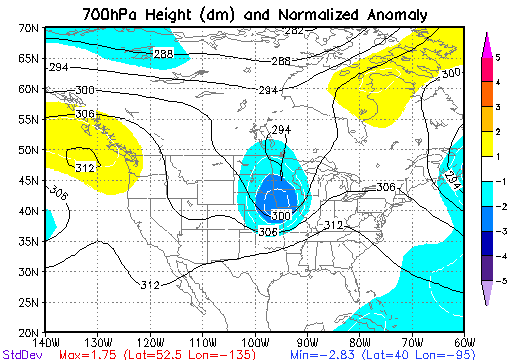 |
| Figure 5: 850 mb (approximately 5,000 feet above ground) height anomalies at 7 PM CDT on May 15, 1968. The area in dark blue indicates that these heights were 3 to 4 standard deviations below normal. (This image was compliments of the Penn State Meteorology Department's NCEP/NCAR Reanalysis Mapper) | Figure 6: 700 mb (approximately 10,000 feet above ground) height anomalies at 7 PM CDT on May 15, 1968. The area in darker blue indicates that these heights were 2 to 3 standard deviations below normal. (This image was compliments of the Penn State Meteorology Department's NCEP/NCAR Reanalysis Mapper) |
 |
|
| Figure 7: 500 mb (approximately 18,000 feet above ground) height anomalies at 7 PM CDT on May 15, 1968. The area in darker blue indicates that these heights were 2 to 3 standard deviations below normal. (This image was compliments of the Penn State Meteorology Department's NCEP/NCAR Reanalysis Mapper) | |
With the upper level system continuing to intensify, this allowed the surface low to continue to deepen. This enhanced the southerly winds from the Gulf of Mexico northward to Iowa. These winds brought an unusually warm and moist air mass northward into Iowa and southeast Minnesota. By 3 PM CDT, the temperatures across Iowa were in the lower and mid 80s (Figure 8). This is about 10 to 15 degrees above normal. In addition, the surface dew points were in the mid 60s. These dew points are typically seen in mid June in northeast Iowa. It was shortly after this time that the thunderstorms quickly started to develop across southeast Minnesota and northeast Iowa.
 |
| Figure 8: Surface map at 3 PM CDT on May 15, 1968. (This image was compliments of Greg Carbin at the NCEP Storm Prediction Center.) |
Besides instability, thunderstorms need sufficient wind shear aloft (simply winds either from different directions aloft or wind speeds progressively increasing with height) to become severe. This wind shear allows the thunderstorm an opportunity to organize itself such that the moist and unstable feed of air is unimpeded from the cooler and more stable air that the thunderstorm generates. Although the wind shear across the region was not that abnormally strong, there was a surface trough (indicated by the dashed magenta line which extended from just west of Twin Cities southeast into central Illinois in Figure 8) which helped to increase the low level shear and focused the low level moisture.
As the thunderstorms encountered this surface trough, they likely ingested the strong low level shear and very unstable air. In addition, the intense lift associated with the very deep upper level trough aloft likely intensified this rotating updraft. Like an ice skater pulling in her or his arms, the rotation of the tornado will spin faster and faster. The combination of these events likely resulted in the development of the 29 tornadoes across Illinois (4), Indiana (4), Iowa, (5), Minnesota (5), Kansas (1 - this tornado quickly moved into Missouri), Missouri (9), and Ohio (2). This included two F5 tornadoes which moved through the Charles City, Maynard, and Oelwein in northeast Iowa.
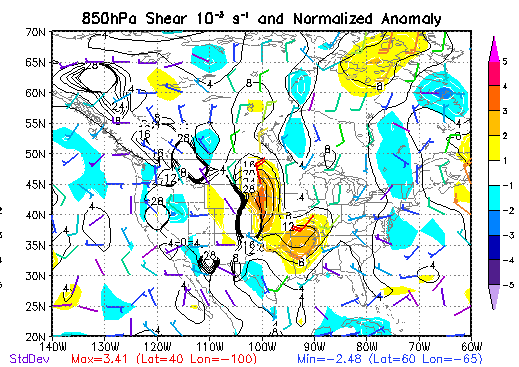 |
| Figure 9: 850 mb (approximately 5,000 feet above ground) wind shear anomalies at 7 PM CDT on May 15, 1968. The area in orange indicates that these wind shear values were 2 to 3 standard deviations above normal. (This image was compliments of the Penn State Meteorology Department's NCEP/NCAR Reanalysis Mapper) |


 Follow us on YouTube