| Overview | Radar | Damage Surveys | SPC Products | Meteorology |
An active 24 hour period unfolded across Southeast Michigan on Monday afternoon and into early Tuesday morning. Two different rounds of severe weather hit the area, with the first round sweeping a MCS (Mesoscale Convective Complex) Monday afternoon and the second round coming across late Monday night. The second round of severe weather brought 4 tornadoes to Saginaw/Tuscola, Sanilac, St. Clair, and Washtenaw counties. Damage surveys were done and the results can be found below. Damage from the tornadoes ranged from EF0 to EF2. More information on the EF scale (Enhanced Fujita) can be found here.
Back to top
First radar loop is the first round of thunderstorms that rolled through Monday afternoon and the second loop is the second round of severe weather that occurred late Monday night into early Tuesday.
Please Note that radar loop times are in CDT, not EDT (add 1 hour to time).
First Round: Monday Afternoon
Second Round: Late Monday Night into Early Tuesday
 |
| Radar loop courtesy of Iowa Environmental Mesonet (IEM). |
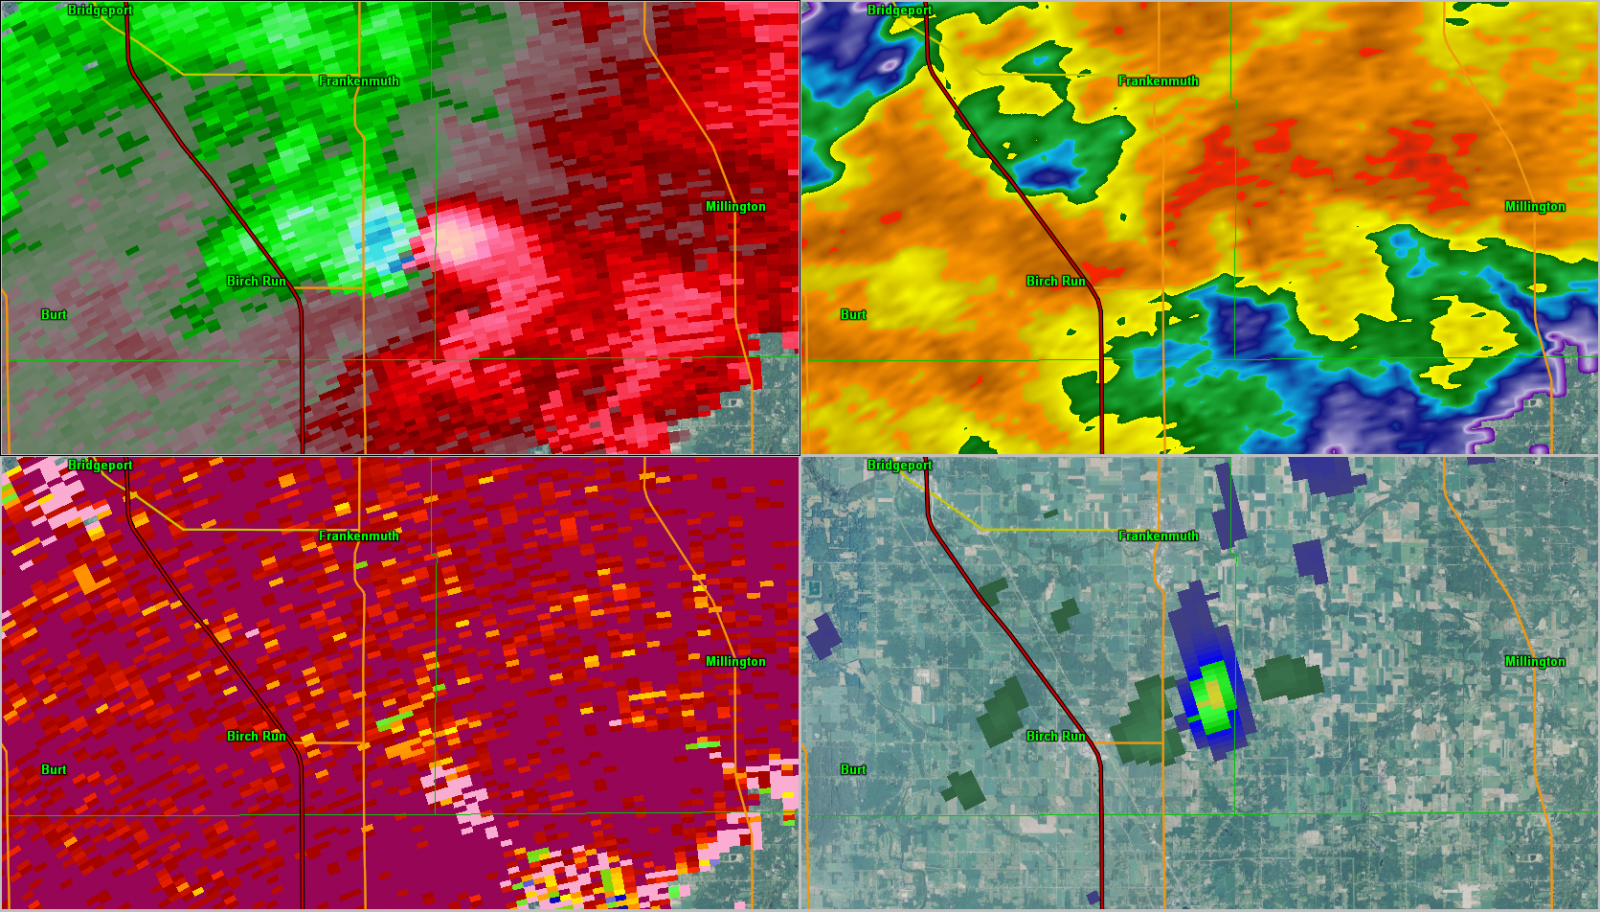
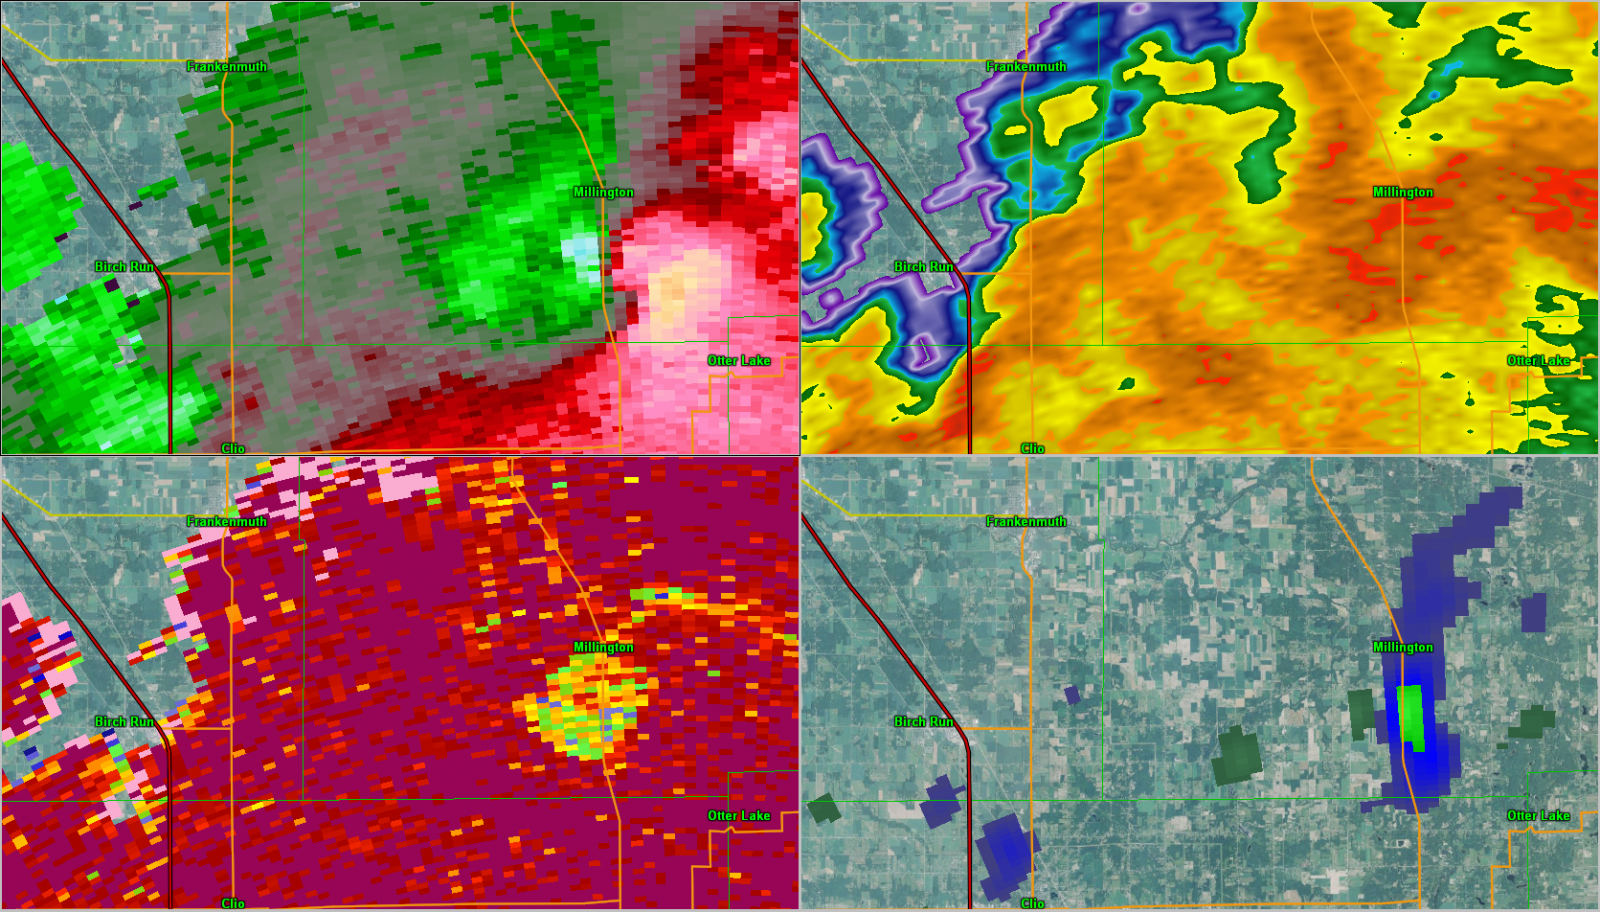
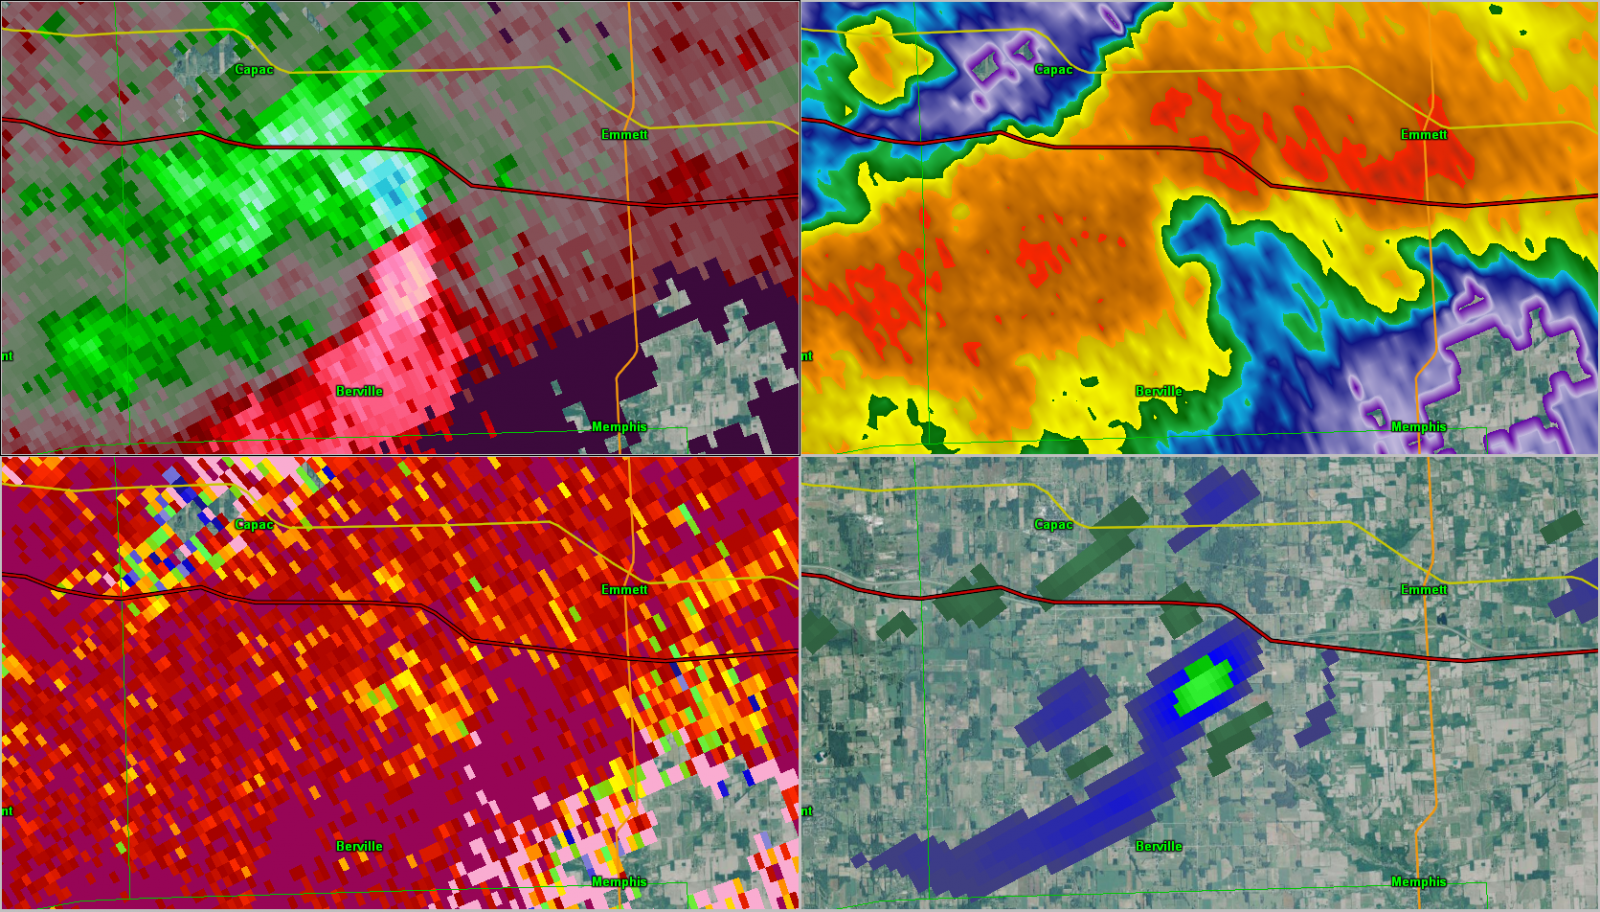
Radar snapshots during the tornadoes - Clockwise from upper right: base reflectivity, normalized rotation (nrot), correlation coefficient, storm-relative velocity. All data from the 0.5 degree scan. Times listed refer to the time of the radar scan and may not correspond exactly to tornado start, end, and peak intensity - check text products below for survey information. Click images for larger version.
Saginaw/Tuscola
 |
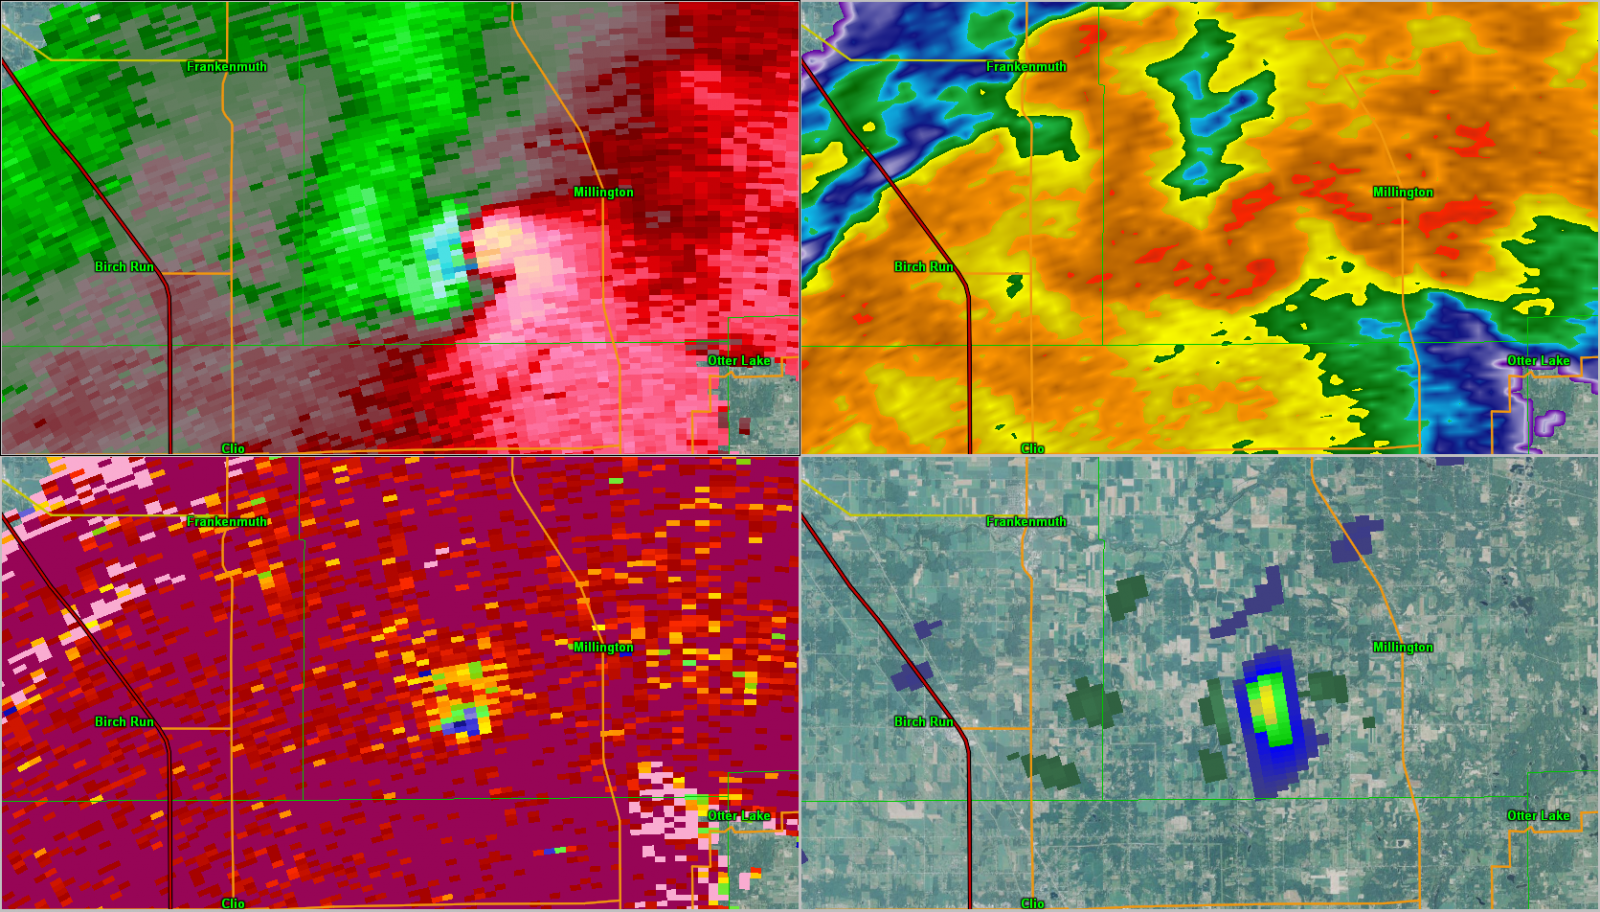 |
| Start of tornado - 10:01 pm | Peak intensity (EF2) - 10:08 pm |
 |
|
| End of tornado - 10:17 pm |
Sanilac
 |
 |
| Start of tornado - 10:08 pm | Peak intensity (EF1) - 10:10 pm |
 |
 |
| 10:25 pm - EF0 | End of tornado - 10:44 pm |
Washtenaw
 |
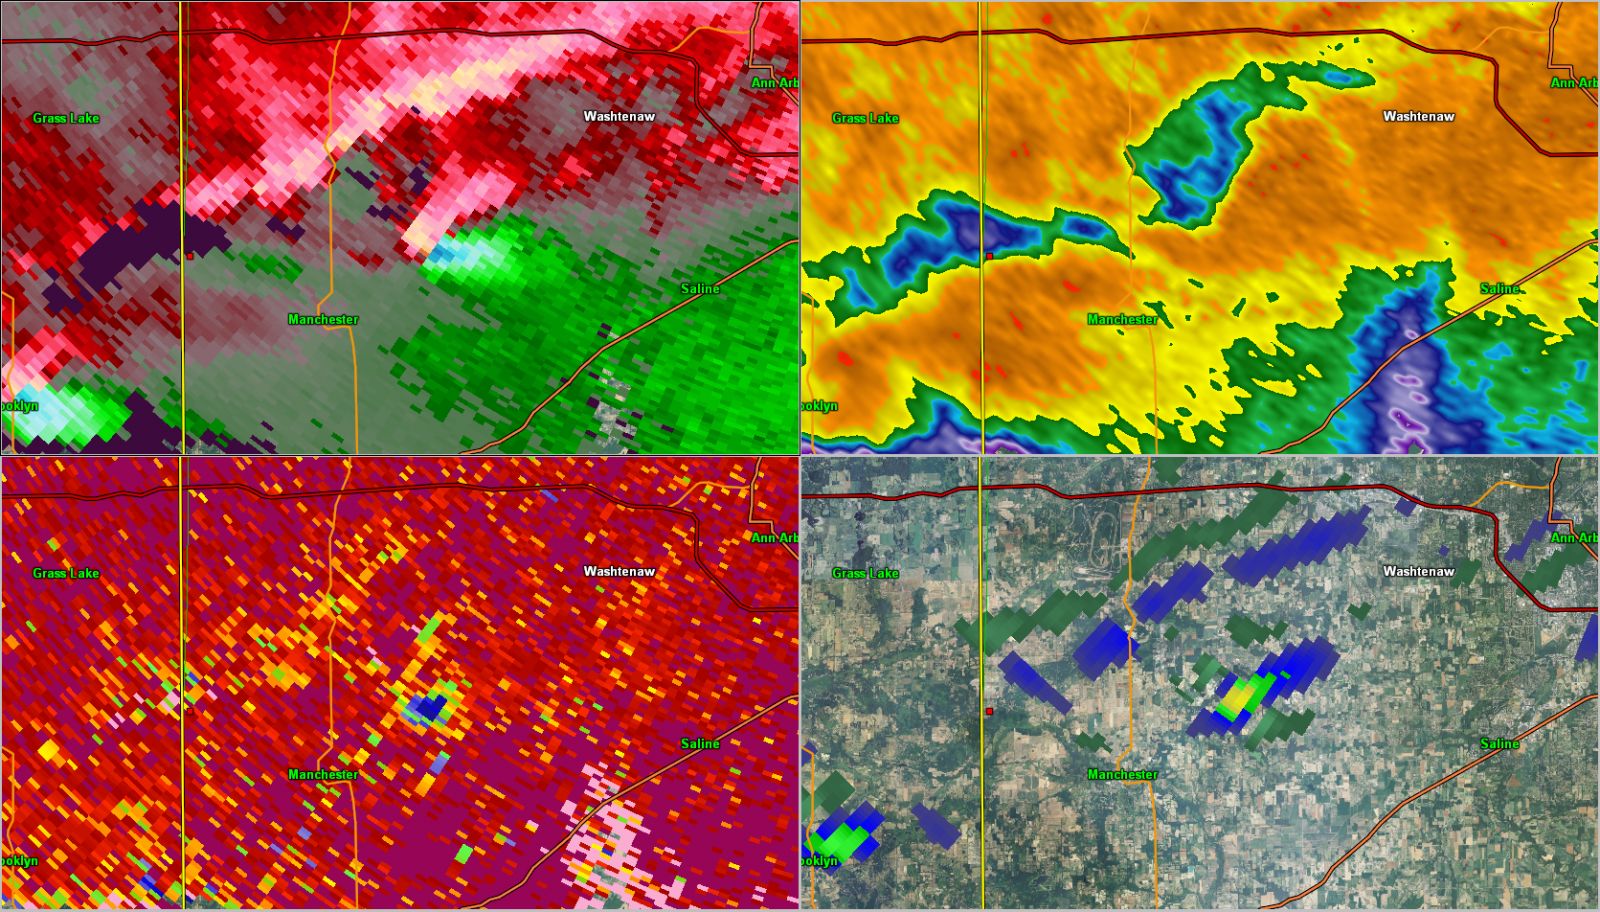 |
| Start of tornado - 1:29 am | Peak intensity - 1:34 am |
 |
|
| End of tornado - 1:37 am |
St. Clair
 |
| 11:55 pm - EF0 |
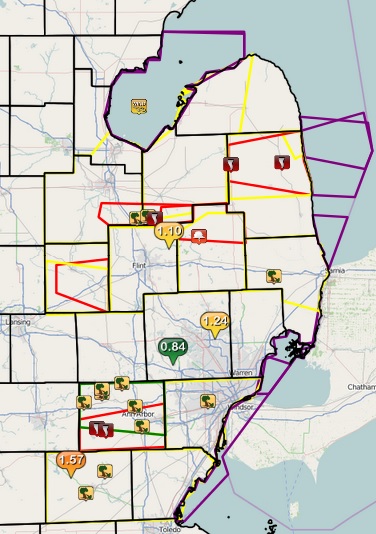
Preliminary LSR map (will be updated as more information becomes available)
|
|
| Image courtesy of Iowa Environmental Mesonet (IEM). Local Storm Reports (LSR) are also shown plotted on the map. |
|
|
Back to top
Preliminary Damage Survey Information
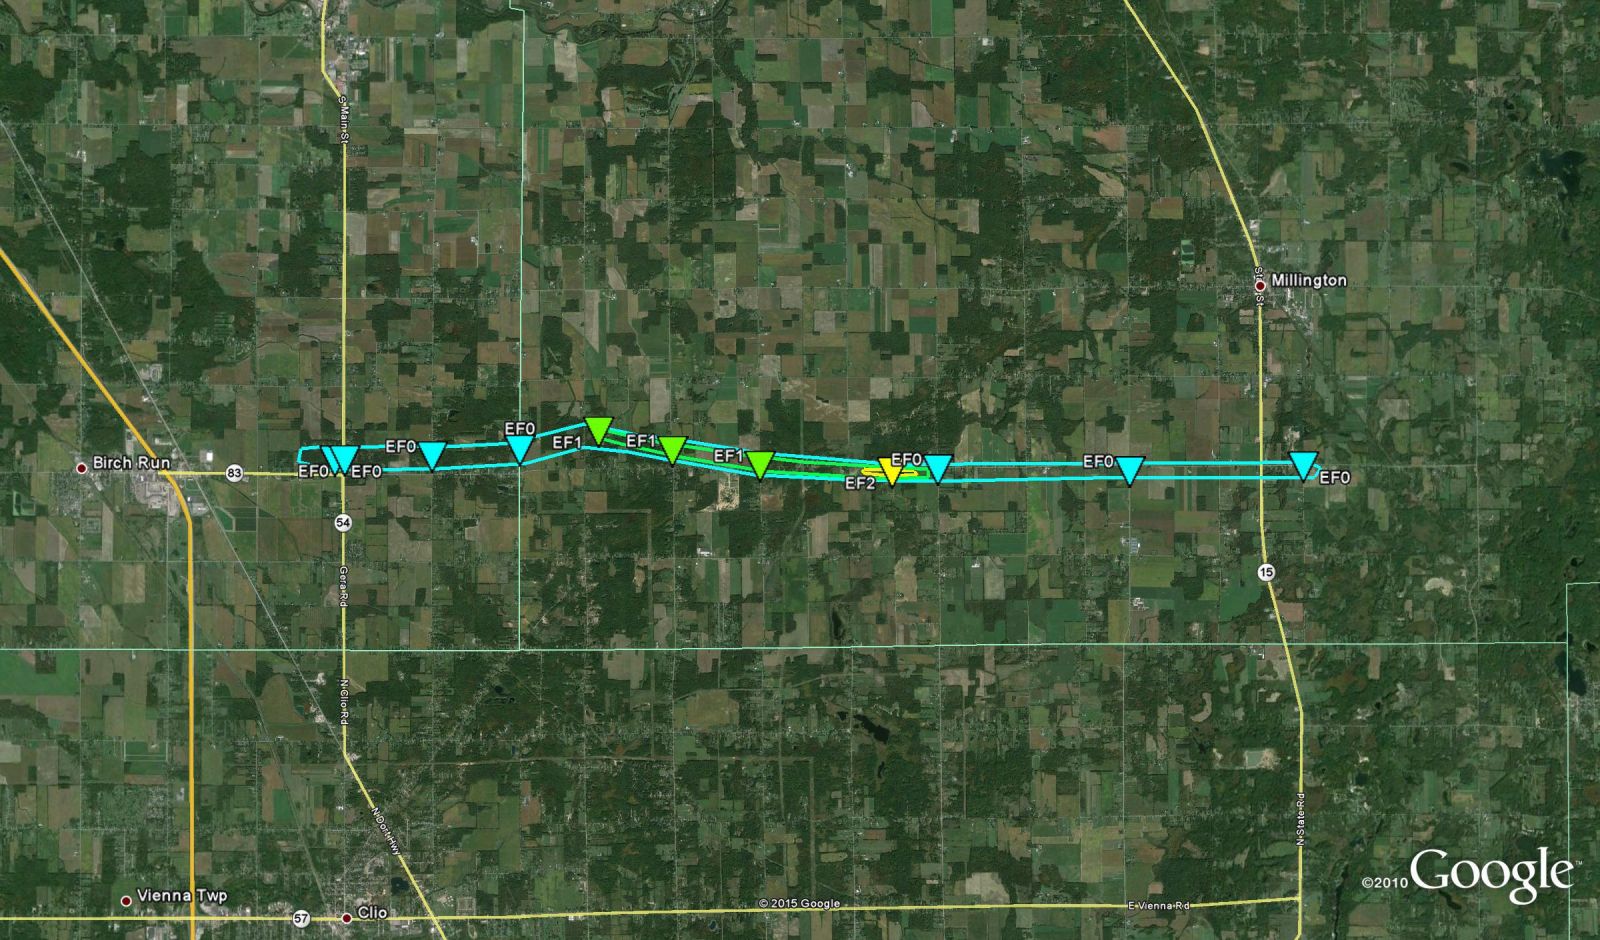
EF2 Tornado Confirmed in Saginaw and Tuscola Counties
EF1 Tornado Confirmed in Sanilac County
EF1 Tornado Confirmed in Washtenaw County
EF0 Tornado Confirmed in St Clair County
Tornado Tracks (Click on thumbnail for bigger image)
 |
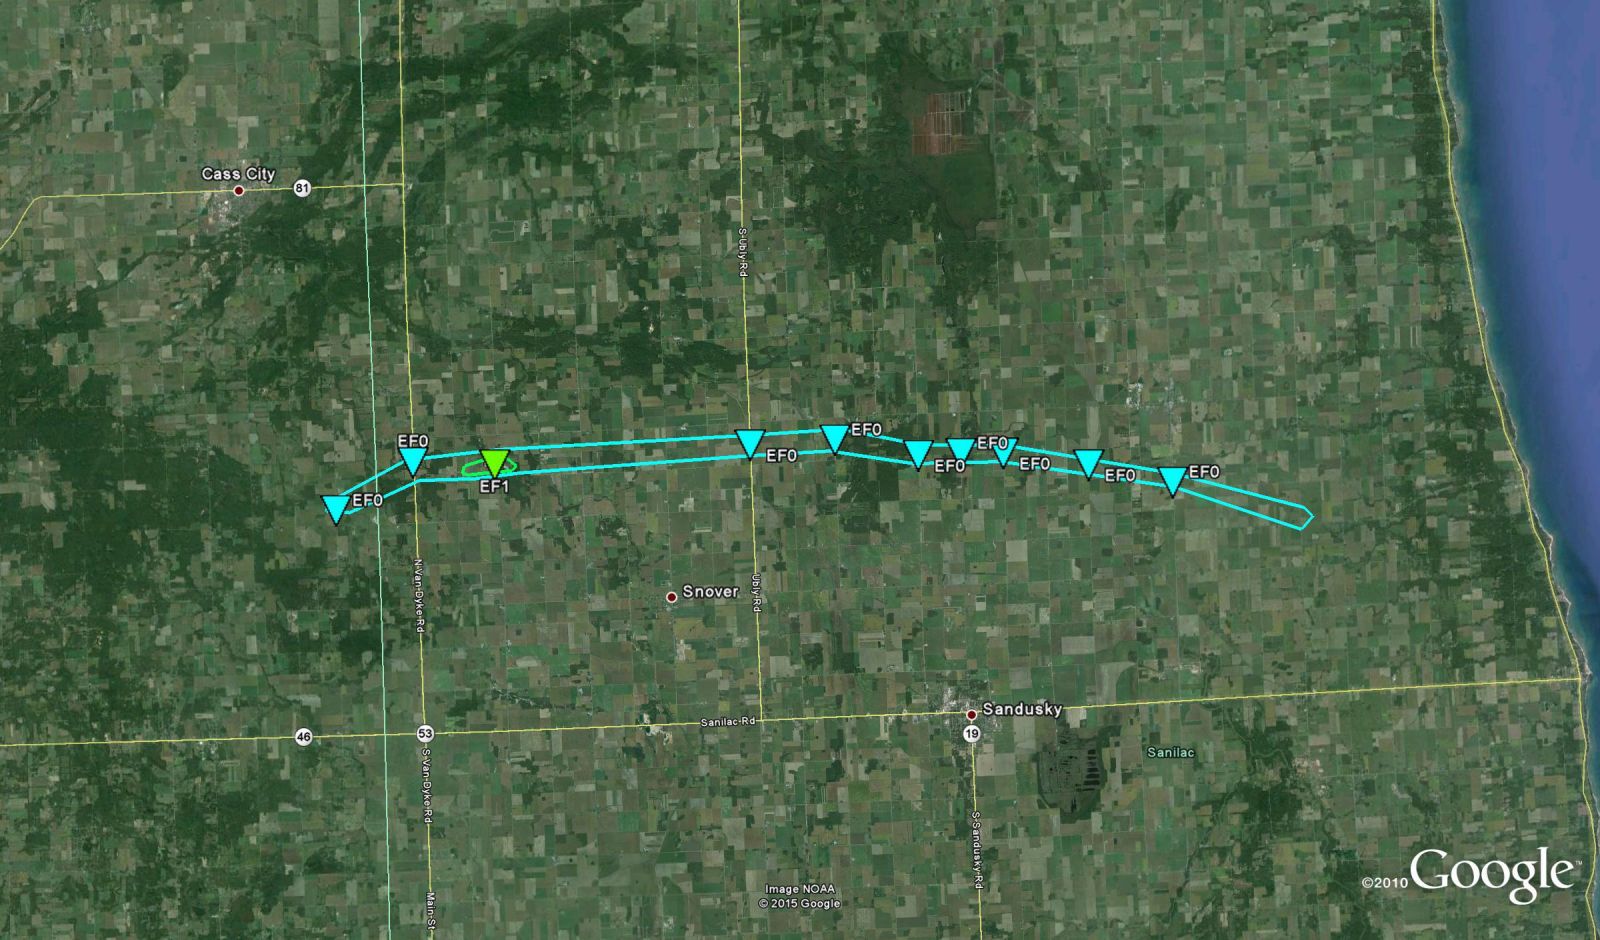 |
| Saginaw/Tuscola EF2 | Sanilac EF1 |
 |
 |
| Washtenaw EF1 | St. Clair EF0 |
SPC Products (More details can be found by clicking on the images)
 |
||
 |
 |
|
 |
 |
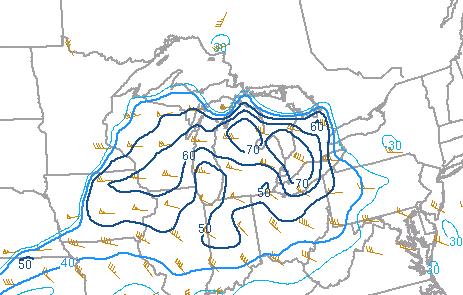
A seasonably strong jet stream was located across the northern tier of the US on June 22 (Fig. 1). Upper level winds increased over Southeast Michigan by the evening of the 22nd as the strongest portion of the jet approached. This led to impressive deep-layer shear of 50-70 knots (Fig. 2) which was supportive of supercell thunderstorms.
At lower levels of the atmosphere, a seasonably strong surface low strengthened in the poleward exit region of the jet over Lake Superior (Fig. 3). This strengthened moisture advection at lower levels into Southeast Michigan and allowed the atmosphere to remain convectively unstable despite boundary-layer cooling after nightfall. In fact, the cooling process became favorable for tornado development allowing LCL heights to lower with temperatures and dewpoints both remaining in the 70s Figs 4, 5).
Wind profiles were very favorable for tornado development, with a 40 kt low-level jet at 925 mb (Fig. 6). The 00Z KDTX sounding showed both good directional and speed shear in the low-levels of the atmosphere (Fig. 7) with a strongly-curved hodograph (Fig. 8). Storm-relative helicity values were 300-500 m^2/s^2 (Fig. 9). The 00Z sounding did reveal a cap at around 850 mb, but significant instability still existed with mixed-layer CAPE values of 1000-2500 J/kg across southeast Michigan. The cap was likely weaker over mid-Michigan where storms were able to form along a subtle pre-frontal trough with lift enhanced by upper-level height falls.
As these storms tracked into the Saginaw Valley/Thumb area, they entered the aforementioned environment and evolved into a broken line of supercells, a couple of which produced the tornadoes over Saginaw, Tuscola, and Sanilac County. Eventually the forcing worked its way across the entire CWA, and the environment continued to support a few supercells including the storms that produced the Washtenaw and St. Clair County tornadoes. Additionally, the strong low-level wind field supported damaging straight-line winds, of which there were isolated reports over Washtenaw, Wayne, and Lenawee Counties.
 |
 |
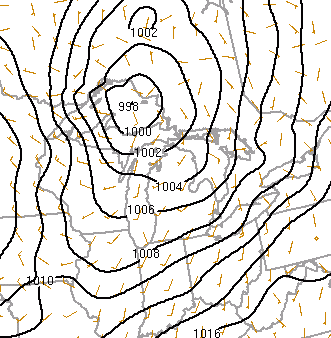 |
| Fig. 1. 300 mb RAOBs, isotachs, streamlines, divergence, valid 00Z 23 June (8 pm June 22) | Fig. 2. RAP 1-hr forecast of effective bulk shear magnitude (contours, kt) and vector (barbs) valid 00Z 23 June (8 pm June 22) | Fig. 3. RAP 1-h forecast of MSLP (contours, hPa) and surface wind (barbs) valid 02Z 23 June (10 pm June 22) |
 |
 |
 |
| Fig. 4. WPC surface analysis valid 00Z 23 June (8 pm June 22) | Fig. 5. WPC surface analysis valid 03Z 23 June (11 pm June 22) | Fig. 6. 925 mb RAOBs, heights, temps, dewpoints, valid 00Z 23 June (8 pm June 22) |
 |
 |
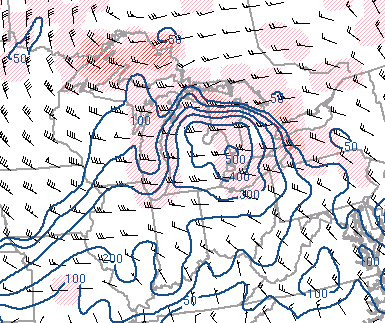 |
| Fig. 7. 00Z 23 June KDTX sounding (8 pm June 22). Courtesy University of Wyoming1 | Fig. 8. 00Z 23 June KDTX hodograph (8 pm June 22). Courtesy University of Wyoming1 | Fig. 9. RAP 1-h forecast of storm-relative effective helicity (contours, m^2/s^2) and storm motion (barbs) valid 00Z 23 June (8 pm June 22). |
1 Obtained from https://weather.uwyo.edu/upperair/sounding.html