River levels are abnormally high for this time of year across much of the Upper Mississippi River Valley region. Although many rivers are either observing ongoing flooding, or are still forecast to reach flood levels, river flooding is not a normal phenomenon during the winter months. There are 2 main reasons for this:
Antecedent conditions play a large part in why river levels will reach flood stage. Multiple heavy rain events have occurred in this winter, with much of the area also seeing one instance of heavy snow. Following the snow, warm temperatures caused a quick melt of the snow, and with the additional rains the ground has become very saturated. This means when it rains the water will runoff into the rivers rather than soaking into the ground. This would be similar to what happens with rain that falls on concrete, or on frozen ground.
The amount of rain that has fallen so far in December far exceeds the amounts that are normal for this time of year. The images below show the rainfall totals from December 13 & 14 and the departure from normal of precipitation for the month of December (through December 17th). This shows that much of Iowa and Wisconsin have seen amounts greater than 1 inch above normal, with some areas seeing in excess of 4 inches above normal.
| 48-hour Observed Rainfall, 12/13 -12/14 | December Precipitation Departure from Normal |
|
|
 |
Prior to December 13th, most rivers in the area were still running at high levels from the previous events, and with the rain that fell the 13th and 14th almost entirely becoming direct runoff due to the saturated soils, many areas saw the rivers rise significantly.
How do these flows compare to historical levels?
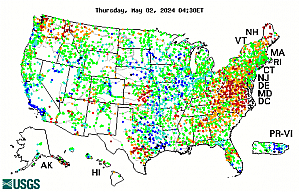
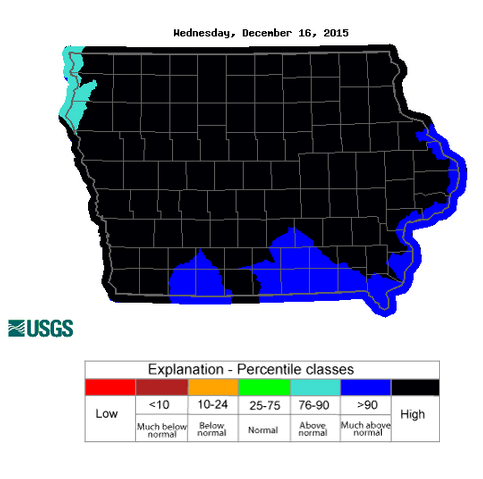
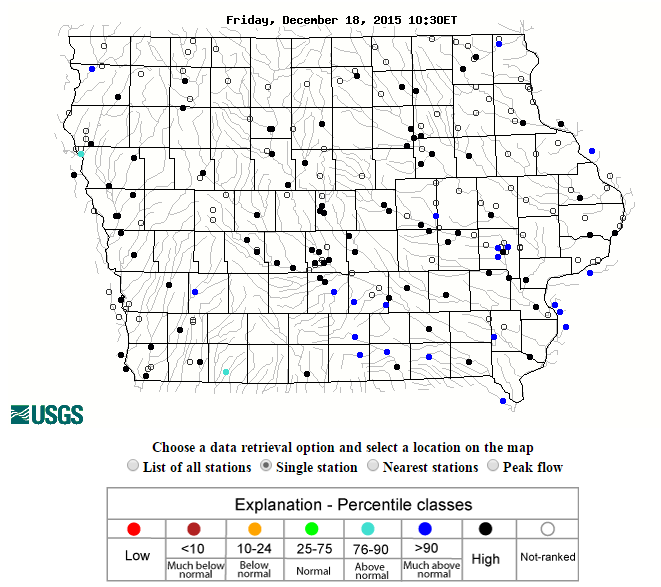
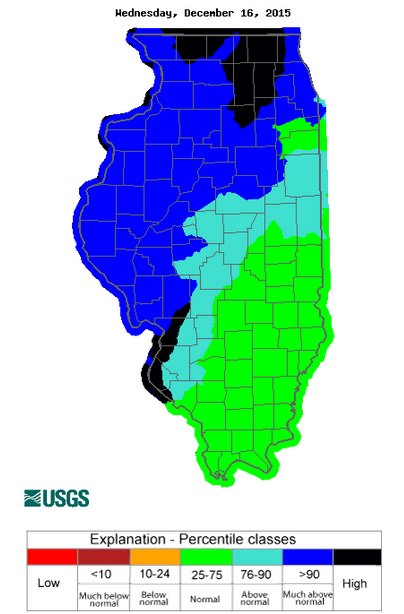
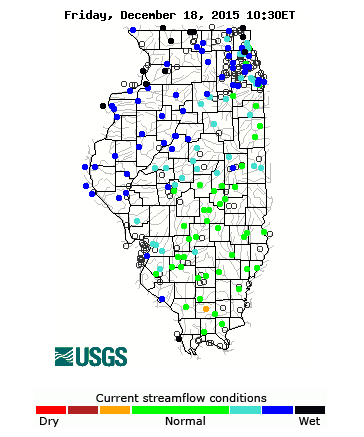
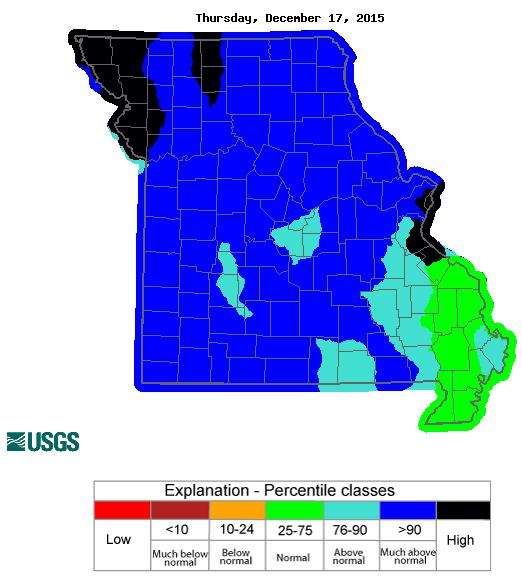
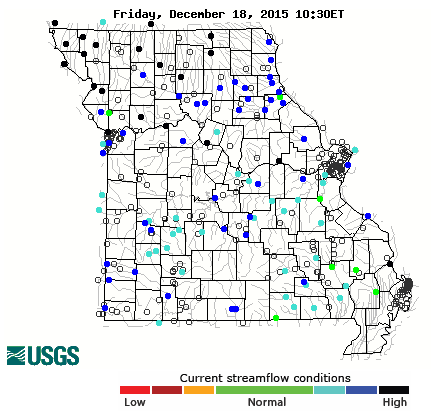
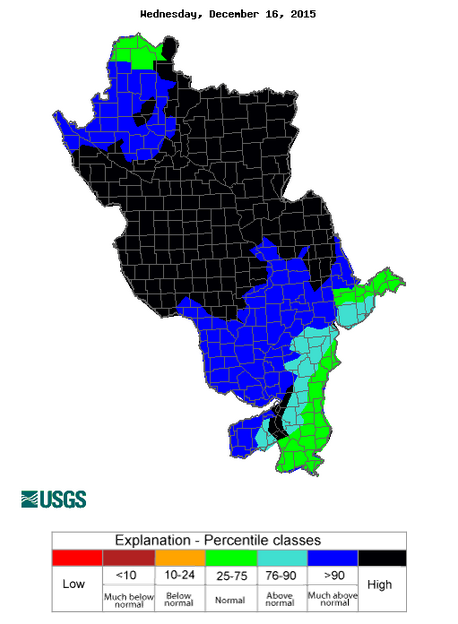
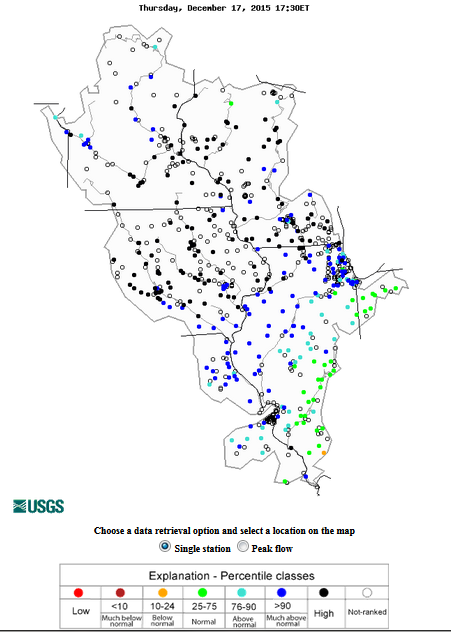
Data from the US Geological Survey shows comparisons of the current situation to historical conditions. When comparing the current streamflows with what has occurred historically in December, the entire local area is observing streamflows near or above record levels. Simply, this means since records have been kept, most area rivers have not observed flows this high in December.
| Iowa | Illinois | Missouri | Upper Mississippi River Region | ||||||||
|
|
|
|
Images courtesy of www.watermonitor.gov / www.waterwatch.usgs.gov
Details of the most current crest flows compared to historical values for some specific river forecast points can be found in the table below. Locations highlighted in cyan are those that have exceeded historical flows for the month of December. The data is preliminary and is provided from the US Geological Survey.
| Location | Period of Record | Historical Dec Peak Streamflow | 2015 Dec Peak Streamflow | Crest Date |
Associated Gage Height |
| Wapsipinicon River at Independence | 1933-2015 | 3,780 cfs | 11,500 cfs | 12/15/15 | 12.32 ft |
| Wapsipinicon River at Anamosa | 2002-2015 | 3,240 cfs | 11,800 cfs | 12/17/15 | 16.6 ft |
| Wapsipinicon River at Dewitt | 1934-2015 | 11,100 cfs | 17,200 cfs | 12/22/15 | 12.97 ft |
| Maquoketa River at Manchester | 2000-2015 | 1,320 cfs | 4,300 cfs | 12/15/15 |
12.8 ft |
| Maquoketa River at Maquoketa | 1913-2015 | 17,000 cfs | 9,430 cfs | 12/15/15 | 21.22 ft |
| Skunk River at Sigourney | 1945-2015 | 3,600 cfs | 9,070 cfs | 12/16/15 | 21.1 ft |
| Skunk River at Augusta | 1914-2015 | 21,400 cfs | 23,700 cfs | 12/23/15 | 15.83 ft |
| Cedar River at Vinton | 2009-2015 | 7,290 cfs | 28,400 cfs | 12/17/15 | 13.51 ft |
| Cedar River at Cedar Rapids | 1902-2015 | 17,600 cfs | 33,000 cfs | 12/18/15 | 11.78 ft |
| Cedar River at Conesville | 1939-2015 | 18,700 cfs | 32,900 cfs | 12/21/15 | 14.63 ft |
| Iowa River at Marengo | 1956-2015 | 6,730 cfs | 18,300 cfs | 12/18/15 | 18.18 ft |
| Iowa River at Iowa City | 1958-2015 | 6,820 cfs | 11,100 cfs | 12/21/15 | 19.96 ft |
| Iowa River at Lone Tree | 1958-2015 | 13,000 cfs | 18,000 cfs | 12/16/15 | 16.38 ft |
| Iowa River at Wapello | 1958-2015 | 29,300 cfs | 42,100 cfs | 12/22/15 | 22.30 ft |
| Iowa River at Oakville | 2009-2015 | 27,100 cfs | 43,000 cfs | 12/23/15 | 11.61 ft |
| English River at Kalona | 1939-2015 | 4,960 cfs | 11,100 cfs | 12/15/15 | 18.75 ft |
| Des Moines River at Keosauqua | 1969-2015 | 30,400 cfs | 55,000 cfs | 12/14/15 | 22.81 ft |
| Fox River at Wayland | 1922-2014 | 9,420 cfs | 6,240 cfs | 12/14/15 | 14.45 ft |
With the high streamflows, flooding is occurring in many areas, please see the NWS Advanced Hydrologic Prediction Service for details of latest observations and forecasts for a river in your area.
Additional information is available from the US Geological Survey at waterwatch.usgs.gov.
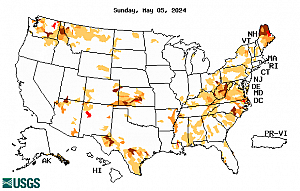
| Current Streamflow | Drought |
 |
 |
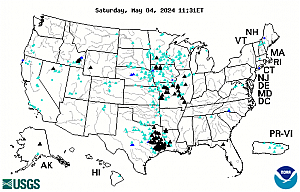
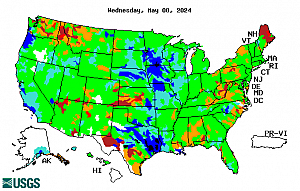
| Flood | Past Flow/Runoff |
 |
 |


.png)
 Follow us on YouTube