The information below is designed to provide freeze and frost information to those with temperature sensitive applications or needs. The top section provides operational forecasts and observations, while the lower half provides climatological probabilities and historical perspectives.
|
|
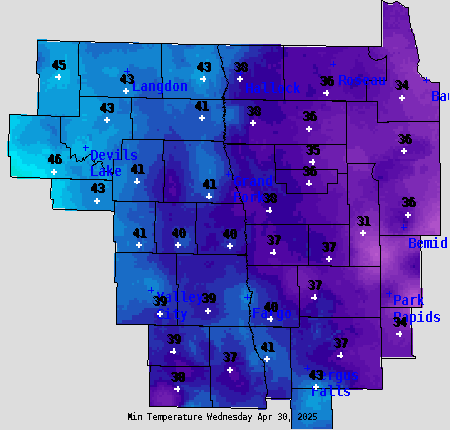
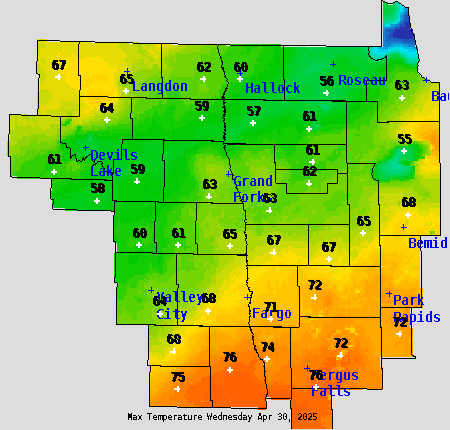
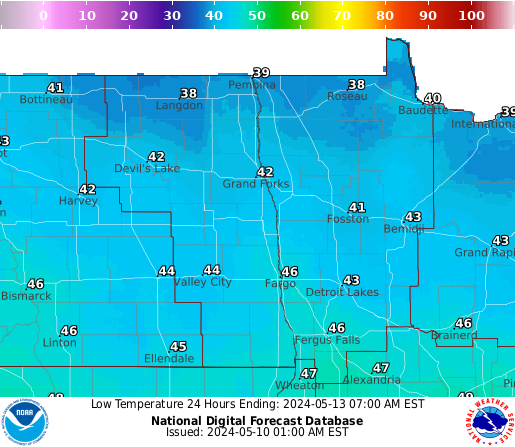
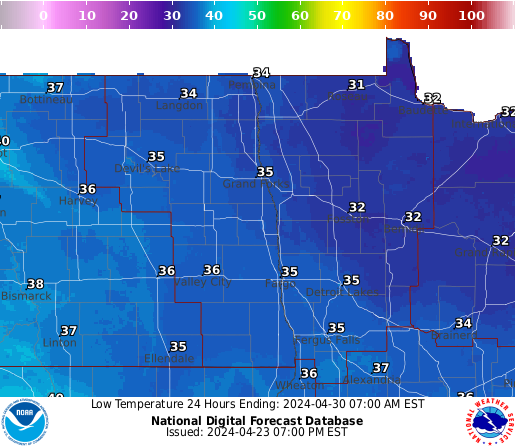
7-Day Minimum Temperature Forecasts |
|
|
|
|
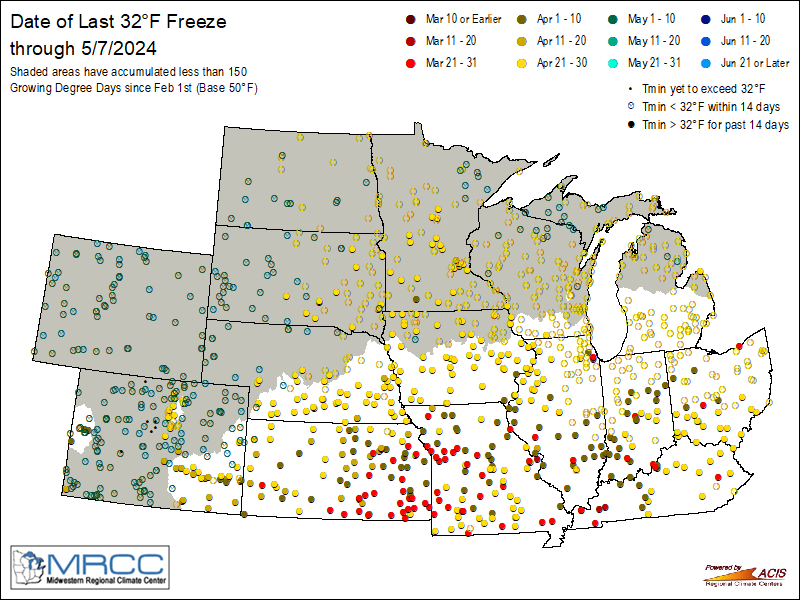
| The maps below are courtesy of The Midwestern Regional Climate Center. |
 |
 |
 |
 |
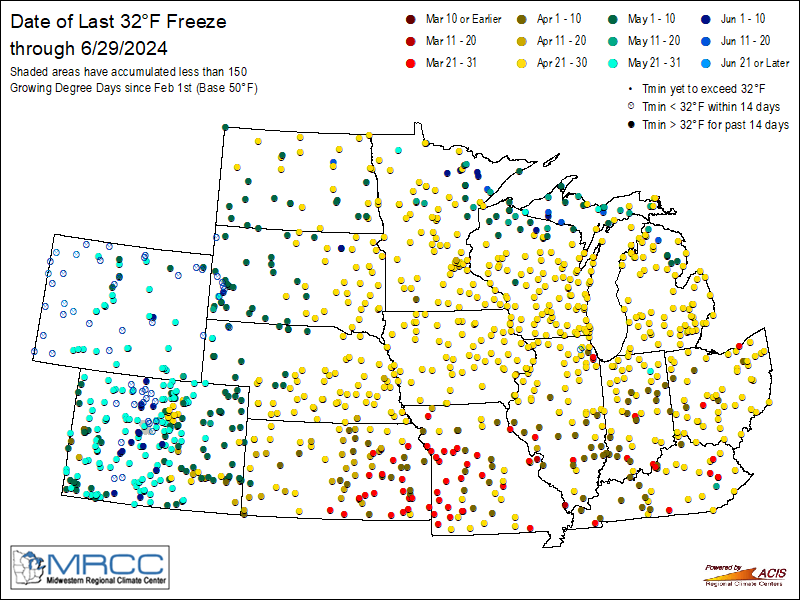
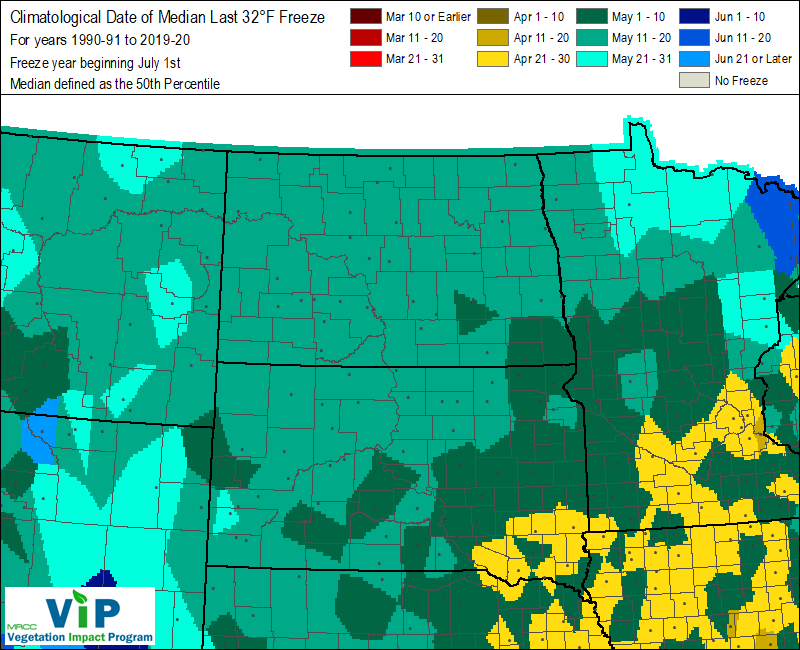
| Last 32° Freeze Map - SPRING |
Date of Median Last 32° Freeze
Based on 1991-2020 Average |
Last 28° Freeze Map - SPRING |
Date of Median Last 28° Freeze
Based on 1991-2020 Average |
 |
 |
 |
 |
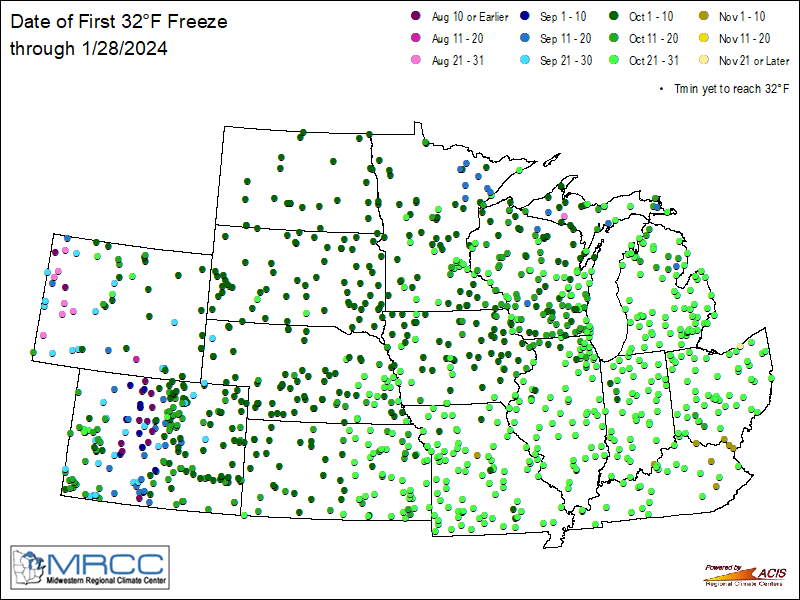
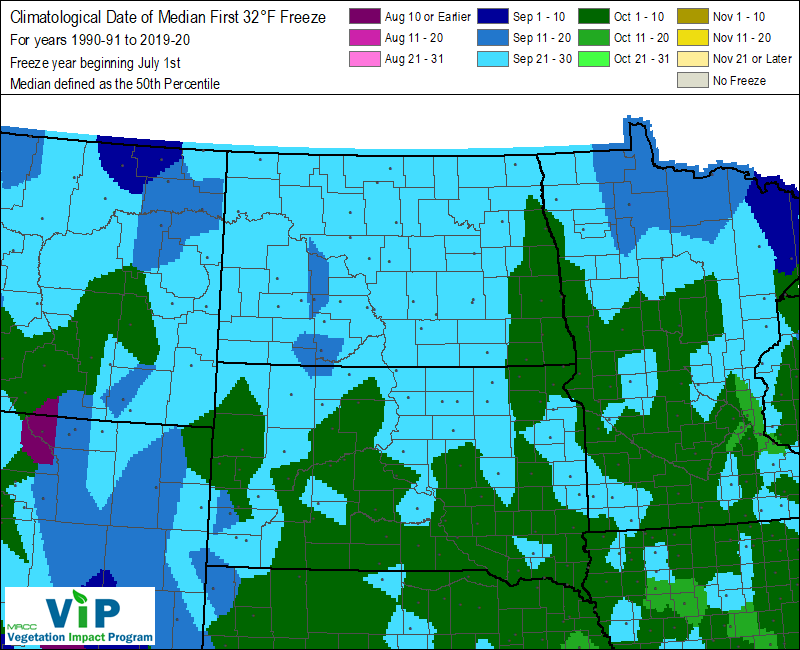
| First 32° Freeze Map - FALL |
Date of Median First 32° Freeze
Based on 1991-2020 Average |
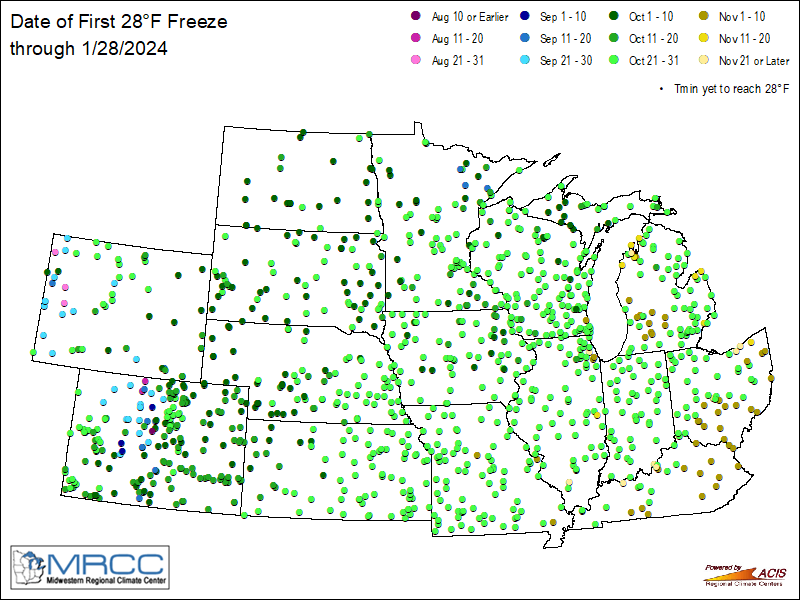
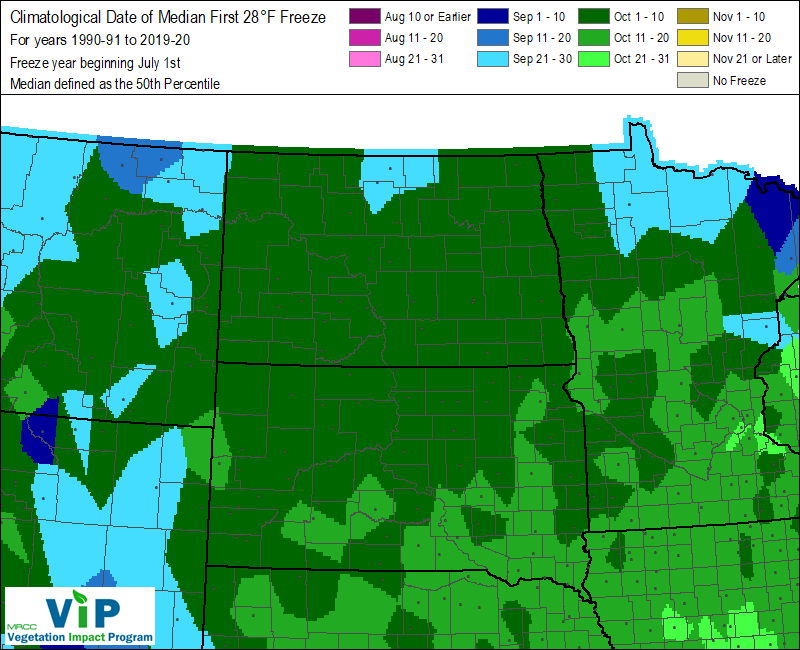
First 28° Freeze Map - FALL |
Date of Median First 28° Freeze
Based on 1991-2020 Average |
Earliest and Latest "Freeze" Occurrences from 1991 to 2020. |
 |
 |
 |
 |
| Date of Earliest Last 32° Freeze |
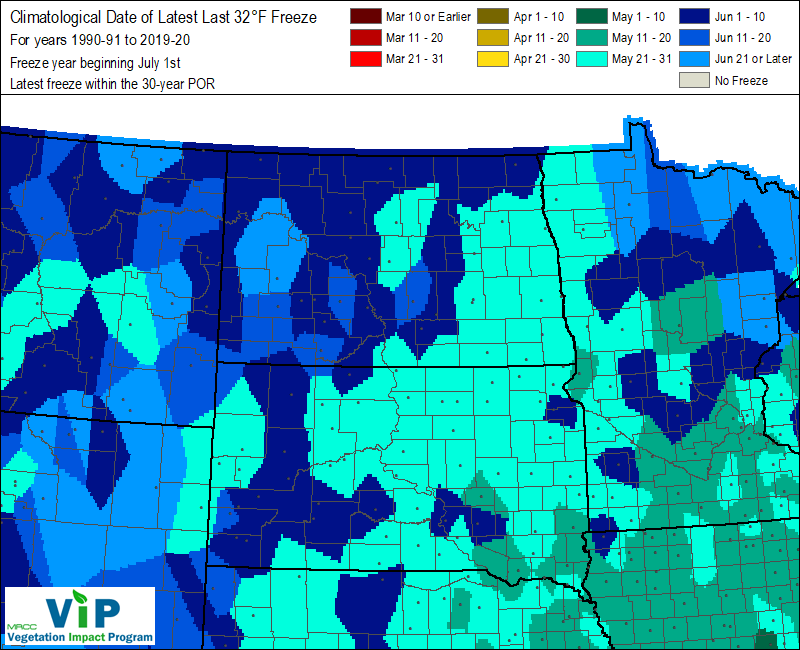
Date of Latest Last 32° Freeze |
Date of Earliest Last 28° Freeze |
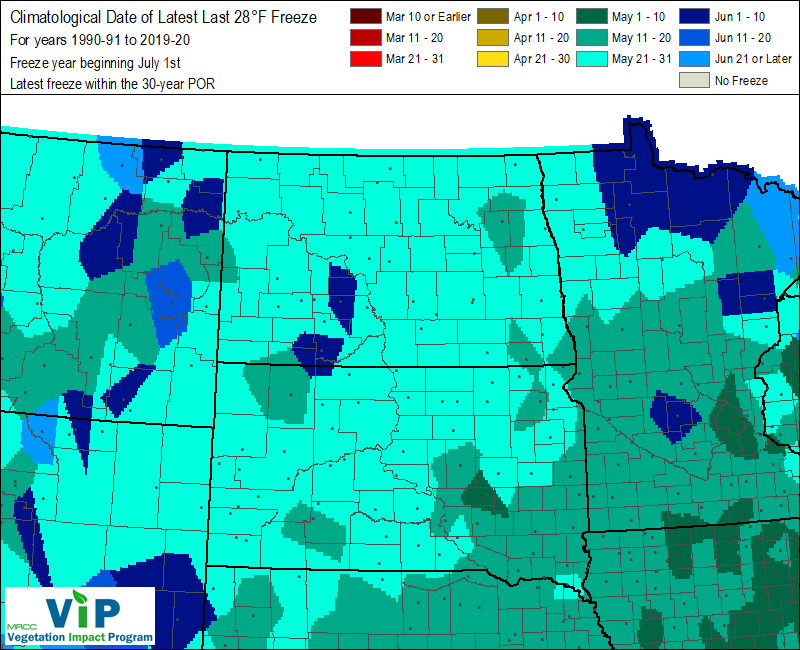
Date of Latest Last 28° Freeze |
|
The information in the tables below represent the average dates on which the prescribed temperatures occurred - the climatological average first or last frost and freeze dates. Many variables dictate the actual first frost or freeze, including cloud cover, wind speed, soil moisture and location of the temperature sensor. Some temperature reporting sites are located in town while some are more rural. Sites in town tend to experience frosts and freezes a little later in the year, while rural sites tend to see frosts and have freezing temperatures a bit earlier. Based on 1991 - 2020 data.
| Climatological Freeze / Frost Date Information |
Fall Average Date of first Frost, Freeze or Hard Freeze at selected locations |
Spring Average Date of last Frost, Freeze or Hard Freeze at selected locations |
| North Dakota |
36F |
32F - 28F |
<=28F |
36F |
32F-36F |
<=28F |
| Casselton Agronomy Farm |
September 20 |
September 29 |
October 5 |
May 16 |
May 12 |
April 27 |
| Cavalier 7NW |
September 16 |
September 28 |
October 9 |
May 21 |
May 12 |
May 6 |
| Colgate |
September 18 |
September 24 |
October 4 |
May 20 |
May 7 |
May 2 |
| Cooperstown 5E |
September 9 |
September 20 |
September 25 |
May 25 |
May 15 |
May 8 |
| Devils Lake / KDLR |
September 22 |
September 28 |
October 5 |
May 19 |
May 6 |
April 21 |
| Edmore 4NW |
September 14 |
September 20 |
September 25 |
May 25 |
May 16 |
May 3 |
| Fargo Hector Field |
September 20 |
October 2 |
October 9 |
May 19 |
May 10 |
April 27 |
| Forman 5SSE |
September 22 |
October 4 |
October 7 |
May 14 |
May 2 |
April 22 |
| Grand Forks Airport |
September 17 |
September 28 |
October 6 |
May 25 |
May 14 |
May 2 |
| Hansboro 4NNE |
September 9 |
September 17 |
September 30 |
June 4 |
May 21 |
May 11 |
| Langdon NDSU Experiment Station |
September 14 |
September 18 |
September 28 |
May 30 |
May 20 |
May 11 |
| Petersburg 2N |
September 18 |
September 23 |
October 2 |
May 20 |
May 13 |
May 1 |
| University of North Dakota / NWS |
September 20 |
October 1 |
October 7 |
May 19 |
May 11 |
April 29 |
| Climatological Freeze / Frost Date Information |
Fall Average Date of a Frost, Freeze or Hard Freeze at selected locations |
Spring Average Date of a Frost, Freeze or Hard Freeze at selected locations |
| Minnesota |
36F |
32F-28F |
<=28F |
36F |
32F-36F |
<=28F |
| Ada |
September 20 |
September 29 |
October 6 |
May 19 |
May 11 |
April 26 |
| Agassiz WLR |
September 18 |
September 23 |
October 2 |
May 20 |
May 10 |
April 27 |
| Argyle |
September 14 |
September 23 |
October 6 |
May 22 |
May 16 |
May 5 |
| Baudette |
September 14 |
September 24 |
October 4 |
May 26 |
May 12 |
May 3 |
| Crookston |
September 14 |
September 26 |
October 4 |
May 20 |
May 11 |
May 1 |
| Detroit Lakes |
September 14 |
September 24 |
October 9 |
May 23 |
May 13 |
May 1 |
| Fosston 1E |
September 8 |
September 19 |
September 30 |
May 26 |
May 14 |
May 4 |
| Itasca State park UMN |
September 16 |
September 23 |
October 4 |
May 30 |
May 16 |
May 7 |
| Red Lake Falls |
September 19 |
September 29 |
October 7 |
May 20 |
May 11 |
May 1 |
| Red Lake IA |
September 20 |
September 29 |
October 5 |
May 25 |
May 14 |
May 7 |
| Rothsay |
September 20 |
October 2 |
October 13 |
May 15 |
May 9 |
April 24 |
| Thorhult |
September 6 |
September 16 |
September 29 |
May 30 |
May 27 |
May 14 |
| Wadena 3S |
September 18 |
September 26 |
October 7 |
May 16 |
May 6 |
April 28 |
| Warroad |
September 15 |
September 27 |
October 4 |
May 20 |
May 11 |
May 1 |
|
NOAA's 1991-2020 Climate Normals
NOAA's National Centers for Environmental Information (NCEI, formerly NCDC) released the 1991-2020 Normals on May 4, 2021. Climate Normals are the latest three-decade averages of climatological variables, including temperature and precipitation. This new product replaces the 1991-2020 Normals product. Additional Normals products; such as frost/freeze dates, growing degree days, population-weighting heating and cooling degree days, and climate division and gridded normals; will be provided in a supplemental release at a later date.
|
|


 Follow us on YouTube