National Weather Service United States Department of Commerce
 
red flag image

West Texas Electronic Fire Weather Page

*** Red Flag Warning (RFW) and Fire Danger Statement (RFD) Criteria Page ***

*NEW* Modified Red Flag Threat Index (RFTI Mod) Page *NEW*

texas flag image
fire triangle image


The potential for extreme fire behavior is governed by three factors:


1) climatic and short-term weather ------------->
2) topography
3) state of vegetative fuels

relative humidity
wind speed

temperature
precipitation
instability
changes in the wind


wildfire occurrences versus wind speed and relative humidity
Plot of wildfire starts by time of day.
Plot of significant wildfire starts/outbreaks vs. time of year.
 
 
Graph of wildfire start time after red flag criteria was met
Fire start occurence relative to overnight humidity recovery.
Graph displaying departure of maximum temperature given a fire start.
 
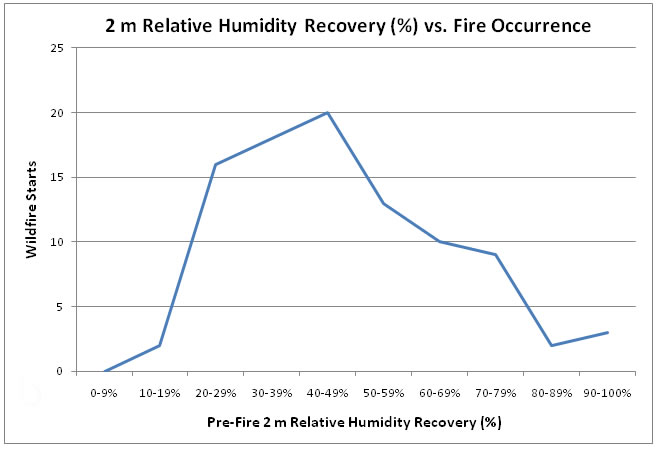
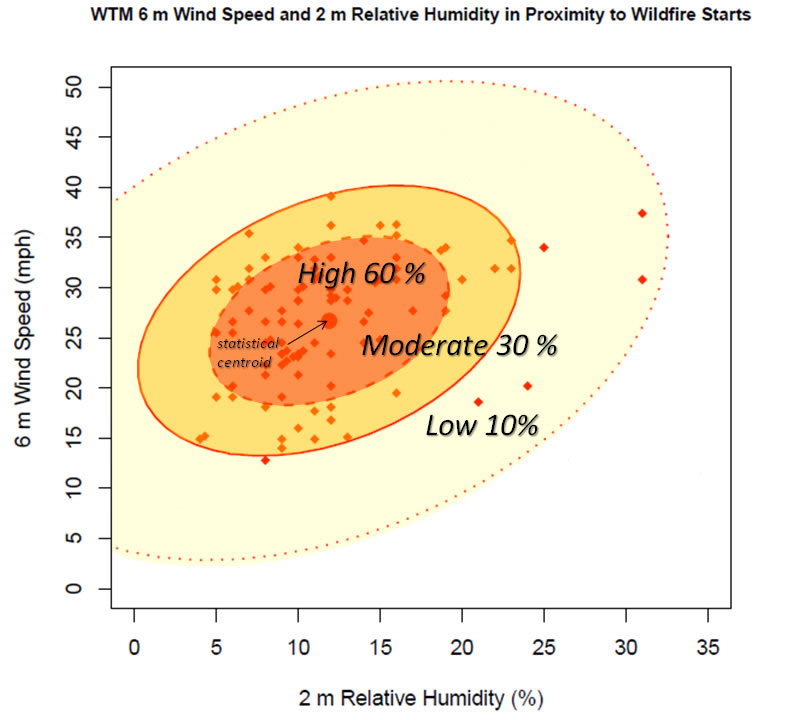
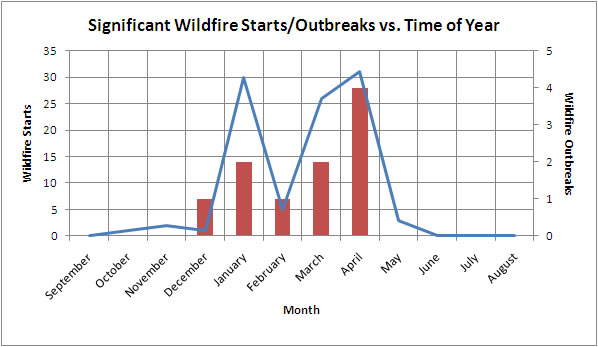
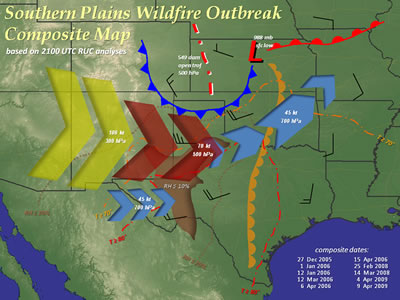
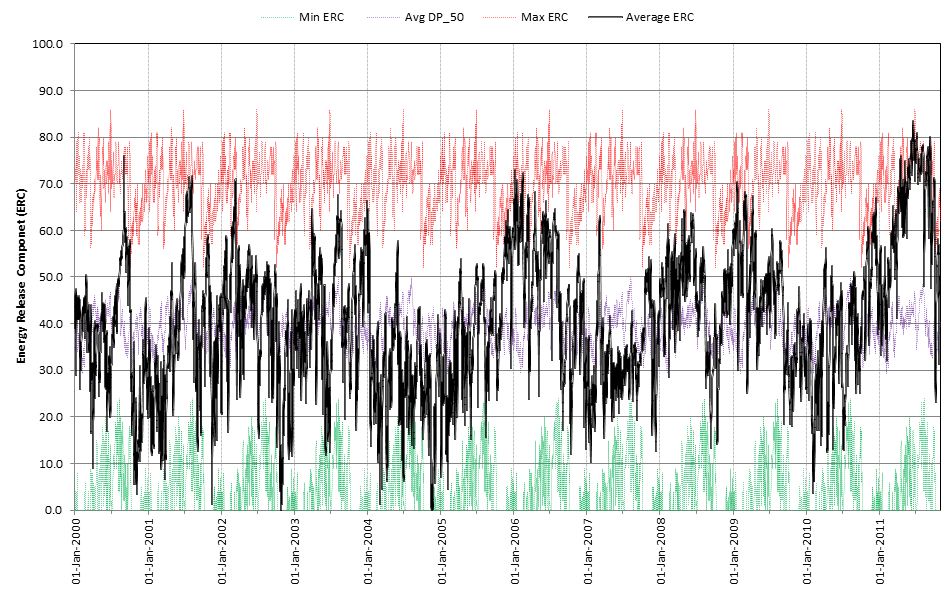
  Statistical analyses of wind-driven wildfire starts relative to proximity weather conditions within the West Texas Mesonet domain. Click each graphic to view a full-resolution image. CLICK HERE to be directed to the E-Journal of Severe Storms Meteorology article entitled, "Proximity Meteorological Observations for Wind-driven Grassfire Starts on the Southern High Plains", on which the above information is based.  
 
Composite weather pattern associated with extreme fire weather events in the Southern Plains.

Fuels and Fire Danger Resources:

SPC Fire Weather Outlooks

Today’s Forecast Fire Danger Rating

Texas Fuel Dryness Map

One Hour Fuel Moisture Map

Forecast Texas Fire Danger (100hr & ERC)

Texas Energy Release Component (Percentile)

Vegetation Drought Response Index (CONUS)

Drought Monitor for Texas (CONUS view)

TTU West Texas Mesonet Red Flag Page

Fuels/Fire Danger from the TX Interagency Coordination Center

Hot-Dry-Windy Index (HDWI)

SOOConWest 2018 Fire Headlines Experiment  

Composite weather pattern associated with extreme fire weather events in the Southern Plains. Click the graphic to view a full-resolution image and explanation. To view specific statistics about each fire weather case included in the study CLICK HERE. To view the full articles that further explain the wildfire outbreak pattern CLICK HERE

Energy Release Component (ERC) data for western Texas displayed from 1 January 2005 through 1 November 2011. Displayed is the average ERC value ("Average ERC" in black), comprised of the mean ERC calculated from Lubbock, Amarillo, Midland, San Angelo and Wichita Falls combined. Also displayed is the historical maximum ("Max ERC" in red), minimum ("Min ERC" in green) and median ("Avg DP_50" in purple) ERC data for each date. Click on the graph for a larger image.

Energy Release Component (ERC) data for western Texas displayed from 1 January 2005 through 1 November 2011. Displayed is the average ERC value ("Average ERC" in black), comprised of the mean ERC calculated from Lubbock, Amarillo, Midland, San Angelo and Wichita Falls combined. Also displayed is the historical maximum ("Max ERC" in red), minimum ("Min ERC" in green) and median ("Avg DP_50" in purple) ERC value for each date. Click on the above graph for a larger image. To view a comparable graph going back to 1 January 2000 CLICK HERE. ERC graphs for all the regions of Texas can also be found FOUND HERE.
 
 
NWS Lubbock Logo  
NWS/DOC Logo