May 1, 2022 Spring and Summer Streamflow Forecasts
Upper Missouri Basin
The high elevation snow pack in the Upper Missouri Basin as of May 1
was near to above average. The snow pack in the St. Mary Basin was 130 percent,
and the Milk River Basin was 85 percent.
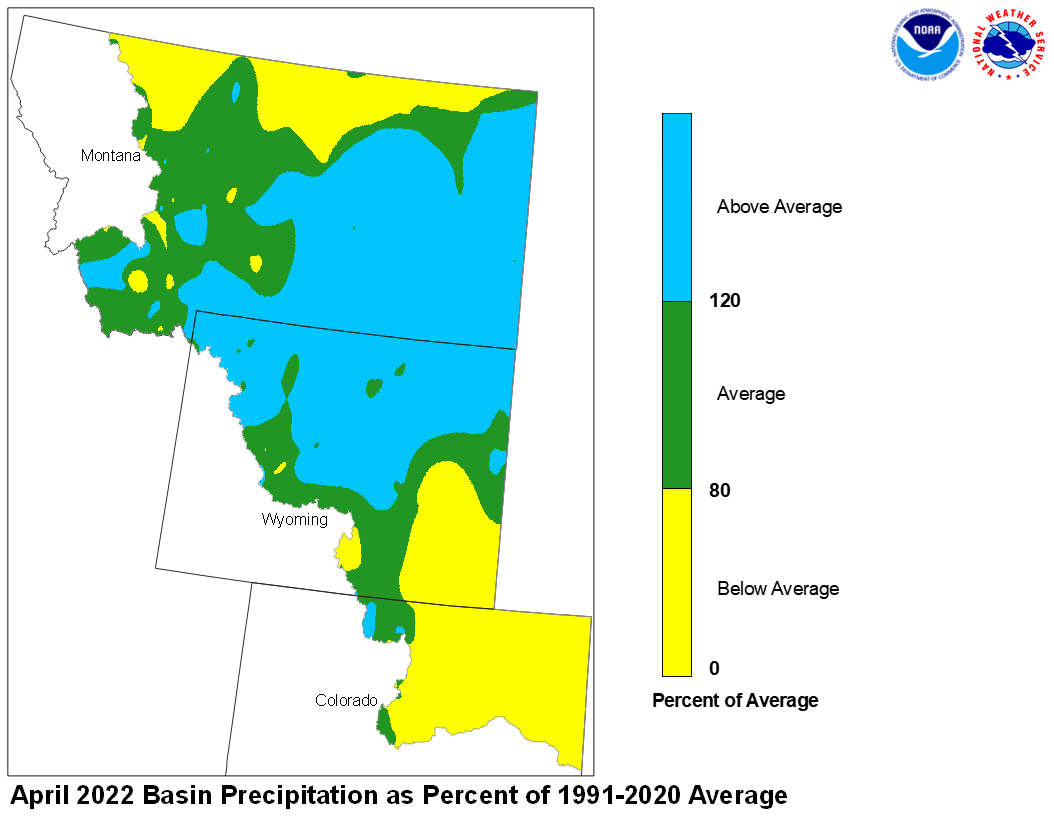
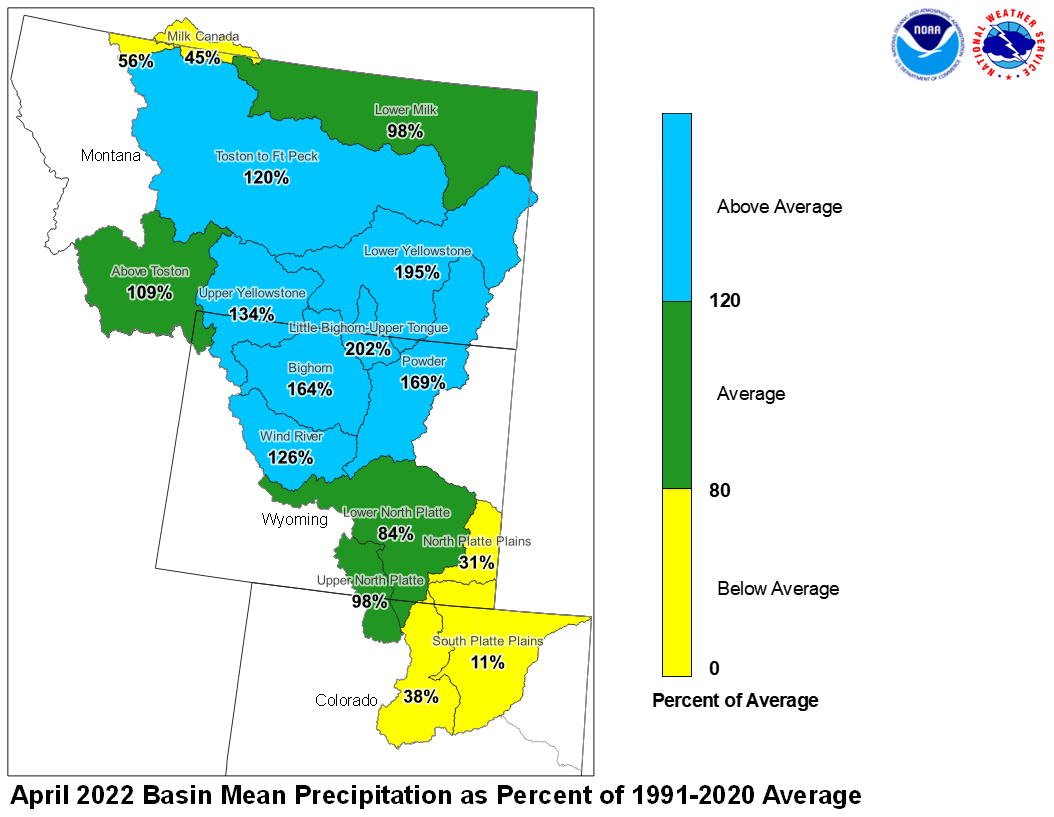
April precipitation across the Upper Missouri Basin ranged from below to above
average. Basin precipitation summaries for the Missouri Basin include: Milk St. Mary,
56 percent; Milk Canada, 45 percent; Lower Milk, 98 percent; above Toston,
109 percent; Toston to Ft. Peck, 120 percent.
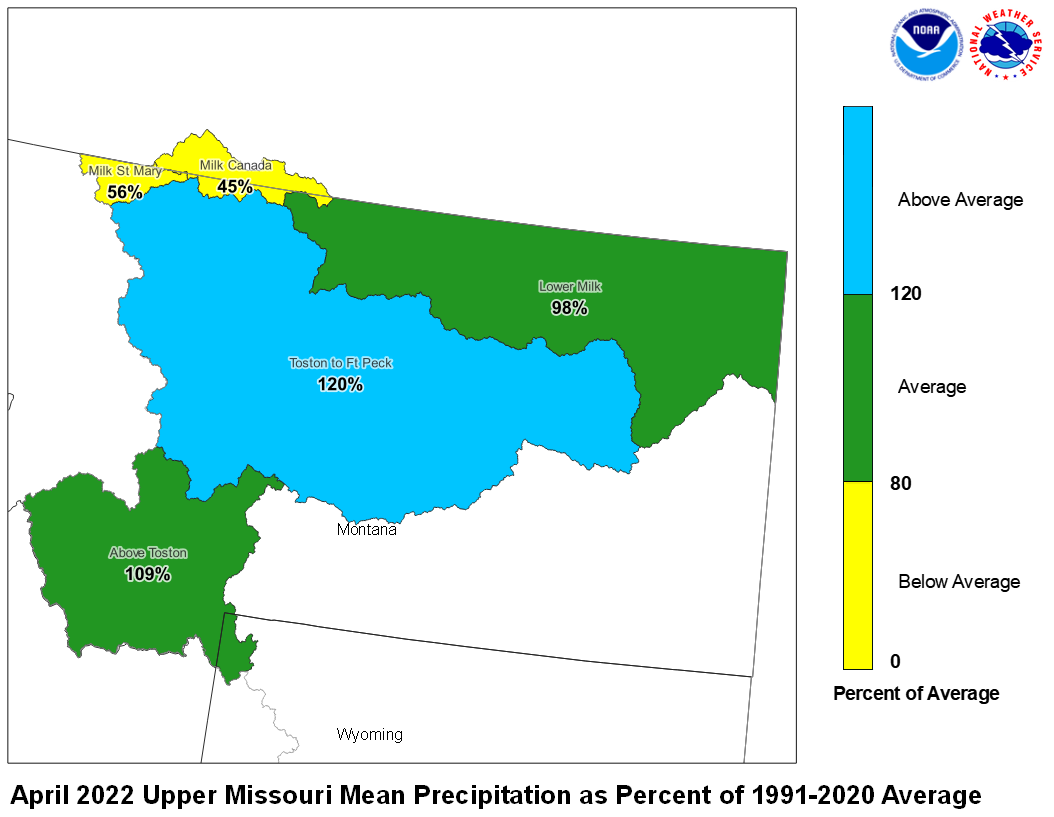
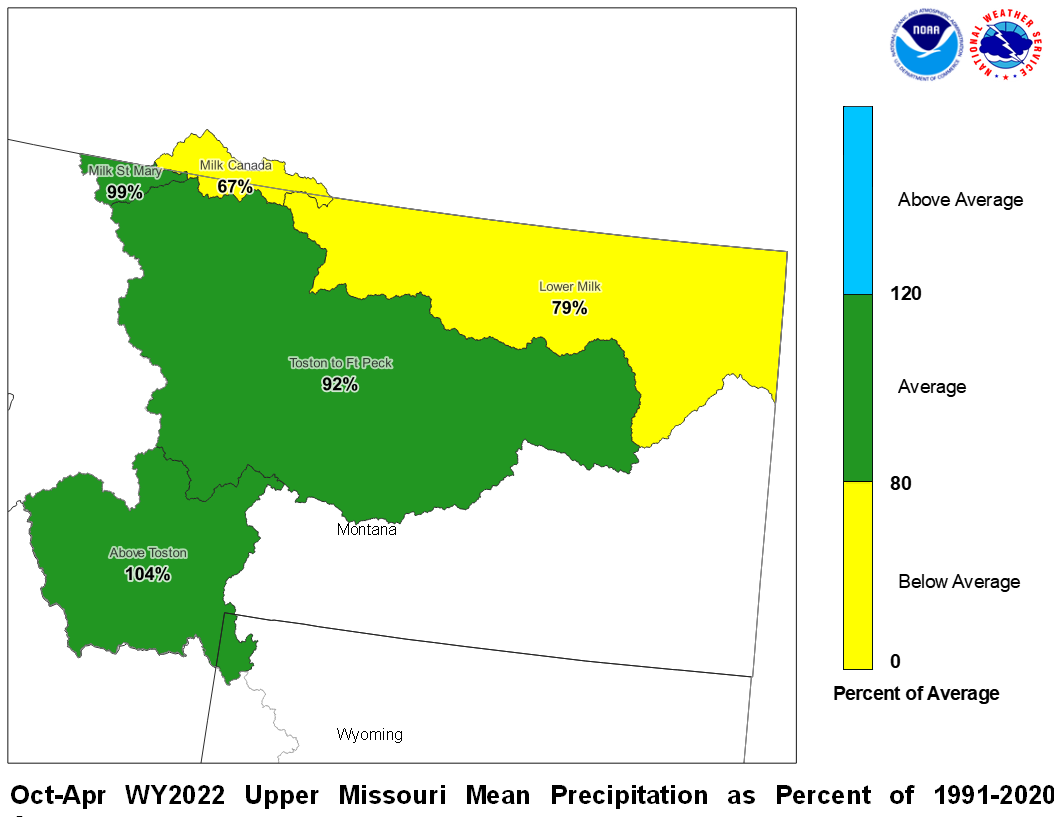
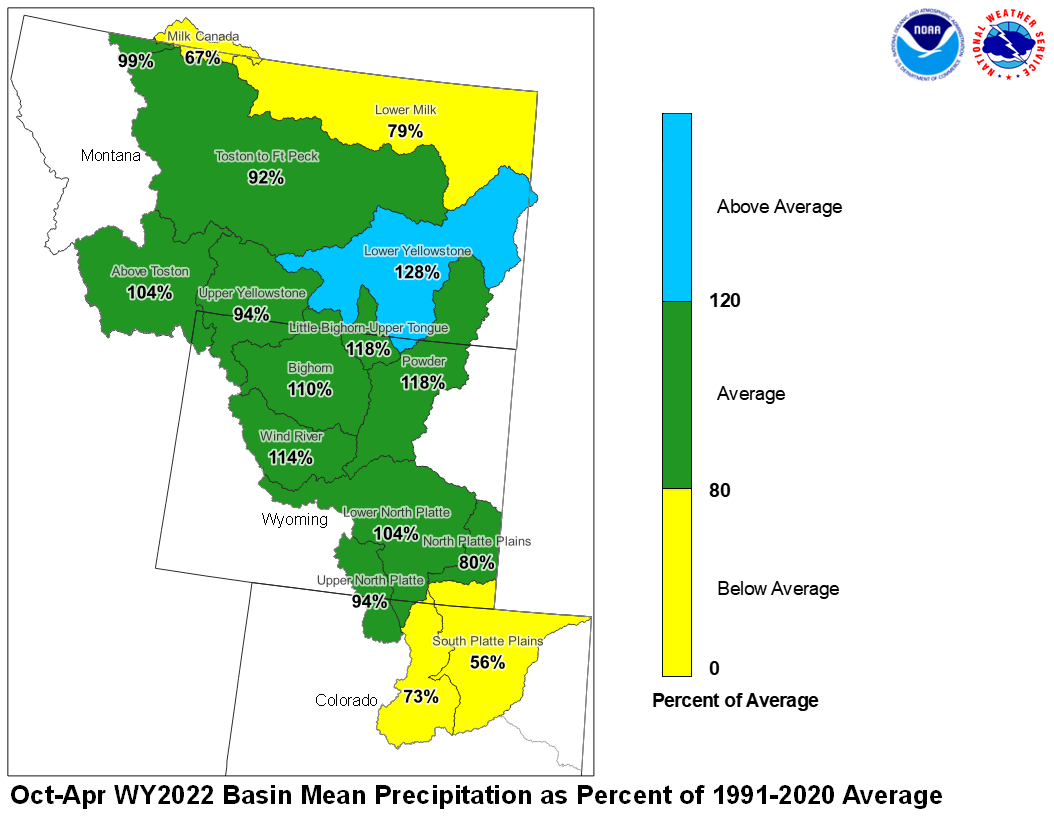
April 2022 Upper Missouri Mean Precip Oct-Apr WY2022 Upper Missouri Mean Precip
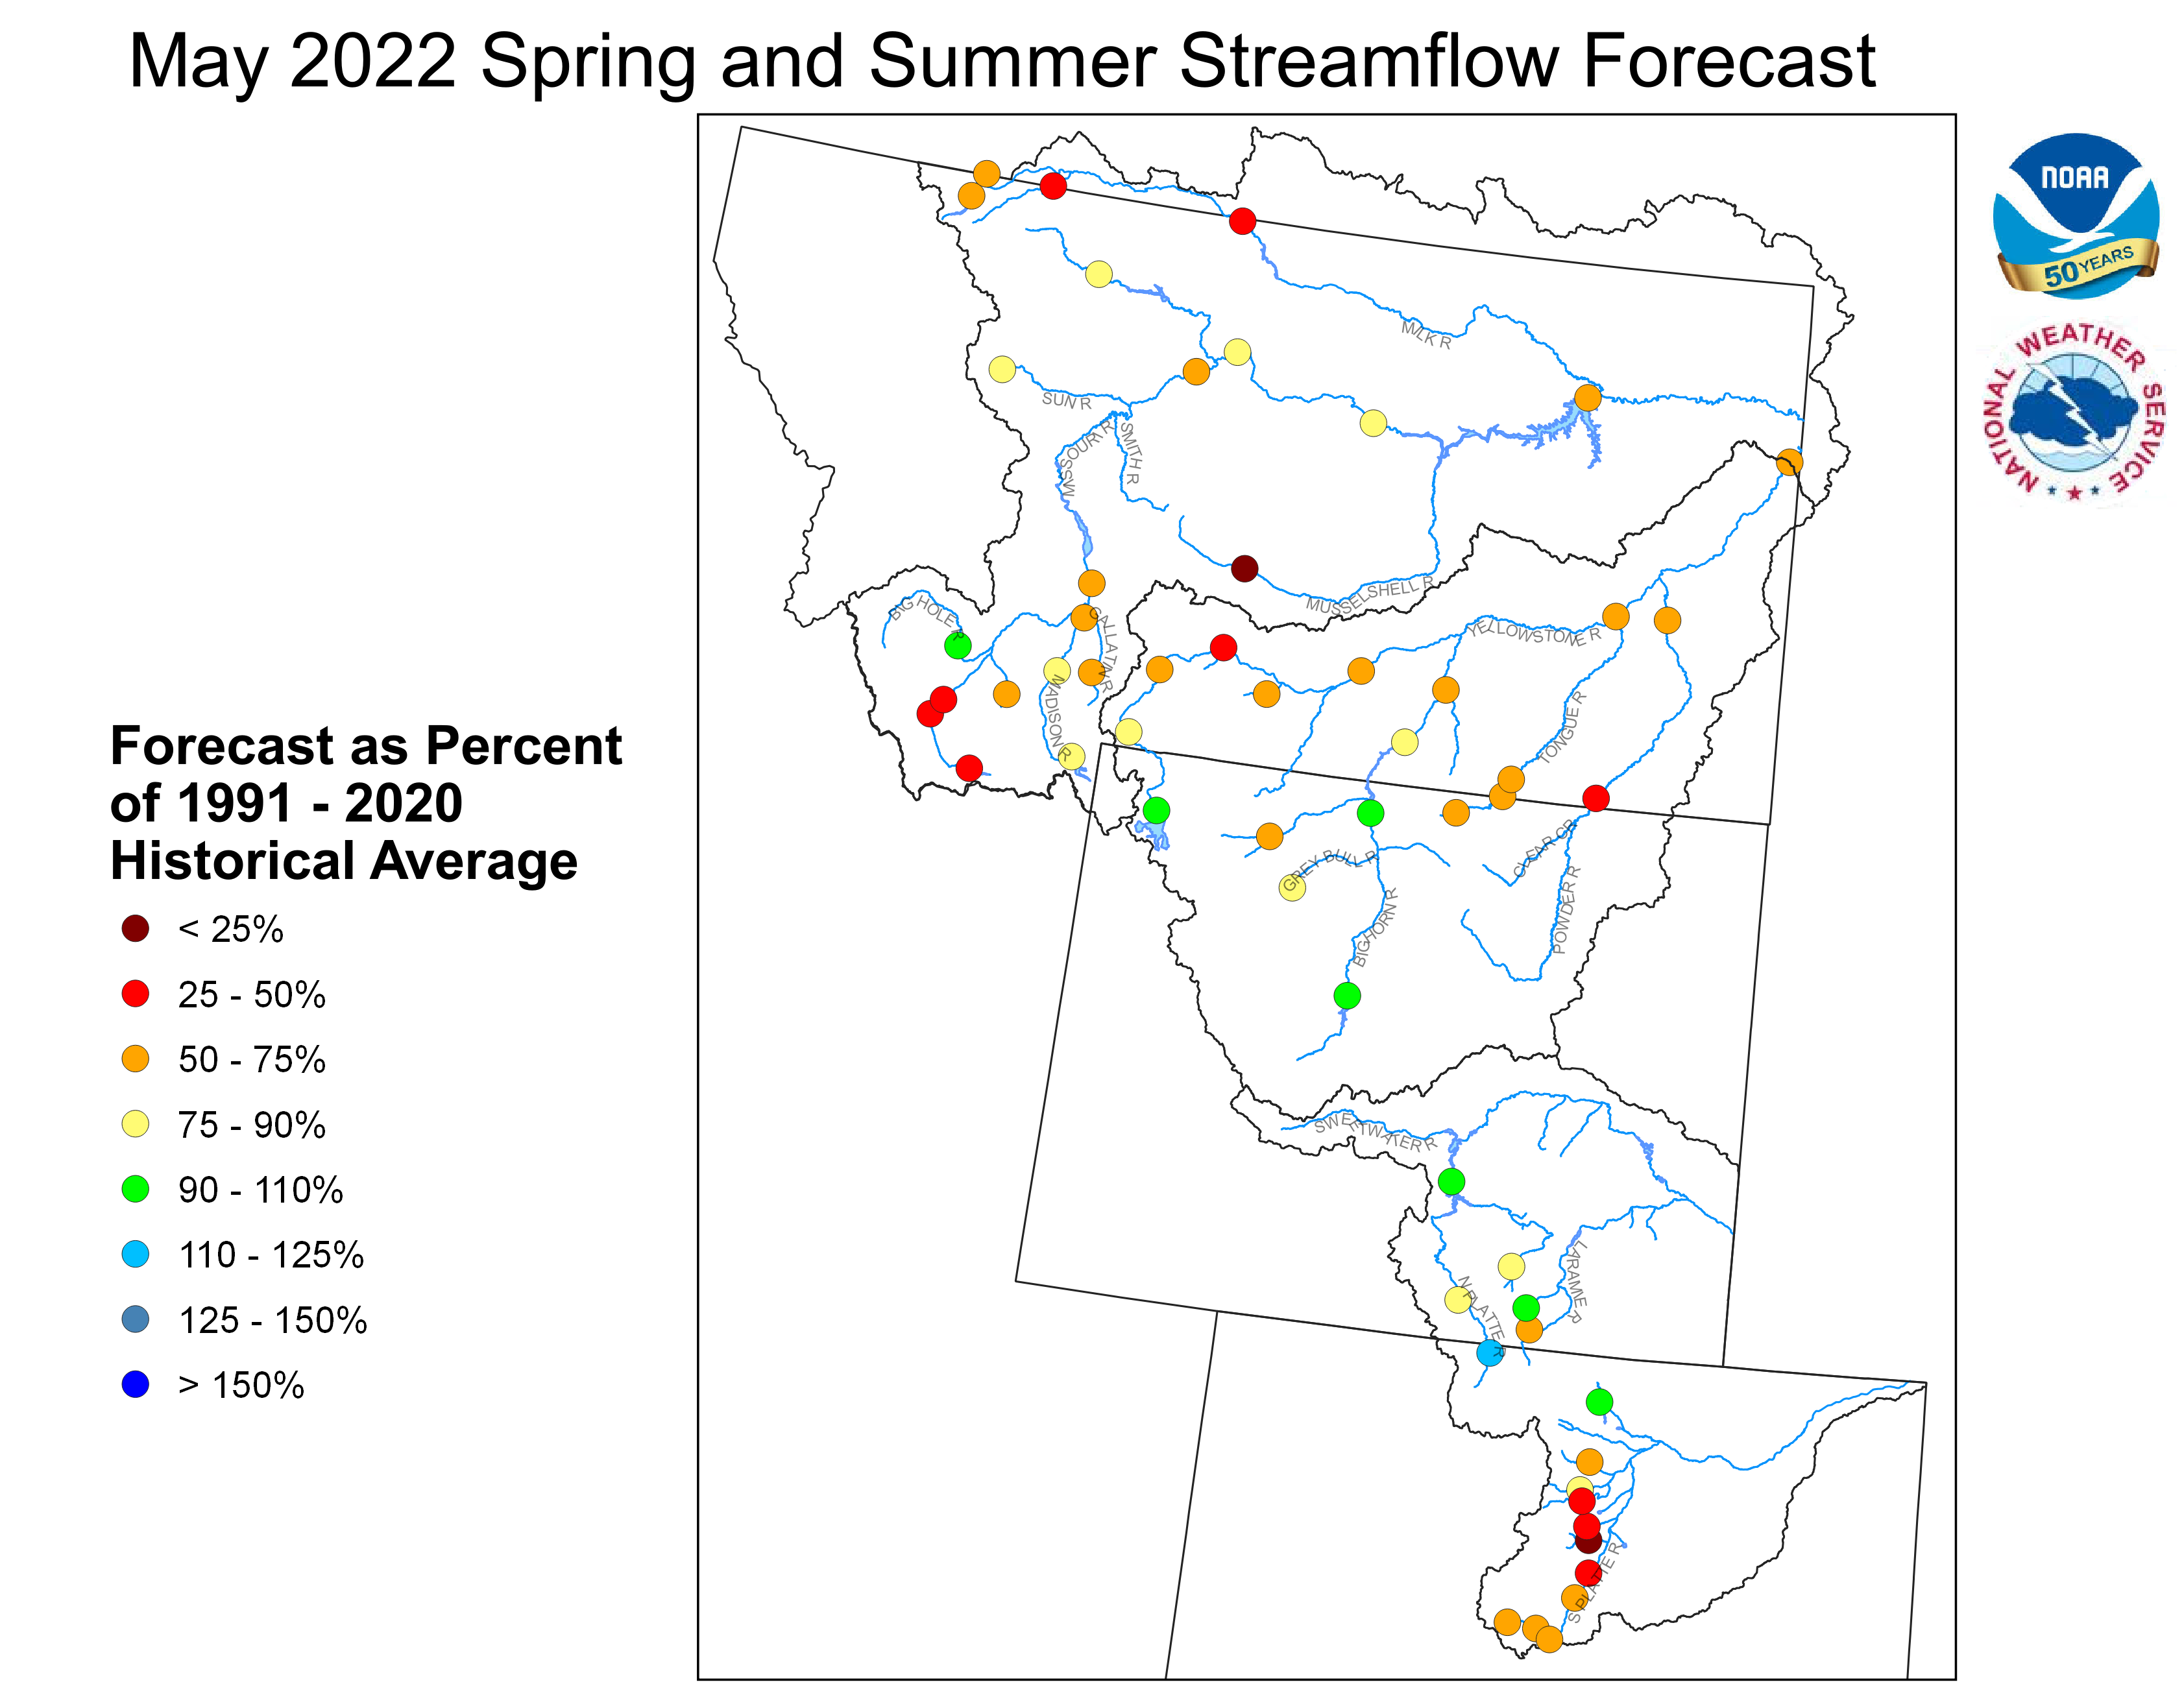
Stream flow in the Upper Missouri Basin is forecast to be
below average during the upcoming Spring and Summer.
The St. Mary River is forecast to have 60 percent of average
May-September flows. Runoff is expected to range around
73 percent of average for the Missouri Basin above Fort Peck,
Montana.
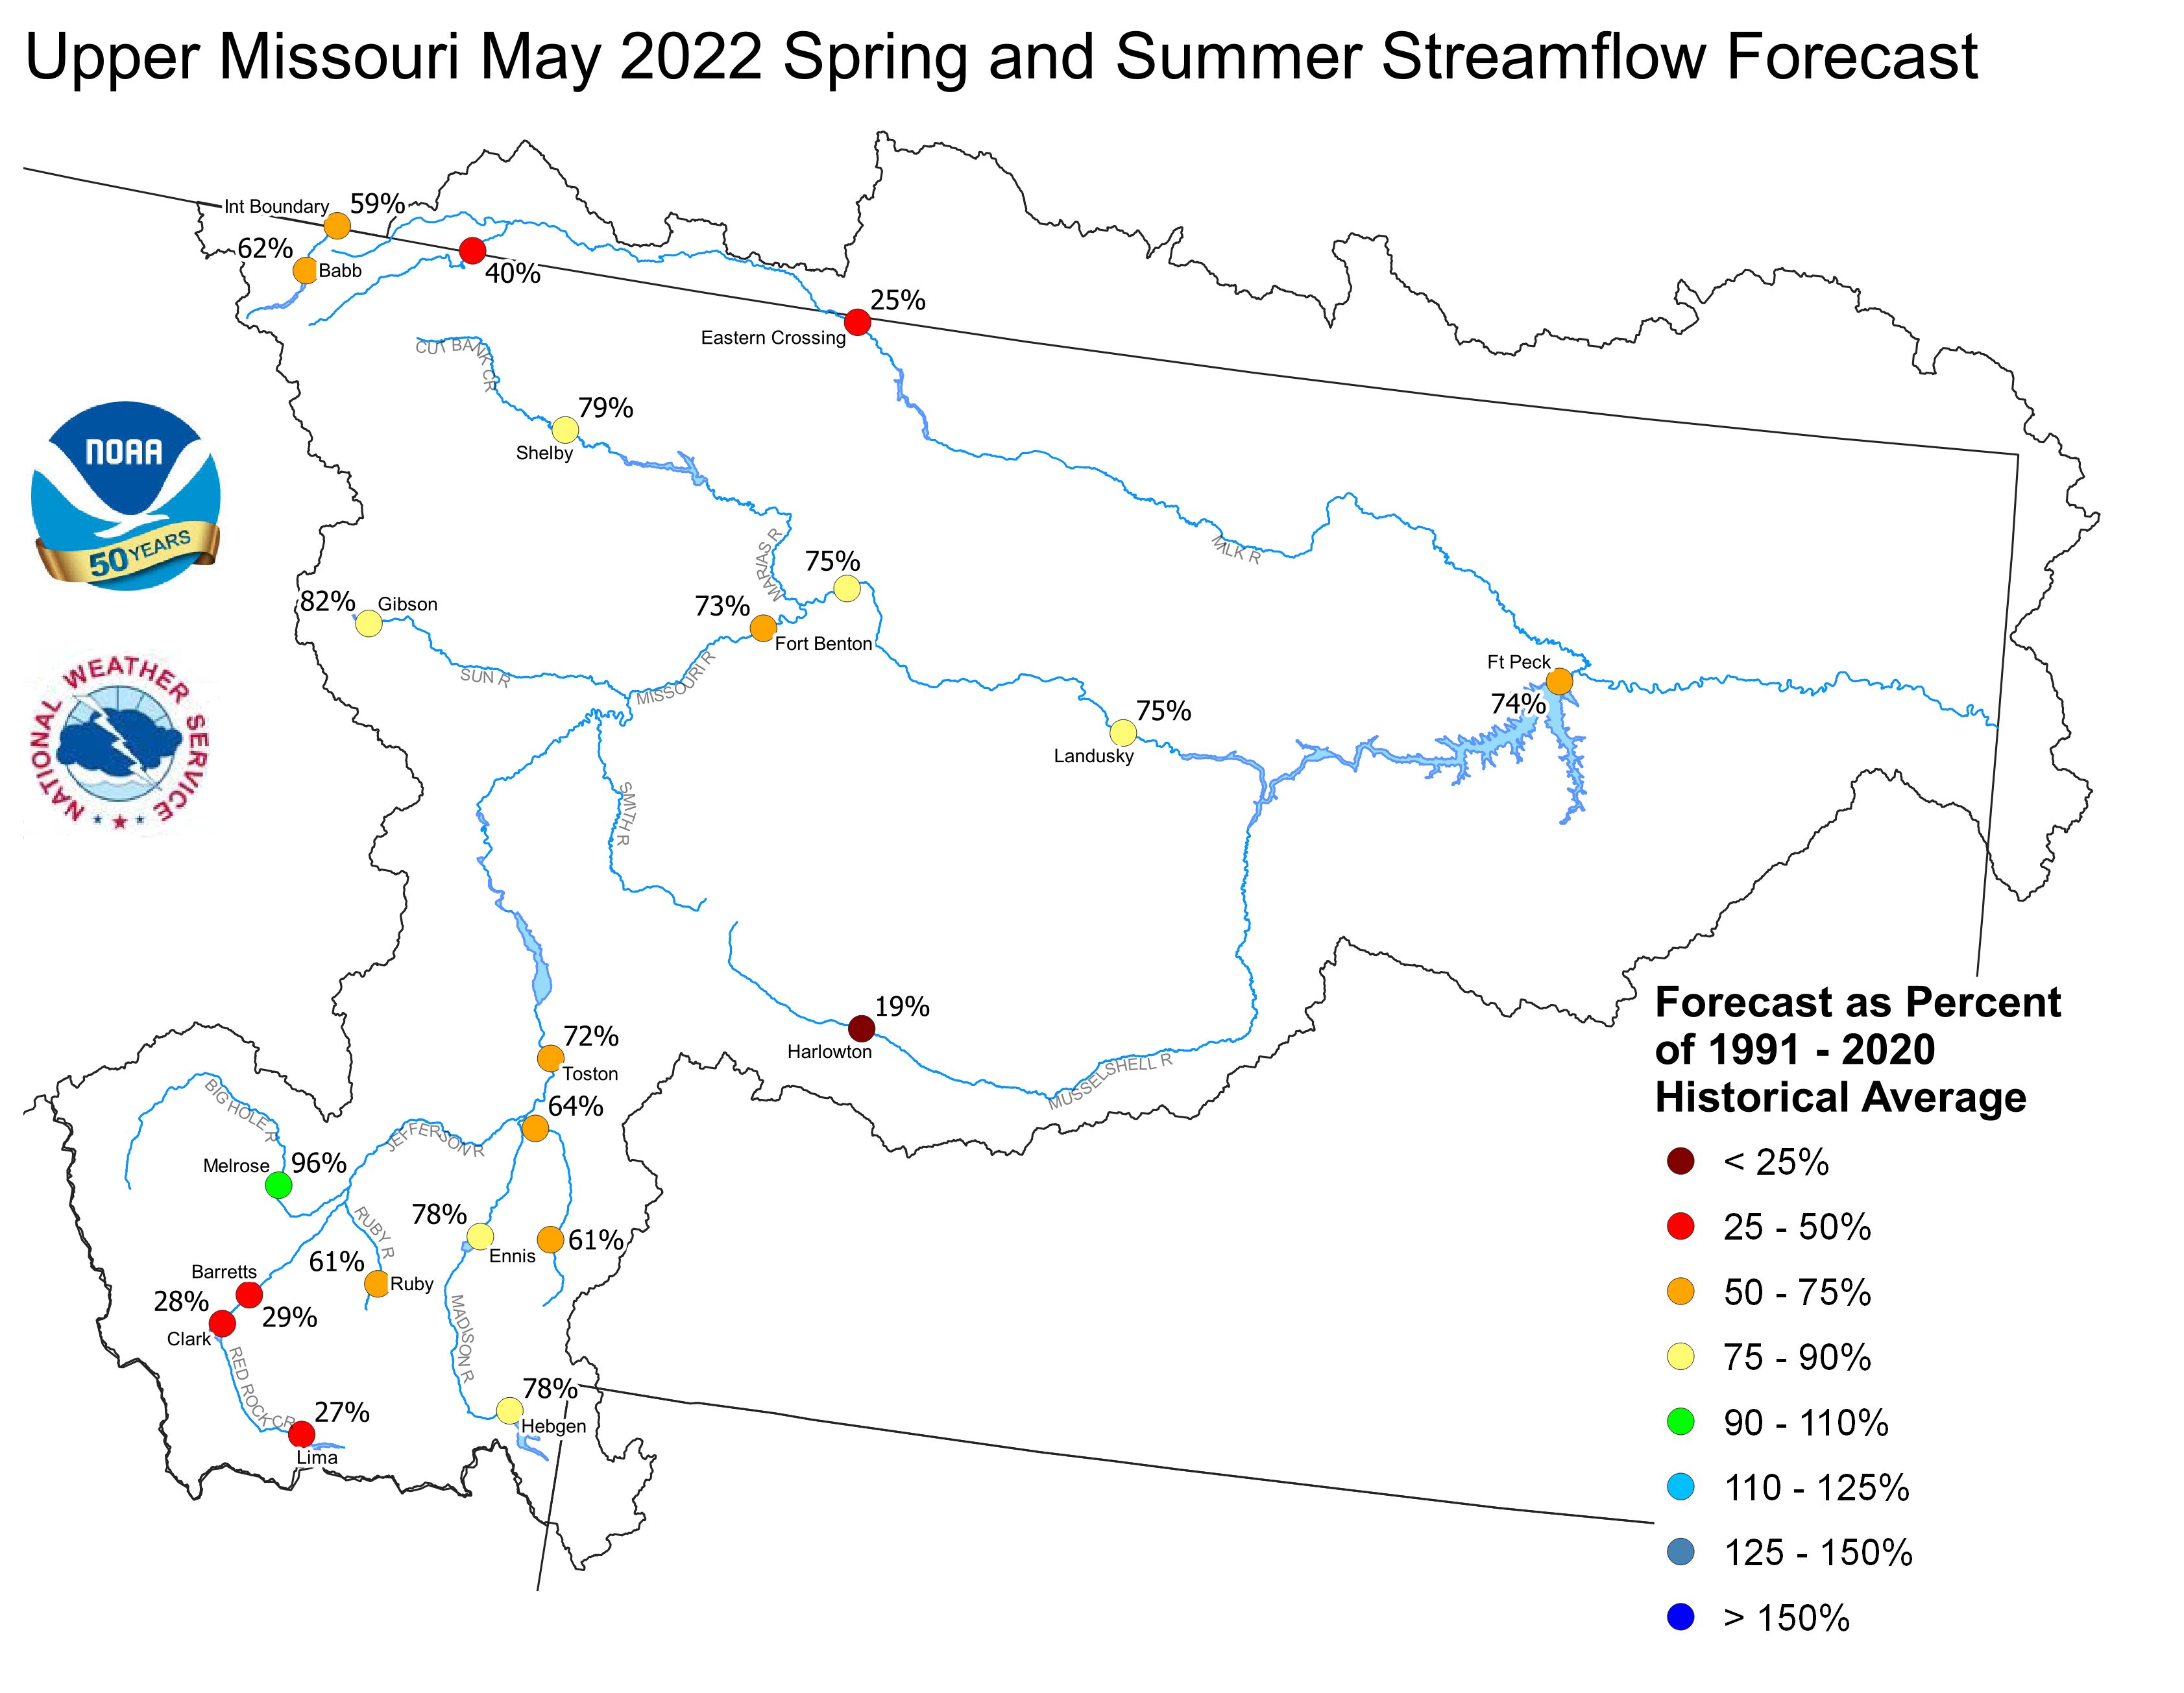
Upper Missouri May 1, 2022 Spring and Summer Streamflow Forecasts
Of the four major irrigation reservoirs in Montana; Lima
Reservoir had 62 percent average storage, Clark Canyon was
holding 71 percent of average water, Gibson Reservoir had 56
percent of average stored water, and Fresno Reservoir had
68 percent of average stored water.
Yellowstone Basin
The high elevation snow pack in the Yellowstone Basin was below average
on May 1. The snow pack in the Upper Yellowstone Basin was 73 percent
of average. The snow packs in the Wind, Bighorn, and Shoshone Basins were 84,
81, and 74 percent of average, respectively. The snow packs in the Tongue
and Powder basins were 88 and 80 percent of average, respectively.
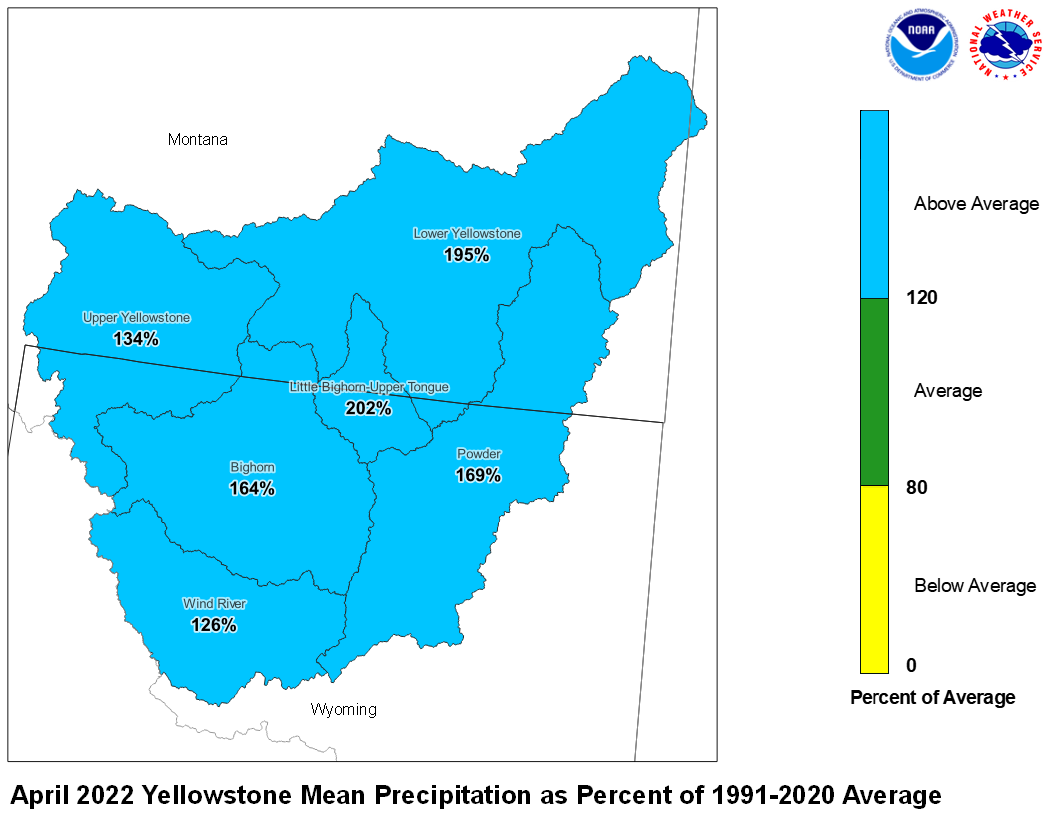
Precipitation during April was above average. The upper Yellowstone River
Basin received 134 percent of average precipitation while the Lower
Yellowstone River Basin reported 195 percent of average. The Bighorn
Basin received 164 percent of average precipitation while the
Wind River Basin received 126 percent of average. The Little Bighorn -
Upper Tongue Basin received 202 percent of average and the Powder River
had 169 percent of average precipitation.
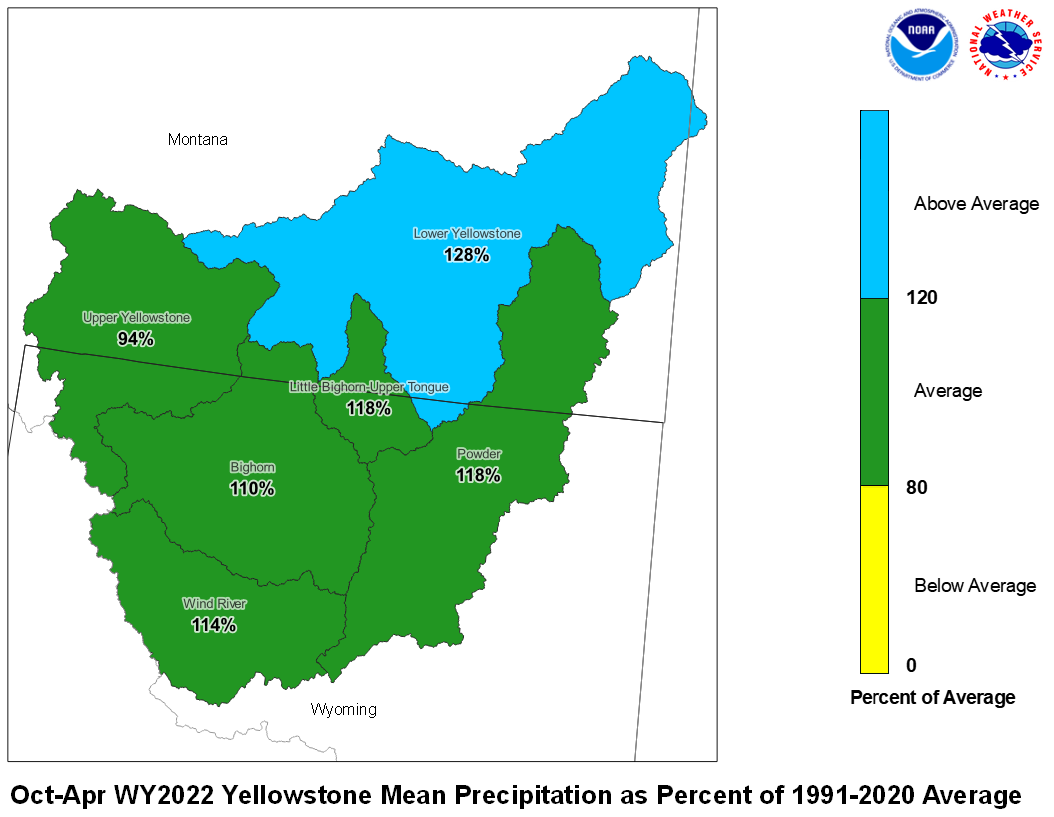
April 2022 Yellowstone Mean Precip Oct-Apr WY2022 Yellowstone Mean Precip
Forecast stream flow in the Yellowstone Basin is below average
for the upcoming Spring and Summer. Stream flow for the
Yellowstone River above Sidney, Montana is forecast to be about
71 percent of average. Flow in the Tongue Basin is expected to be
63 percent of average. Flows in the Powder River are expected
to be about 55 percent of average.
Monthend storage at Boysen Reservoir was 113 percent of average.
Stored water in Buffalo Bill Reservoir was 95 percent of average.
Monthend storage was 100 percent of average at Bighorn Reservoir.
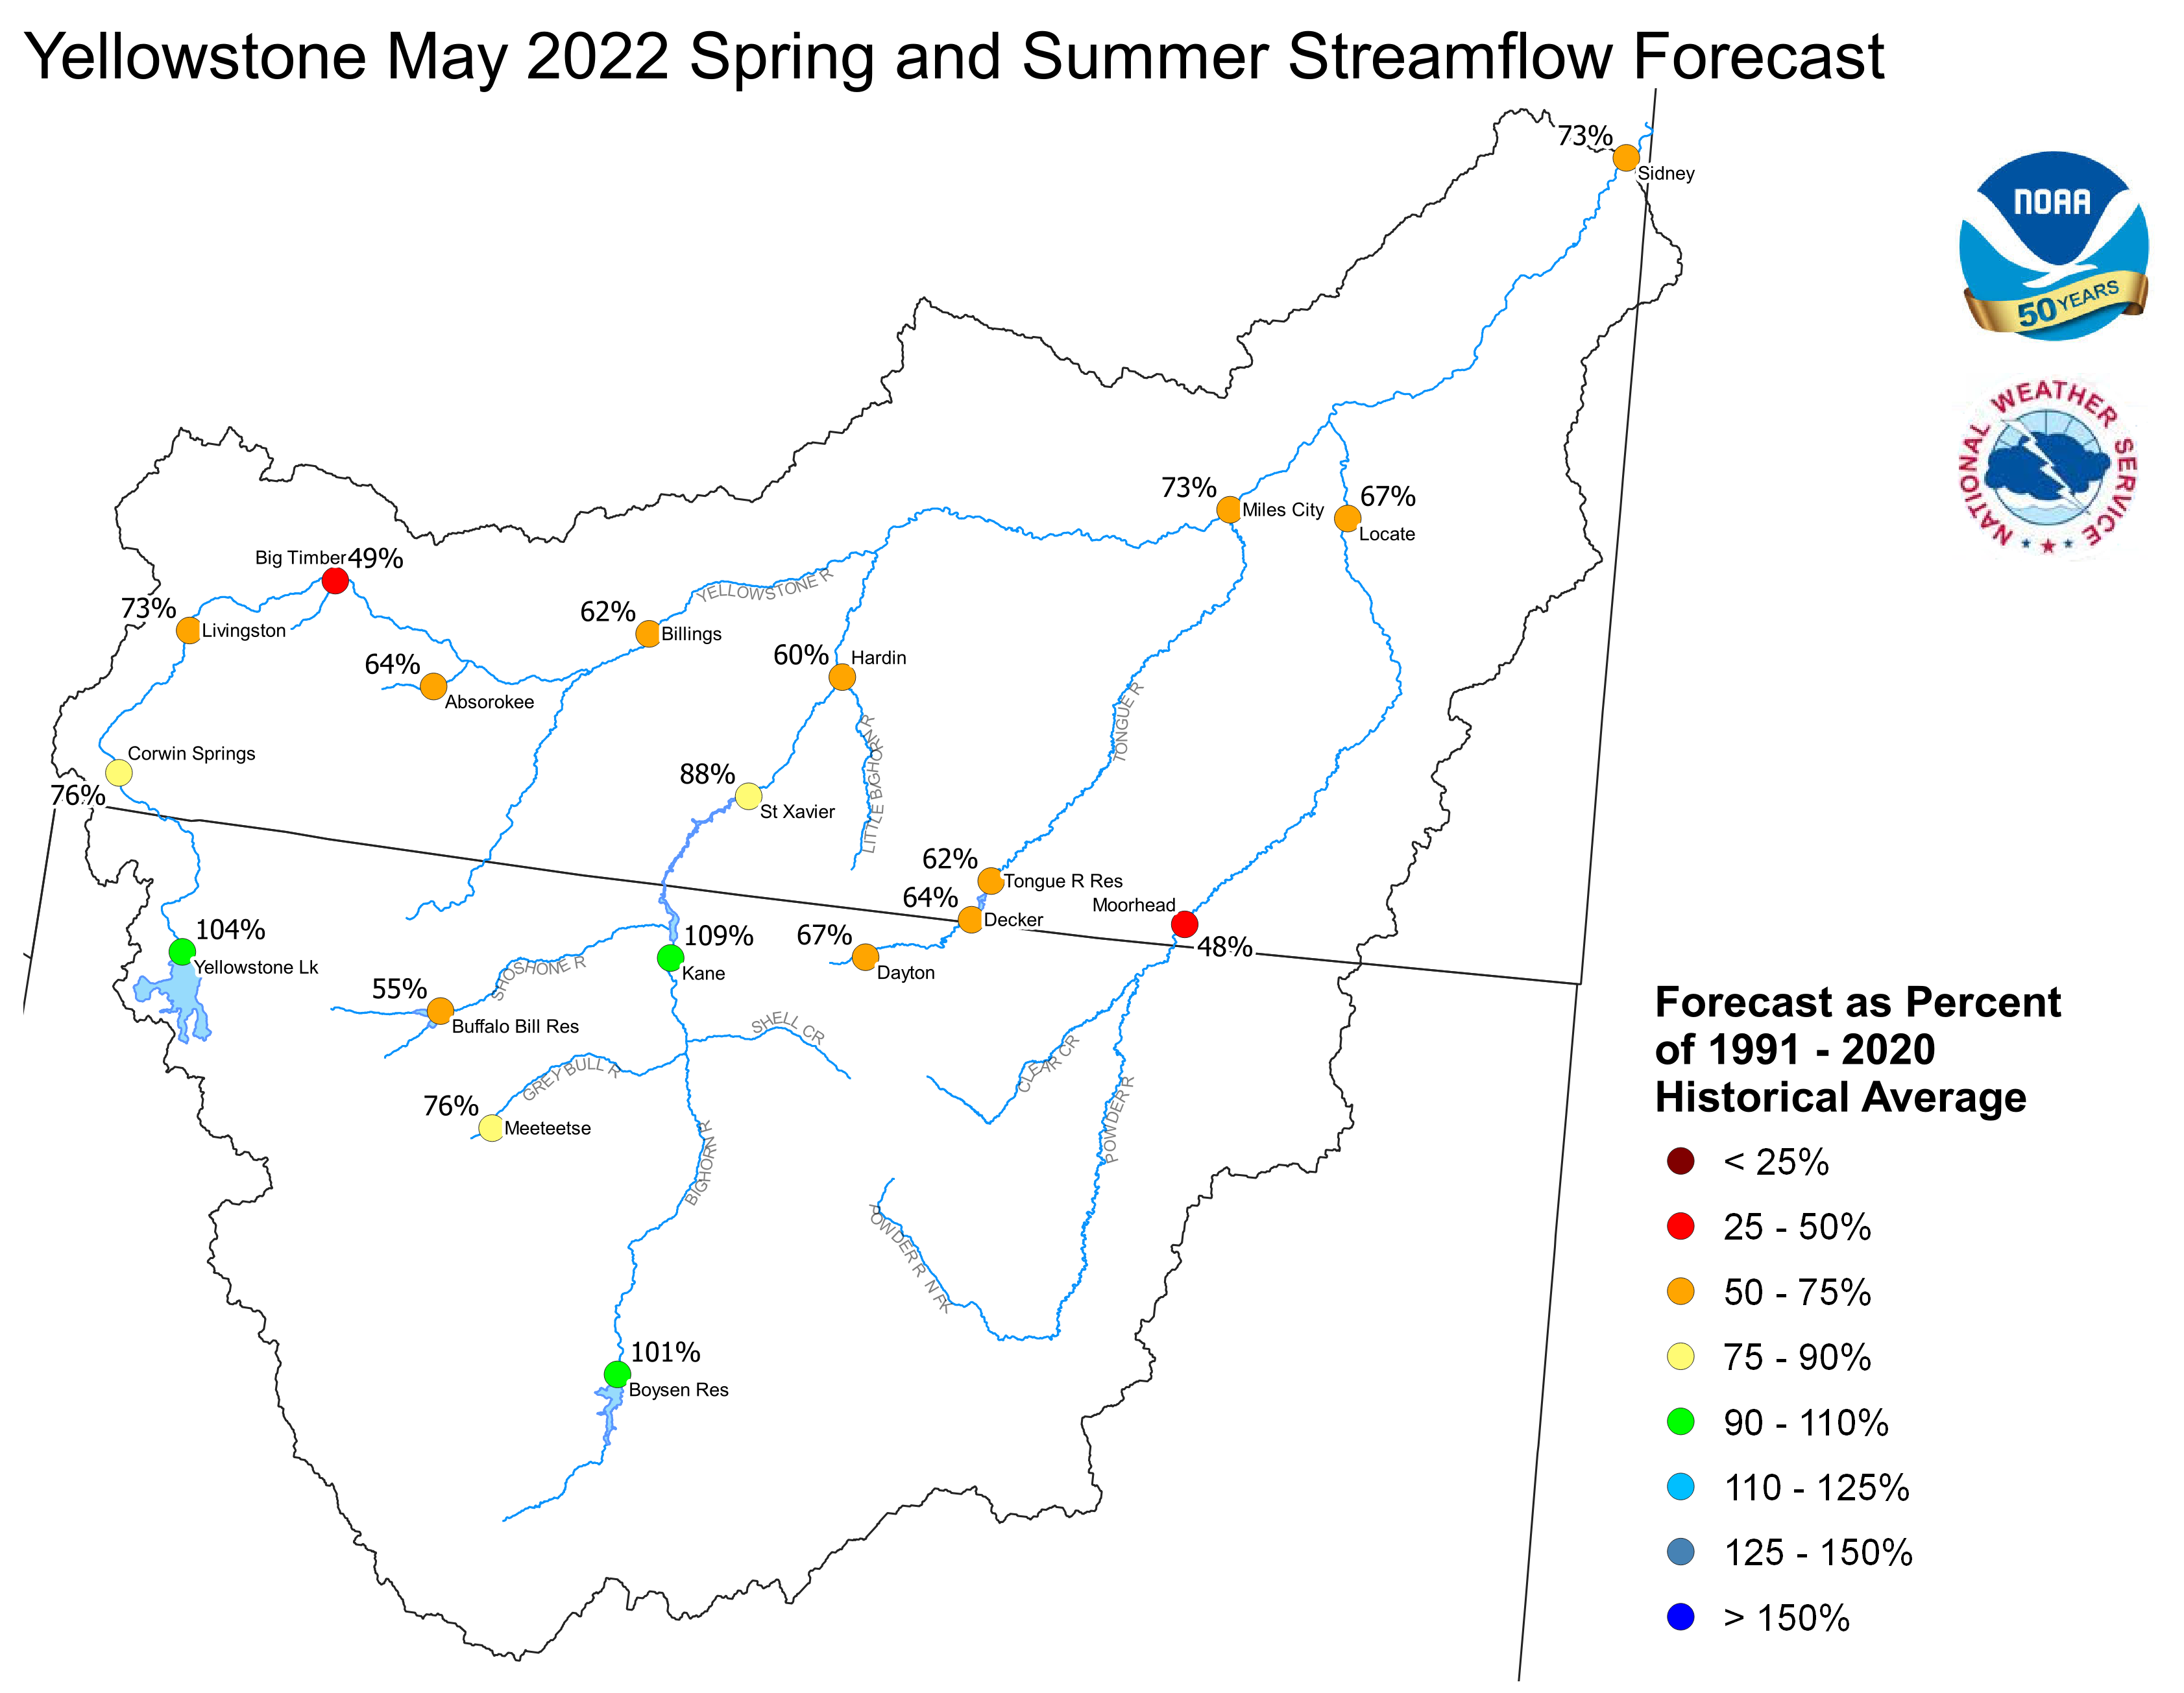
Yellowstone May 1, 2022 Spring and Summer Streamflow Forecasts
Platte Basin
The high elevation snow pack in the Upper North Platte Basin was
91 percent of average on May 1. The snow pack in the North Platte
Basin below Seminoe Reservoir was 85 percent of average. The snow
pack in the South Platte Basin was 90 percent of average.
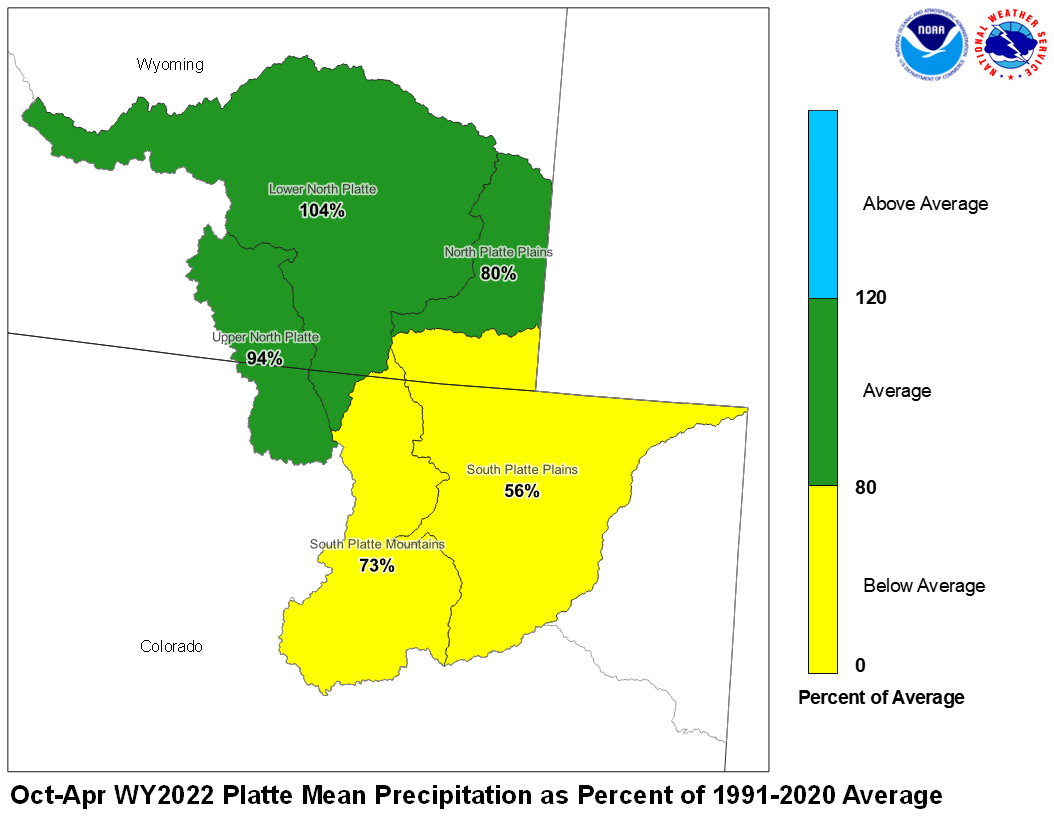
Precipitation during April in the Upper North Platte Basin was 98
percent of average. In the Lower North Platte Basin, precipitation
was 84 percent of average. The North Platte Plains below Guernsy
Reservoir had 31 percent. The South Platte Mountains had 38
percent whereas the Plains had 11 percent of average April
precipitation.
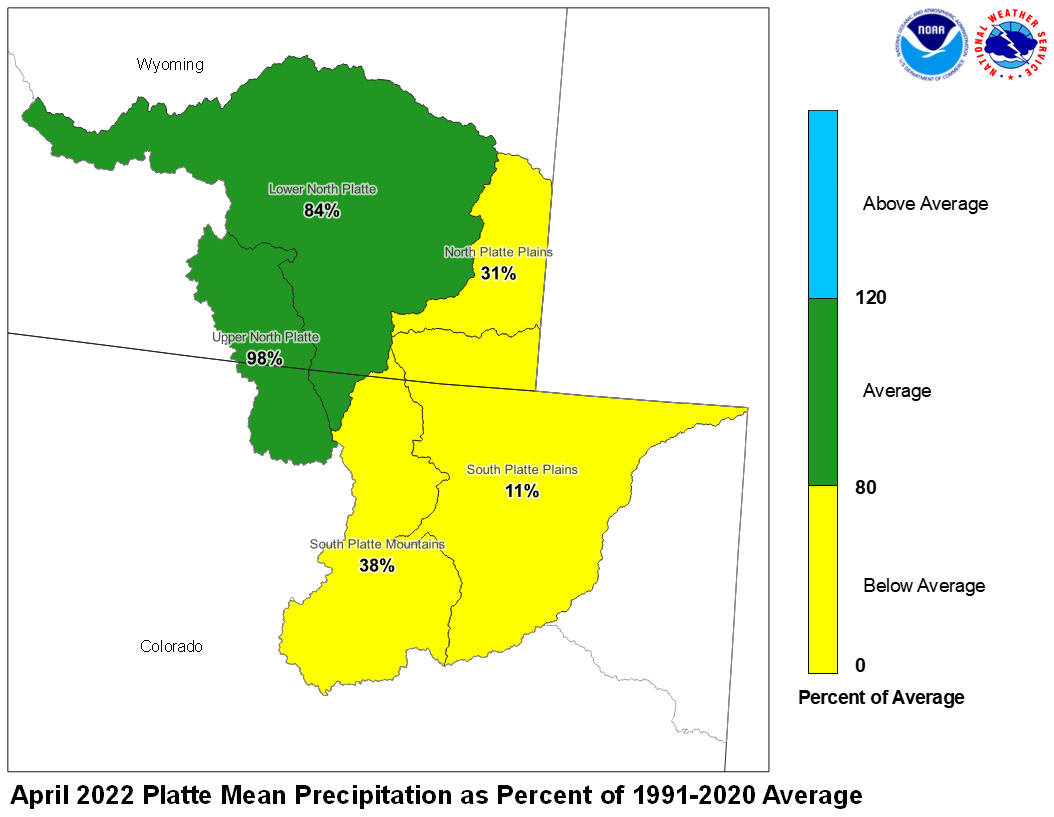
April 2022 Platte Mean Precip Oct-Apr WY2022 Platte Mean Precip
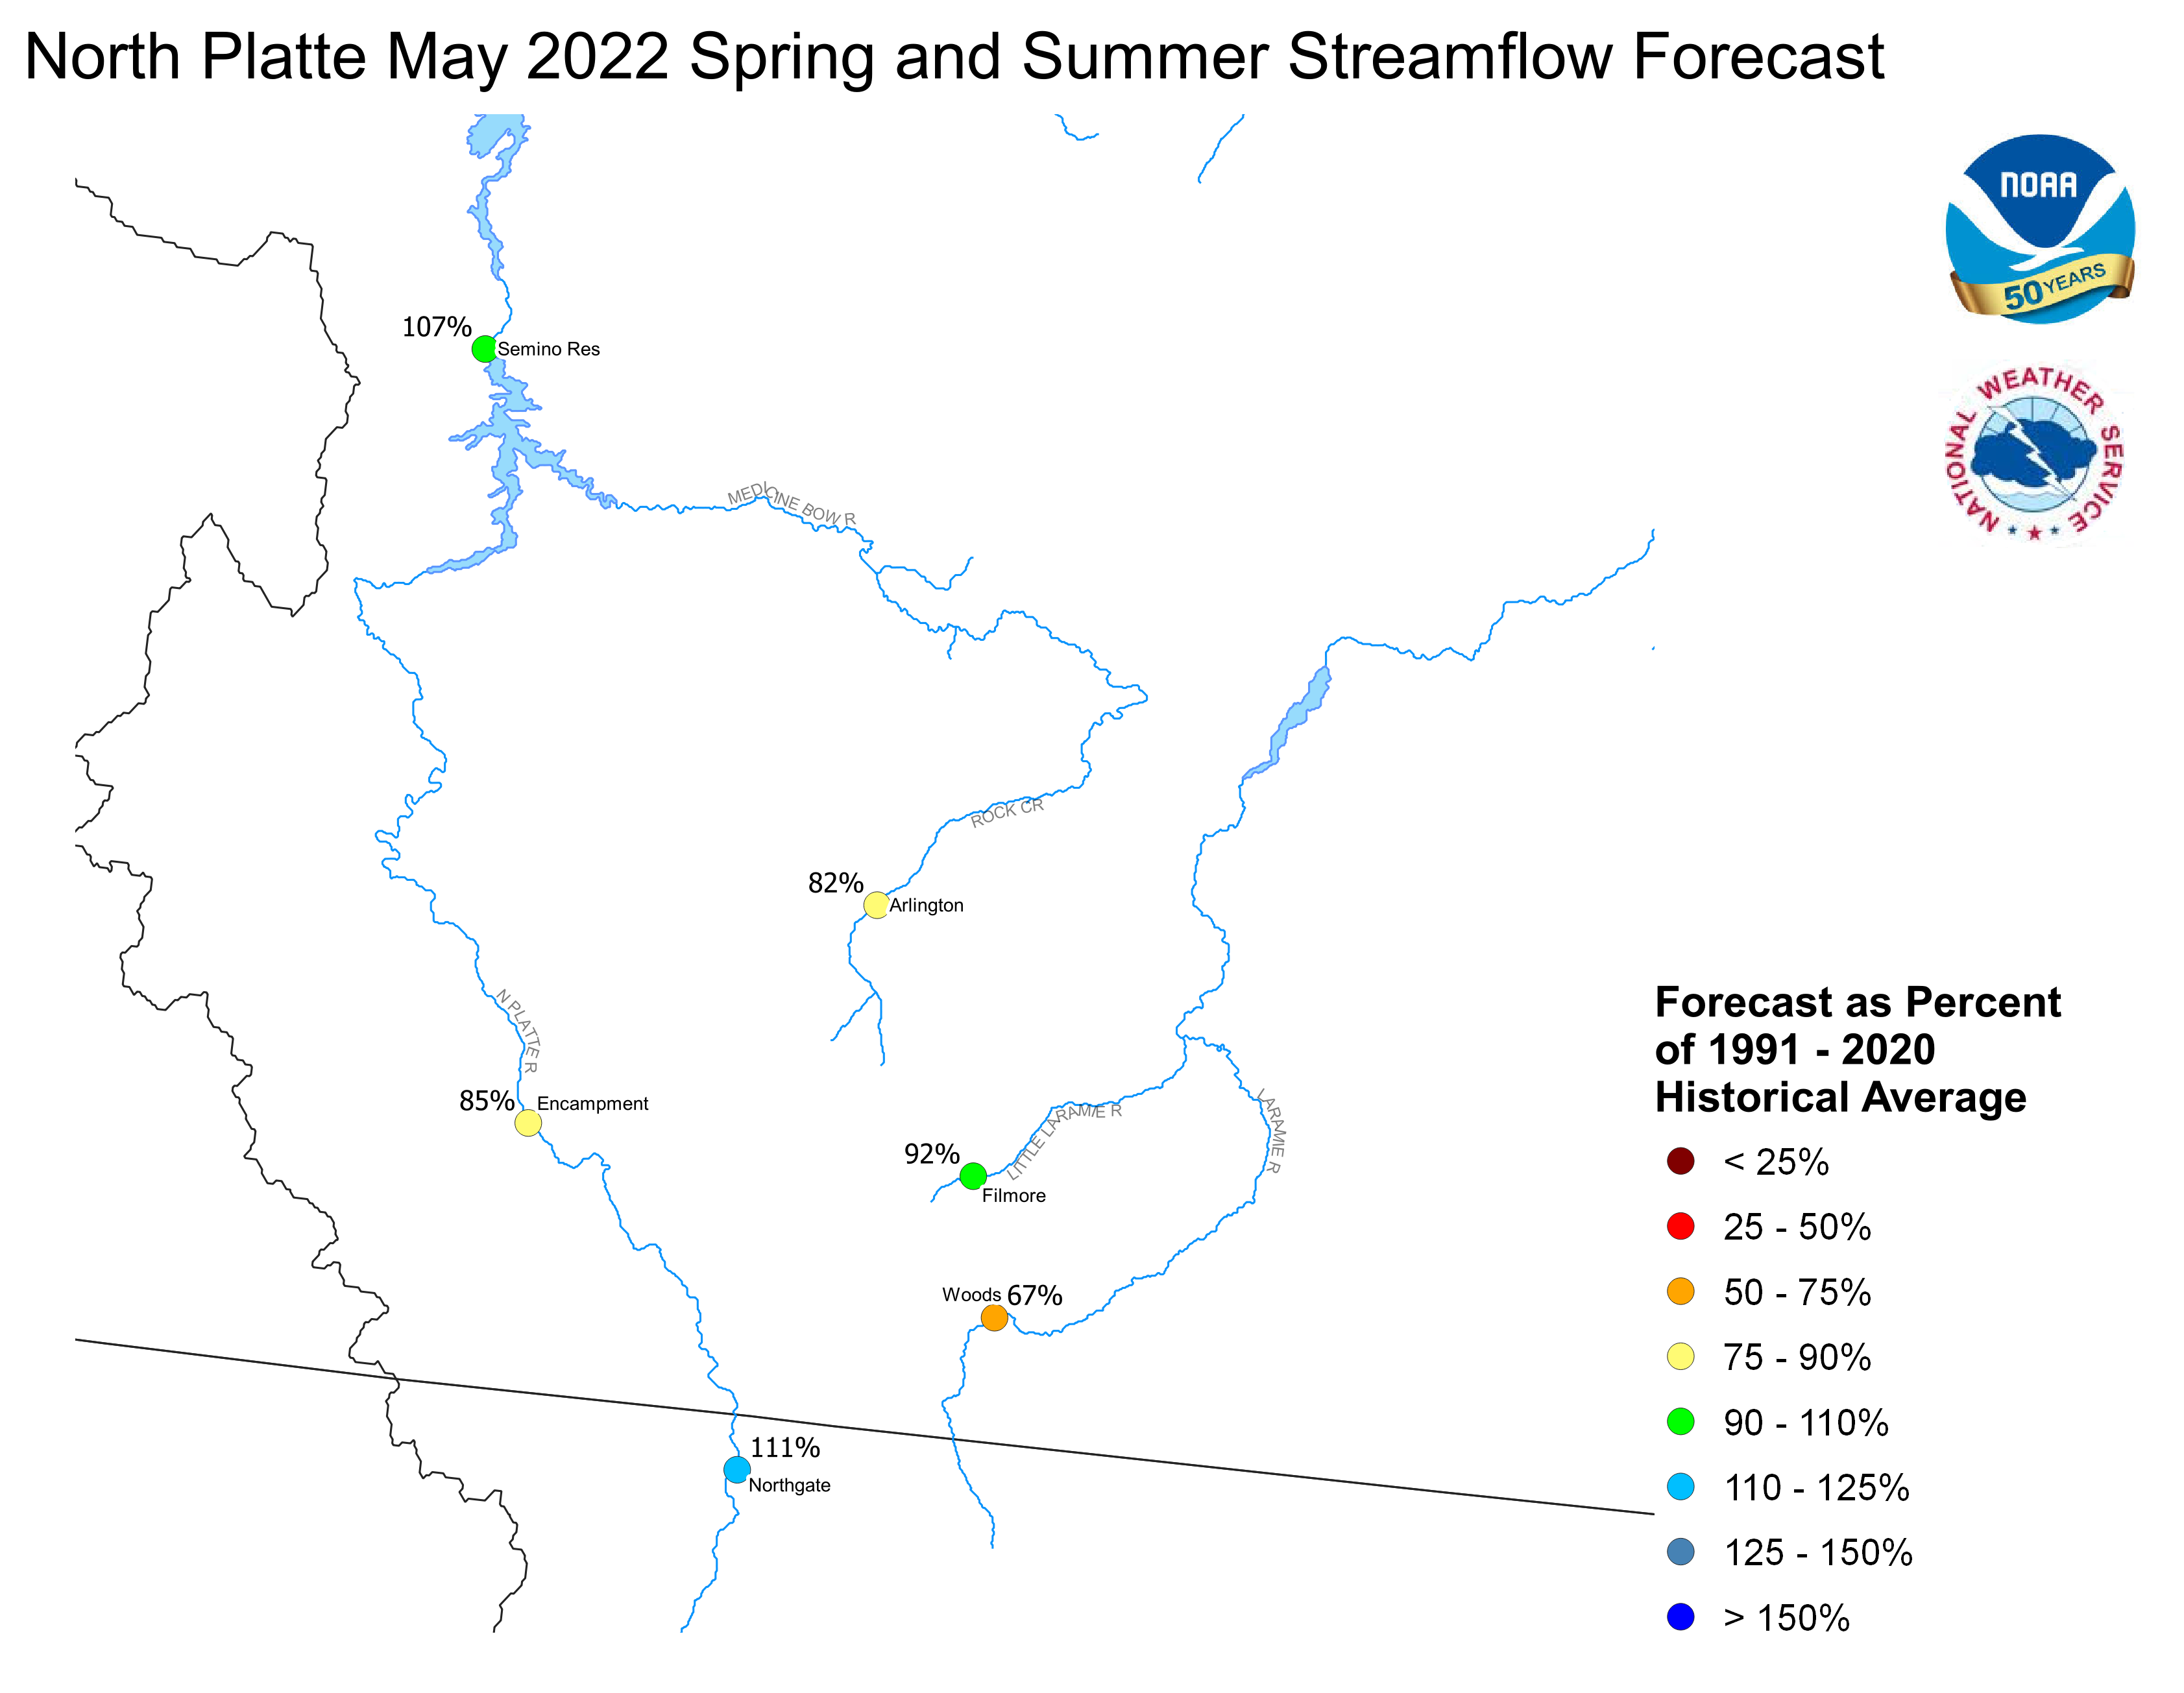
Stream flow in the Platte Basin is forecast to be below
average during the upcoming Spring and Summer. Runoff
for streams above Seminoe Reservoir are expected to be
about 85 percent of average. Streams in the South Platte
Basin above South Platte, Colorado can expect 45 percent
of average flow. For the remainder of the South Platte
basin, flows are expected near 40 percent.
Stored water in the South Platte Basin was 100 percent of average
on May 1.
North Platte Streamflow Fcst South Platte Streamflow Fcst
FGUS63 KKRF 021509
ESPKRF
WATER SUPPLY FORECAST
NWS MISSOURI BASIN RIVER FORECAST CENTER
PLEASANT HILL MISSOURI

0659 CDT MONDAY MAY 02, 2022

DATA CURRENT AS OF: MAY 01, 2022

MISSOURI/YELLOWSTONE/PLATTE RIVER BASIN FORECASTS


                                          50%   %   10%   90%   AVG
FORECAST POINT                   PERIOD  (KAF) AVG (KAF) (KAF) (KAF)
--------------------------------------------------------------------

Boysen Resvr Inflow              May-Sep  407   61   724  223    666
 SBDW4

Boysen Resvr Inflow              May-Sep  836  101  1206  623    831
 SBDW4N

Bighorn R at Kane                May-Sep  869   98  1447  661    885
 LVEW4

Bighorn R at Kane                May-Sep 1443  109  2067 1082   1322
 LVEW4N

Greybull R at Meeteetse          May-Sep  150   79   248  119    190
 MEEW4

Greybull R at Meeteetse          May-Sep  150   76   248  119    197
 MEEW4N

Buffalo Bill Resvr Inflow        May-Sep  398   50   545  309    792
 CDYW4

Buffalo Bill Resvr Inflow        May-Sep  475   55   617  390    865
 CDYW4N

St. Mary R nr Babb               May-Sep  242   57   302  201    424
 SMYM8

St. Mary R nr Babb               May-Sep  251   62   312  209    403
 SMYM8N

St. Mary R at Intl Boundary      May-Sep  173   48   251  117    362
 SMBM8

St. Mary R at Intl Boundary      May-Sep  298   59   378  248    506
 SMBM8N

Milk R nr Western Crossing       May-Sep    6    5    24    3    109
 PDBM8

Milk R nr Western Crossing       May-Sep   10   40    32    5     24
 PDBM8N

Milk R nr Eastern Crossing       May-Sep  128   70   184  118    184
 ERNM8

Milk R nr Eastern Crossing       May-Sep   23   25   118   11     95
 ERNM8N

North Platte R nr Northgate      May-Sep  231  111   330  160    209
 NGTC2

North Platte R nr Northgate      May-Sep  284  111   381  213    257
 NGTC2N

Encampment R nr Encampment       May-Sep  120   85   140   96    142
 ECRW4

Encampment R nr Encampment       May-Sep  129   85   150  106    152
 ECRW4N

Rock Cr nr Arlington             May-Sep   42   83    49   35     51
 KCRW4

Rock Cr nr Arlington             May-Sep   42   82    49   35     52
 KCRW4N

Seminoe Resvr Inflow             May-Sep  726  108   895  526    669
 SETW4

Seminoe Resvr Inflow             May-Sep  878  107  1046  688    818
 SETW4N

Laramie R nr Woods Landing       May-Sep   54   53    86   31    101
 WODW4

Laramie R nr Woods Landing       May-Sep   88   67   121   65    133
 WODW4N

Little Laramie R nr Filmore      May-Sep   48  113    60   38     42
 SMTW4

Little Laramie R nr Filmore      May-Sep   50   92    62   40     54
 SMTW4N

Antero Resvr Inflow              May-Sep    7   57    11    5     13
 ANRC2

Antero Resvr Inflow              May-Sep    7   57    11    5     13
 ANRC2N

Spinney Mountain Resvr Inflow    May-Sep   28   54    41   23     53
 SPYC2

Spinney Mountain Resvr Inflow    May-Sep   21   51    34   14     41
 SPYC2N

Elevenmile Canyon Resvr Inflow   May-Sep   32   60    42   28     53
 EVNC2

Elevenmile Canyon Resvr Inflow   May-Sep   24   50    40   15     47
 EVNC2N

Cheesman Lk Inflow               May-Sep   47   51    69   35     92
 CHEC2

Cheesman Lk Inflow               May-Sep   44   53    74   27     84
 CHEC2N

S Platte R at S Platte           May-Sep  269  122   286  253    220
 SPTC2

S Platte R at S Platte           May-Sep   85   45   131   54    189
 SPTC2N

Bear Cr at Morrison              May-Sep    5   22    10    3     24
 MRRC2

Bear Cr at Morrison              May-Sep    5   22    10    3     24
 MRRC2N

Clear Cr at Golden               May-Sep   44   39    64   31    113
 GLDC2

Clear Cr at Golden               May-Sep   51   40    73   37    126
 GLDC2N

St. Vrain Cr at Lyons            May-Sep   40   55    58   30     74
 LNSC2

St. Vrain Cr at Lyons            May-Sep   62   61    88   49    102
 LNSC2N

Boulder Cr nr Orodell            May-Sep   24   52    37   20     45
 OROC2

Boulder Cr nr Orodell            May-Sep   38   80    54   34     48
 OROC2N

S Boulder Cr nr Eldorado Sprgs   May-Sep   15   47    21   11     32
 BELC2

S Boulder Cr nr Eldorado Sprgs   May-Sep   15   41    25   11     37
 BELC2N

Cache La Poudre at Canyon Mouth  May-Sep  167  162   215  134    103
 FTDC2

Cache La Poudre at Canyon Mouth  May-Sep  192   95   249  155    201
 FTDC2N

Lima Resvr Inflow                May-Sep   15   28    23   11     54
 LRRM8

Lima Resvr Inflow                May-Sep   15   27    23   11     57
 LRRM8N

Clark Canyon Resvr Inflow        May-Sep   27   28    33   25     96
 CLKM8

Clark Canyon Resvr Inflow        May-Sep   51   28    73   43    180
 CLKM8N

Beaverhead R at Barretts         May-Sep   99   58   107   95    169
 BARM8

Beaverhead R at Barretts         May-Sep   77   29   101   66    261
 BARM8N

Ruby R Resvr Inflow              May-Sep   53   67    64   43     79
 ALRM8

Ruby R Resvr Inflow              May-Sep   53   61    64   43     87
 ALRM8N

Big Hole R nr Melrose            May-Sep  487   95   688  414    510
 MLRM8

Big Hole R nr Melrose            May-Sep  549   96   749  473    574
 MLRM8N

Hebgen Resvr Inflow              May-Sep  314   78   365  281    402
 HBDM8

Hebgen Resvr Inflow              May-Sep  314   78   365  281    402
 HBDM8N

Ennis Resvr Inflow               May-Sep  458   73   516  419    626
 ELMM8

Ennis Resvr Inflow               May-Sep  503   78   587  446    641
 ELMM8N

Gallatin R nr Gateway            May-Sep  271   61   345  219    445
 GLGM8

Gallatin R nr Gateway            May-Sep  271   61   345  219    445
 GLGM8N

Gallatin R at Logan              May-Sep  231   52   333  183    447
 LOGM8

Gallatin R at Logan              May-Sep  377   64   463  326    589
 LOGM8N

Missouri R at Toston             May-Sep 1195   68  1639 1071   1766
 TOSM8

Missouri R at Toston             May-Sep 1804   72  2210 1668   2520
 TOSM8N

Missouri R at Fort Benton        May-Sep 1492   57  1683 1389   2635
 FBNM8

Missouri R at Fort Benton        May-Sep 2648   73  3205 2376   3640
 FBNM8N

Missouri R nr Virgelle           May-Sep 1585   54  1822 1478   2950
 VRGM8

Missouri R nr Virgelle           May-Sep 3037   75  3850 2740   4035
 VRGM8N

Missouri R nr Landusky           May-Sep 1695   53  1952 1535   3170
 LDKM8

Missouri R nr Landusky           May-Sep 3236   75  4034 2887   4325
 LDKM8N

Missouri R below Fort Peck Dam   May-Sep 1773   54  2068 1557   3270
 FPKM8

Missouri R below Fort Peck Dam   May-Sep 3335   74  4127 2950   4530
 FPKM8N

Gibson Resvr Inflow              May-Sep  335   82   479  280    409
 AGSM8

Gibson Resvr Inflow              May-Sep  334   82   479  279    409
 AGSM8N

Marias R nr Shelby               May-Sep  280   75   432  210    372
 SHLM8

Marias R nr Shelby               May-Sep  336   79   486  263    425
 SHLM8N

Musselshell R at Harlowton       May-Sep   12   16    18    9     71
 HLWM8

Musselshell R at Harlowton       May-Sep   17   19    23   13     85
 HLWM8N

Yellowstone R at Yellowstone Lk  May-Sep  597   76   642  500    783
 YLOW4

Yellowstone R at Yellowstone Lk  May-Sep  753  104   841  634    722
 YLOW4N

Yellowstone R at Corwin Sprgs    May-Sep 1236   66  1447 1048   1876
 CORM8

Yellowstone R at Corwin Sprgs    May-Sep 1483   76  1714 1277   1958
 CORM8N

Yellowstone R at Livingston      May-Sep 1366   64  1641 1158   2147
 LIVM8

Yellowstone R at Livingston      May-Sep 1682   73  1952 1451   2304
 LIVM8N

Yellowstone R at Billings        May-Sep 1869   49  2448 1557   3805
 BILM8

Yellowstone R at Billings        May-Sep 2808   62  3389 2455   4515
 BILM8N

Yellowstone R at Miles City      May-Sep 3077   58  4133 2608   5320
 MILM8

Yellowstone R at Miles City      May-Sep 5196   73  6509 4433   7115
 MILM8N

Yellowstone R at Sidney          May-Sep 3072   57  4286 2528   5345
 SIDM8

Yellowstone R at Sidney          May-Sep 5453   73  6902 4612   7435
 SIDM8N

Boulder R at Big Timber          May-Sep  133   42   175  107    320
 BTMM8

Boulder R at Big Timber          May-Sep  176   49   216  150    362
 BTMM8N

Stillwater R nr Absarokee        May-Sep  306   60   387  258    512
 SRAM8

Stillwater R nr Absarokee        May-Sep  364   64   443  316    571
 SRAM8N

Clks Fk Yellowstone R nr Belfry  May-Sep  337   57   440  284    594
 BFYM8

Clks Fk Yellowstone R nr Belfry  May-Sep  408   61   511  354    664
 BFYM8N

Bighorn R nr St. Xavier          May-Sep  894   73  1474  795   1227
 STXM8

Bighorn R nr St. Xavier          May-Sep 1981   88  2752 1541   2240
 STXM8N

Little Bighorn R nr Hardin       May-Sep   67   60   114   54    112
 HRDM8

Little Bighorn R nr Hardin       May-Sep   67   60   113   54    112
 HRDM8N

Tongue R nr Dayton               May-Sep   59   66    84   45     90
 DAYW4

Tongue R nr Dayton               May-Sep   65   67    89   50     96
 DAYW4N

Tongue R nr Decker               May-Sep   98   46   170   63    215
 DSLM8

Tongue R nr Decker               May-Sep  140   64   212  103    220
 DSLM8N

Tongue R Resvr Inflow            May-Sep   99   46   176   64    216
 DKRM8

Tongue R Resvr Inflow            May-Sep  141   62   218  104    227
 DKRM8N

Powder R at Moorhead             May-Sep   81   40   264   57    200
 MHDM8

Powder R at Moorhead             May-Sep  114   48   300   84    240
 MHDM8N

Powder R nr Locate               May-Sep  139   62   325  106    223
 LOCM8

Powder R nr Locate               May-Sep  176   67   362  131    263
 LOCM8N


Locations with an `N` suffix indicate natural flows excluding
stream augmentations.

KAF: Thousands of Acre-feet

%AVG: Current 50%/AVG

AVG: Average(50%) seasonal runoff voulme as simulated by the river
forecast model considering acontinuous simulation of the basin
response to historic climate data (observed precipitation and
temperatures) over the period of 1981-2010.

The 50%, 10% and 90% columns indicate the probability that the
actual volume will exceed the forecast for the valid time perion
for more information, please visit: www.weather.gov/mbrfc/water

