What are Ensemble Streamflow Probabilistic (ESP) Forecasts?
|
| The ESP system utilizes historical precipitation and temperature data as input along with the current river, snow and soil moisture conditions to the River Forecast Center's Hydrologic Model to produce long-range probabilistic forecasts. These long-range forecasts provide information on possible future river stage, flow and /or volume at river forecast points. Forecasts are generally for a 90-day period and are issued once a month. These are issued at the end of the month for the upcoming next three month period. |
|
| |
About The Analysis
|
| A simple categorical verification has been conducted to determine the forecast quality of the probabilistic forecasts that are issued generally once a month. The analysis determines the observed exceedance percentage (OEP) for each location and forecast exceedance probability (FEP) category. |
| |
| This is done as follows, for each location and FEP category: |
| 1) find the max observed value for each 3-month forecast period |
| 2) count the number of times the max observed value is ≥ forecast value for each FEP category |
| 3) count the total number of forecast issued for each FEP category |
| 4) calculate the category forecast error (FE), that is, FE = EFP category - OFP |
| 5) calculate the net Mean Absolute Error for all categories (netMAE95to5) this is the sum of the absolute value of each forecast error divided by the number of categories |
| 6) calculate the net Mean Error for all categories (netME95to5 this is the sum of the forecast errors divided by the number of categories |
|
| |
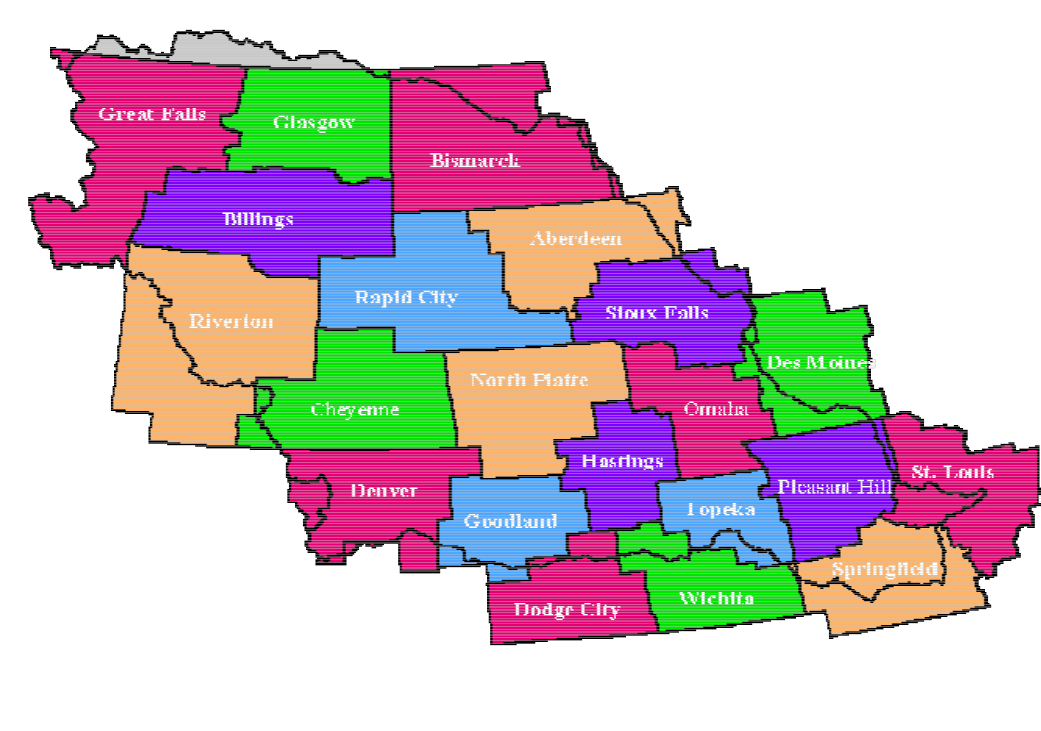
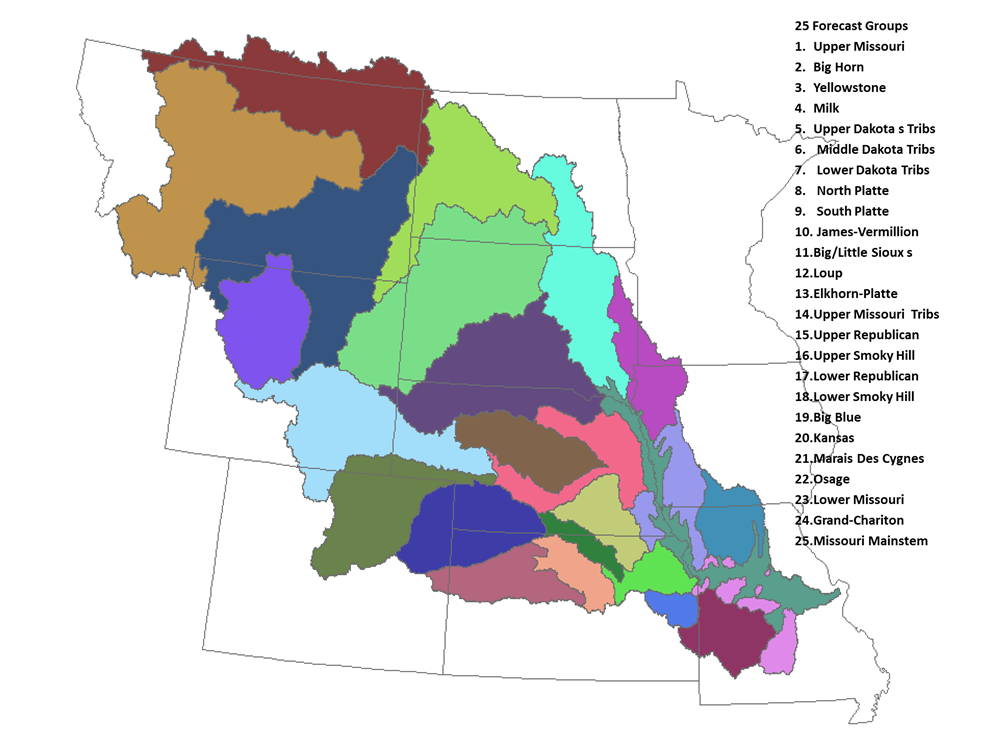
| For the overall forecast quality by Weather Forecast Office (WFO) and Forecast Group (FGRP), the average of netMAE95to5 for all forecast point location in that WFO or FGRP was computed. |
| |
| For the overall forecast bias by WFO and FGRP, the average of netME95to5 for all forecast point location in that WFO or FGRP was computed. |
|
|
|
About the Forecast Quality Categories
|
| The distribution of the MAE values was reviewed and a Bell Curve distribution was determined, breaking the data into five groups, these are: |
| very good: ≥ 0% & < 5% |
| good: ≥ 5% & < 10% |
| fair: ≥ 10% & < 20% |
| poor: ≥ 20% & < 30% |
| very poor: ≥ 30% |
|
|
For Even More Information
|
|
|