Forecast Quality Distribution and Groupings |
||||||
|
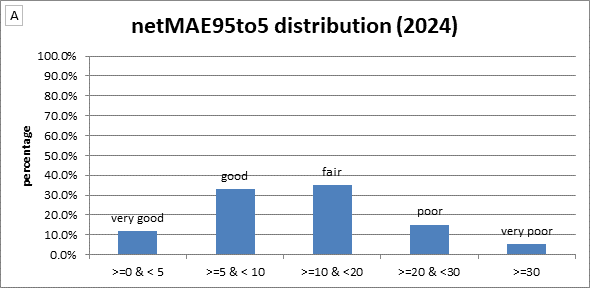
Forecast quality is based on the magnitude of the Mean Absolute Error (MAE) also known as forecast error. MAE is the average error of the absolute value between the difference of forecast and observed value for each forecast exceedance probability category (95%, 90%, 75%, 50%, 25%, 10% and 5%) referred to in this discussion as netMAE95to5. The closer the MAE value is to zero the better the forecast. The Forecast Quality, forecast error based on the netMAE95to5, has five categories, these are:
|
 |
|||||
Overall Forecast Quality |
||||||
| Based on the five groupings described above, here is the overall quality for all forecast point locations that were used in this analysis. Only locations with adequate observations were used. Generally, these are automated gages that have data available around the clock | 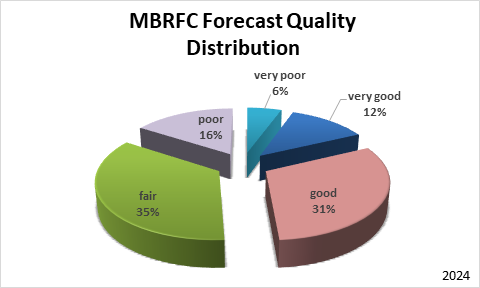 |
|||||
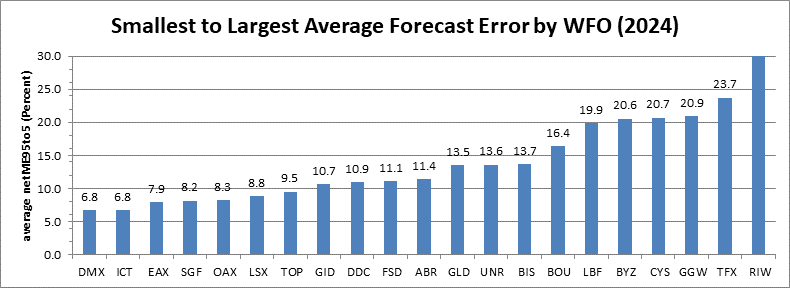
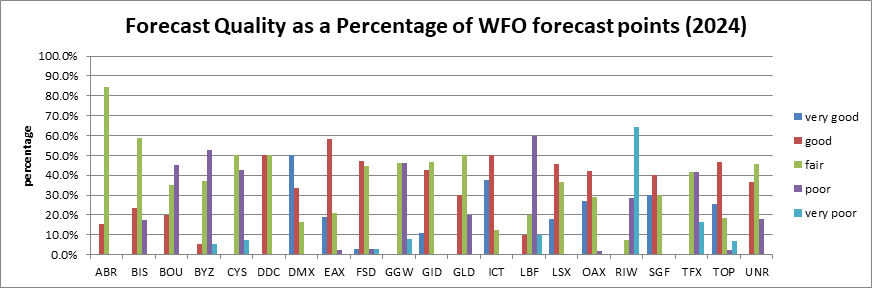
Forecast Quality by Weather Forecast Office |
||||||
|
 |
|||||
 |
||||||
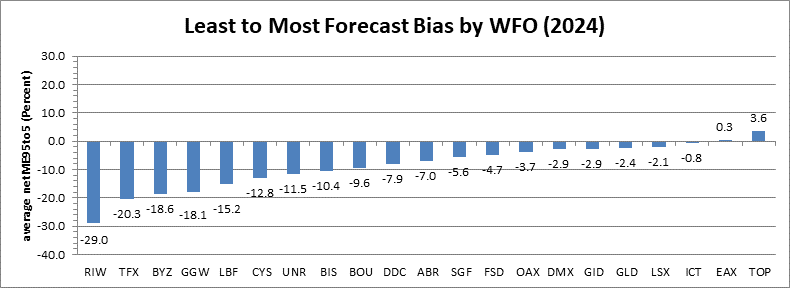
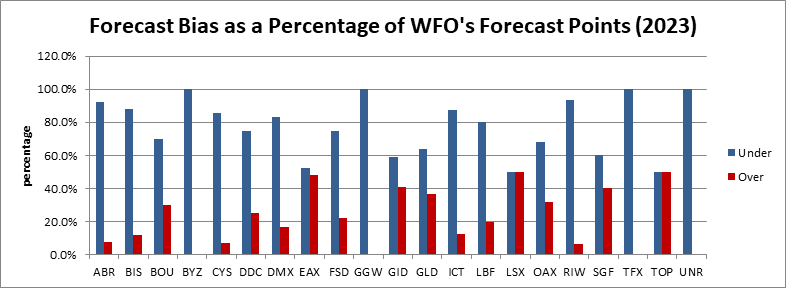
Forecast Bias by Weather Forecast Office |
||||||
|
Forecast bias is based on the magnitude of the Mean Error (ME). ME is the average error of between the difference of forecast and observed value for each forecast exceedance probability category (95%, 90%, 75%, 50%, 25%, 10% and 5%) referred to in this discussion as netME95to5.
|
 |
|||||
 |
||||||
Data Analysis Summary by WFO and Forecast Point Location Identifier |
||||||
|
For each location designated by an NWS location identifier (NWSLI) in the table below there are two rows of information. Row 1 contains the NWSLI, the observed exceedance percentage for each forecast exceedance probability (column header PCT), and (sum/cnt) column where sum is the number of occurrences and cnt is the total number of forecasts for each probability category. Row 2 contains for each forecast exceedance probability whether it was under forecast, over forecast, or spot-on (no bias), followed by the difference of the forecast exceedance probability and observed exceedance percentage. At the end of the row are the net Mean Absolute Error and net Mean Error based on the average of all the categories (95% thru 5%) and a subset of the categories, 90% thru 10%. |
||||||
| Click here for text file | ||||||
| Click here for comma delimited file | ||||||

