
Gusty winds are expected from portions of the Mid-Atlantic into the Northeast through the night following the system that brought rain to the area. An atmospheric river will move into the Northwest late today into Saturday bringing moderate to heavy rainfall, mountain snow, windy conditions, and high surf to the area over the weekend. Read More >
|
|
|
A greater aspect of our weather and climate is its variability. This variability ranges over many time and space scales such as localized thunderstorms and tornadoes, to larger-scale storms, to droughts, to multi-year, multi-decade and even multi-century time scales.
Some examples of this longer time-scale variability might include a series of abnormally mild or exceptionally severe winters, and even a mild winter followed by a severe winter. Such year-to-year variations in the weather patterns are often associated with changes in the wind, air pressure, storm tracks, and jet streams that enclose areas far larger than that of your particular region. At times, the year-to-year changes in weather patterns are linked to specific weather, temperature, and rainfall patterns occurring throughout the world due to the naturally occurring phenomena known as El Niño and La Niña. The following tabs will define two teleconnections and provide links to the current conditions.
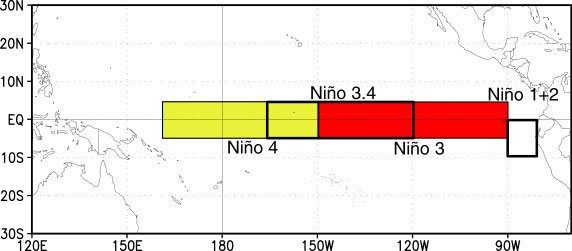
More information can be found at www.cpc.ncep.noaa.gov/ El Niño/Southern Oscillation (ENSO)The ENSO Cycle refers to the evident and sometimes very strong year-to-year variations in sea-surface temperatures, convective rainfall, surface air pressure, and atmospheric circulation that occur across the equatorial Pacific Ocean. El Niño and La Niña represent opposite extremes in the ENSO cycle. The term El Niño refers to the large-scale ocean-atmosphere climate phenomenon linked to an occasional warming in sea-surface temperatures across the central and east-central equatorial Pacific (between approximately the date line and 120°W). El Niño represents the warm phase of El Niño/Southern Oscillation (ENSO) Cycle, and is sometimes referred to as a Pacific warm episode. The term La Niña refers to periodic cooling of ocean surface temperatures in central and east-central equatorial Pacific. La Niña represents the cool phase of the ENSO cycle, and is sometimes referred to as a Pacific cold episode.
The above graph shows the four regions that temperature anomalies are measured in the equatorial Pacific. Niño 3.4 is the predominant region used to determine the stage of the ENSO cycle.
Oceanic Niño Index (ONI)
To be classified as a full-fledged El Niño or La Niña "episode", these thresholds must be exceeded for a period of at least 5 consecutive overlapping 3-month seasons. The ENSO cyle is a naturally occurring phenomenon. The changes in sea surface temperatures affect the distribution of tropical rainfall and atmospheric circulation features. The ENSO cycle also changes the intensity and position of jet streams and storm activity at higher latitudes. ENSO-neutral refers to those periods when neither El Niño nor La Niña is present. These periods coincide with the trasition between El Niño and La Niña events. During the ENSO-neutral periods the ocean temperatures, tropical rainfall patterns, and atmospheric winds over the equatorial Pacific Ocean are near the long-term average.
The above image shows the average sea surface temperatures during an ENSO neutral cycle. Facts about the above image:
The above image shows the average sea surface temperatures for an El Niño (top left), La Niña (top right), with sea surface temperature departures from normal for El Nino (bottom left) and La Nina (bottom right).
Impacts of El Niño and La Niña During El Niño, the jet stream over North America is stronger than average and shifts equatorward. Flow is more zonal than average across central Pacific eastward across the U.S. In the below image, the jet stream during an El Niño cycle is represented with the yellow line. During La Niña, the jet stream over North America is shifted poleward from it's normal position. Flow is more meridional, has more variations, than average over central and eastern Pacific. In the below image, the jet stream during a La Niña cycle is represented with the purple line.
Impacts during El Niño vary across the globe, as well as through seasons. Even though impacts can vary from one El Niño to another, typical impacts for the United States include:
The above image illustrates the different impacts of El Niño during the winter months across the globe. Impacts during La Niña also vary across the globe as well as through the seasons. Even though impacts can vary from one La Niña to another, typical impacts for the United States include:
The above image illustrates the different impacts of La Niña during the winter months across the globe.
Alert System: Types of alerts issued during ENSO An El Niño or La Niña Watch:
An El Niño or La Niña Advisory:
Final El Niño or La Niña Advisory:
NA:
Madden Julian Oscillation Impact The Madden-Julian Oscillation (MJO) is a tropical disturbance that moves eastward around the global tropics with a cycle on the order of 30-60 days. The MJO has wide ranging impacts on the patterns of tropical and extratropical precipitation, atmospheric circulation, and surface temperature around the global tropcs and subtropics.
The MJO is often quite variable, with periods of moderate-to-strong activity followed by periods of little or no activity. Typically, the northern Hemisphere late fall, winter, and early spring have the greatest level of MJO activity.
The MJO tends to be most active during ENSO neutral years, and often absent during strong El Niño events. That is, during strong El Niño events, the eastward movement of the anomalies are not able to persist for very long.
The above image is an example of wave movement through the Pacific Ocean. The image shows wave movement through time, with the oldest image in the top box, and the most recent image in the bottom box.
Two main ways the MJO impacts weather in the US is with both precipitation and surface temperature patterns. The impacts include:
The above image shows the timeline of precipitation events for the west coast for the Pinapple Express.
The Pinapple Express is illustrated in the above image. This event is a result of convection, or thunderstorm activity, in the middle Pacific Ocean carried towards the west coast of the US by the Pacific Jet. In order for this to happen, all of the ingredients must be present. In other words, convection must be taking place at the same time the Pacific jet is present over the area. In the above image:
Local Impacts To East Tennessee The local impacts to the east Tennessee region vary from El Niño cycles to La Niña cycles:
The above image illustrates the average conditions and weather patterns across the US for a moderate to strong El Niño and La Niña events.
To take a closer look at temperature and precipitation effects, the following graphs illustrate the temperature measured from 1950 - 2010 for the Morristown, TN NWS office for each season. The strongest four (4) El Niño years are identified by the red arrows, and the strongest four (4) La Niña years are identified by the blue arrows.
ENSO has different effects in east Tennessee during the different seasons:
MJO Although the MJO typically causes cold air outbreaks on the east coast of the U.S., the affects are too localized and fast moving to represent on a graph of chart for NWS Morristown, TN's forecast area.
El Niño/ La Niña/ MJO For current ENSO conditions, follow the link here:
For the latest ENSO discussion and FAQ's, follow the link here: For the latest MJO discussion and FAQ's, follow the link here: |


 Local Radar
 Huntsville Radar
 Regional Satellite
 Graphical Forecast
 Weather Map