Southeast RFC
River Forecast Center
These graphs are automated model output produced every three hours. To collaborate on the inflow guidance please call our office...770-486-0028 ext 1.
<center>
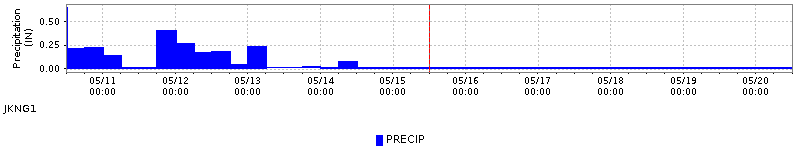
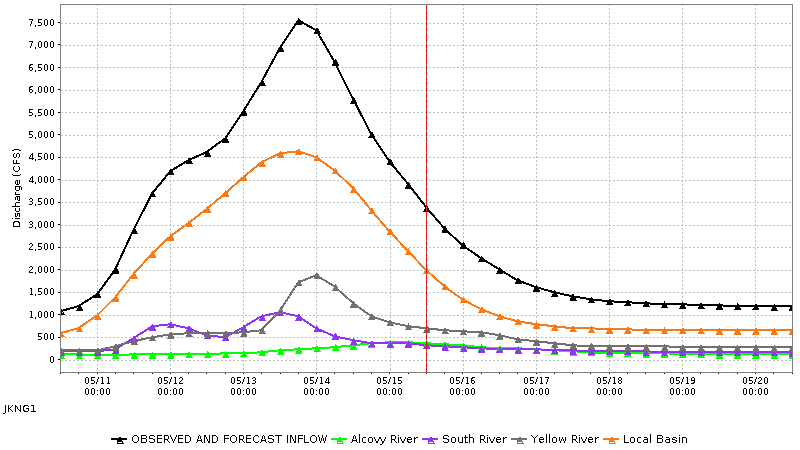
| Jackson Dam Gridded Precipitation Areal Mean Estimate IN | INFLOW River Discharge Simulated Instantaneous CFS | |
|---|---|---|
| 05/10/2025 06GMT | 0.00 | 1044.17 |
| 05/10/2025 12GMT | 0.65 | 1077.09 |
| 05/10/2025 18GMT | 0.22 | 1179.13 |
| 05/11/2025 00GMT | 0.23 | 1460.99 |
| 05/11/2025 06GMT | 0.14 | 2000.28 |
| 05/11/2025 12GMT | 0.00 | 2882.55 |
| 05/11/2025 18GMT | 0.00 | 3697.74 |
| 05/12/2025 00GMT | 0.40 | 4195.42 |
| 05/12/2025 06GMT | 0.27 | 4440.07 |
| 05/12/2025 12GMT | 0.18 | 4603.06 |
| 05/12/2025 18GMT | 0.18 | 4916.80 |
| 05/13/2025 00GMT | 0.04 | 5511.41 |
| 05/13/2025 06GMT | 0.23 | 6167.29 |
| 05/13/2025 12GMT | 0.02 | 6933.16 |
| 05/13/2025 18GMT | 0.01 | 7539.71 |
| 05/14/2025 00GMT | 0.02 | 7330.86 |
| 05/14/2025 06GMT | 0.00 | 6632.57 |
| 05/14/2025 12GMT | 0.08 | 5781.31 |
| 05/14/2025 18GMT | 0.00 | 5017.22 |
| 05/15/2025 00GMT | 0.00 | 4419.22 |
| 05/15/2025 06GMT | 0.00 | 3893.07 |
| 05/15/2025 12GMT | 0.00 | 3377.16 |
| 05/15/2025 18GMT | 0.00 | 2912.39 |
| 05/16/2025 00GMT | 0.00 | 2544.88 |
| 05/16/2025 06GMT | 0.00 | 2252.28 |
| 05/16/2025 12GMT | 0.00 | 2005.66 |
| 05/16/2025 18GMT | 0.00 | 1783.16 |
| 05/17/2025 00GMT | 0.00 | 1614.59 |
| 05/17/2025 06GMT | 0.00 | 1496.13 |
| 05/17/2025 12GMT | 0.00 | 1414.74 |
| 05/17/2025 18GMT | 0.00 | 1361.85 |
| 05/18/2025 00GMT | 0.00 | 1324.03 |
| 05/18/2025 06GMT | 0.00 | 1300.39 |
| 05/18/2025 12GMT | 0.00 | 1279.87 |
| 05/18/2025 18GMT | 0.00 | 1259.01 |
| 05/19/2025 00GMT | 0.00 | 1240.83 |
| 05/19/2025 06GMT | 0.00 | 1225.83 |
| 05/19/2025 12GMT | 0.00 | 1213.48 |
| 05/19/2025 18GMT | 0.00 | 1203.18 |
| 05/20/2025 00GMT | 0.00 | 1194.50 |
| 05/20/2025 06GMT | 0.00 | 1187.14 |
</center>
US Dept of Commerce
National Oceanic and Atmospheric Administration
National Weather Service
Southeast RFC
4 Falcon Drive
Peachtree City, GA 30269
770-486-0028
Comments? Questions? Please Contact Us.

