 Figure 1. Current North Atlantic Oscillation (NAO) Index. Why So Hot This Summer of 2009? Maybe, Blame it on El Niño and the North Atlantic Oscillation Frequently Asked Questions and Answers to Guide You |
|
|
What Is El Niño? The term El Niño was coined when coastal residents of Peru noticed an unusual, early season warming of the nearshore waters and resultant impacts on flora, fauna, and fish. Fishermen noticed a sharp decline in marine life, while those on land would see increased rainfall, leading to greater crop production but also dangerous flooding. Occurring around Christmastime, the phenomenon was named for the Christ Child – El Niño in Spanish. Click here for much more. What is the North Atlantic Oscillation (NAO)? While the NAO is best correlated with winter season weather, there are lesser, but still notable, relationships with summer weather. During the winter, the positive phase (NAO+) increases the strength, incidence, and pathway of winter storms crossing the North Atlantic Ocean between the central latitudes and Greenland. This phase tends to support stormy conditions across northern Europe. Across eastern North America, wetter and milder conditions tend to prevail. During the negative phase (NAO–), weaker subtropical high surface pressure centered closer to the Azores combined with weaker low pressure between Greenland and Iceland leaves fewer and weaker winter storms crossing on an east to west path, increasing rainfall to central and southern Europe. Across eastern North America, drier conditions prevail, but colder temperatures and exact location of individual mid and upper level troughs can increase the snow and ice accumulation. Relationship Between El Niño and the NAO Data show that winter season precipitation is significantly greater, statistically, when El Niño episodes occur during NAO+ than when El Niño occurs during NAO–. For example, Arizona statewide precipitation during El Niño/NAO+ winters averages 56% above normal, but just 9% above normal when El Niño occurs in conjunction with NAO–. This modulation of El Niño winter precipitation by the NAO also occurs in California, Colorado, New Mexico, Oklahoma, Texas, and southern Nevada. Modulation of La Niña winter precipitation by the NAO occurs throughout Texas and Oklahoma. For instance, Oklahoma statewide precipitation during La Niña/NAO- winters averages 20% below normal, while winters featuring La Niña/NAO+ conditions result in slightly above normal precipitation. Click here for local details. El Niño, the NAO, and the RGV Heat Wave Other studies have shown that the blocking pattern of the westerlies that occurs in the transition between the summer and fall over the South Central U.S. and northern Mexico is enhanced during the summer preceding El Ninño episodes. The enhanced pattern triggers more dry weather in August and September from the South Central U.S. into northern Mexico, including the Rio Grande Valley. This high pressure is referred to as "La Canícula". During weak El Niño episodes, a moderate to strong mid level high pressure ridge may set up across the Southwest U.S., with a fairly vigorous trough across the eastern third of North America (Figure 2). Moderate to Strong El Niños shift this ridge westward, blocking out Gulf moisture across Deep South Texas and northern Mexico, creating or intensifying drought through late summer (Figure 3). The pattern shown in Figure 2 match closely with a number of instances this June and July. Recent model trends suggest a return of the Bermuda High to the Southeast U.S. during August, which could signal a transition to the pattern shown in Figure 3. In either case, drought relief for South Texas is not in the cards, at least not yet. While strong correlations between La Canícula and the NAO are not evident in historical data, there is some indication that either a slight NAO–, or a trend toward a NAO– is evident in the historical data. In 1998, the last summer with persistent heat and rain free weather across South Texas, both a strong NAO– and a formerly strong El Niño existed. |
|
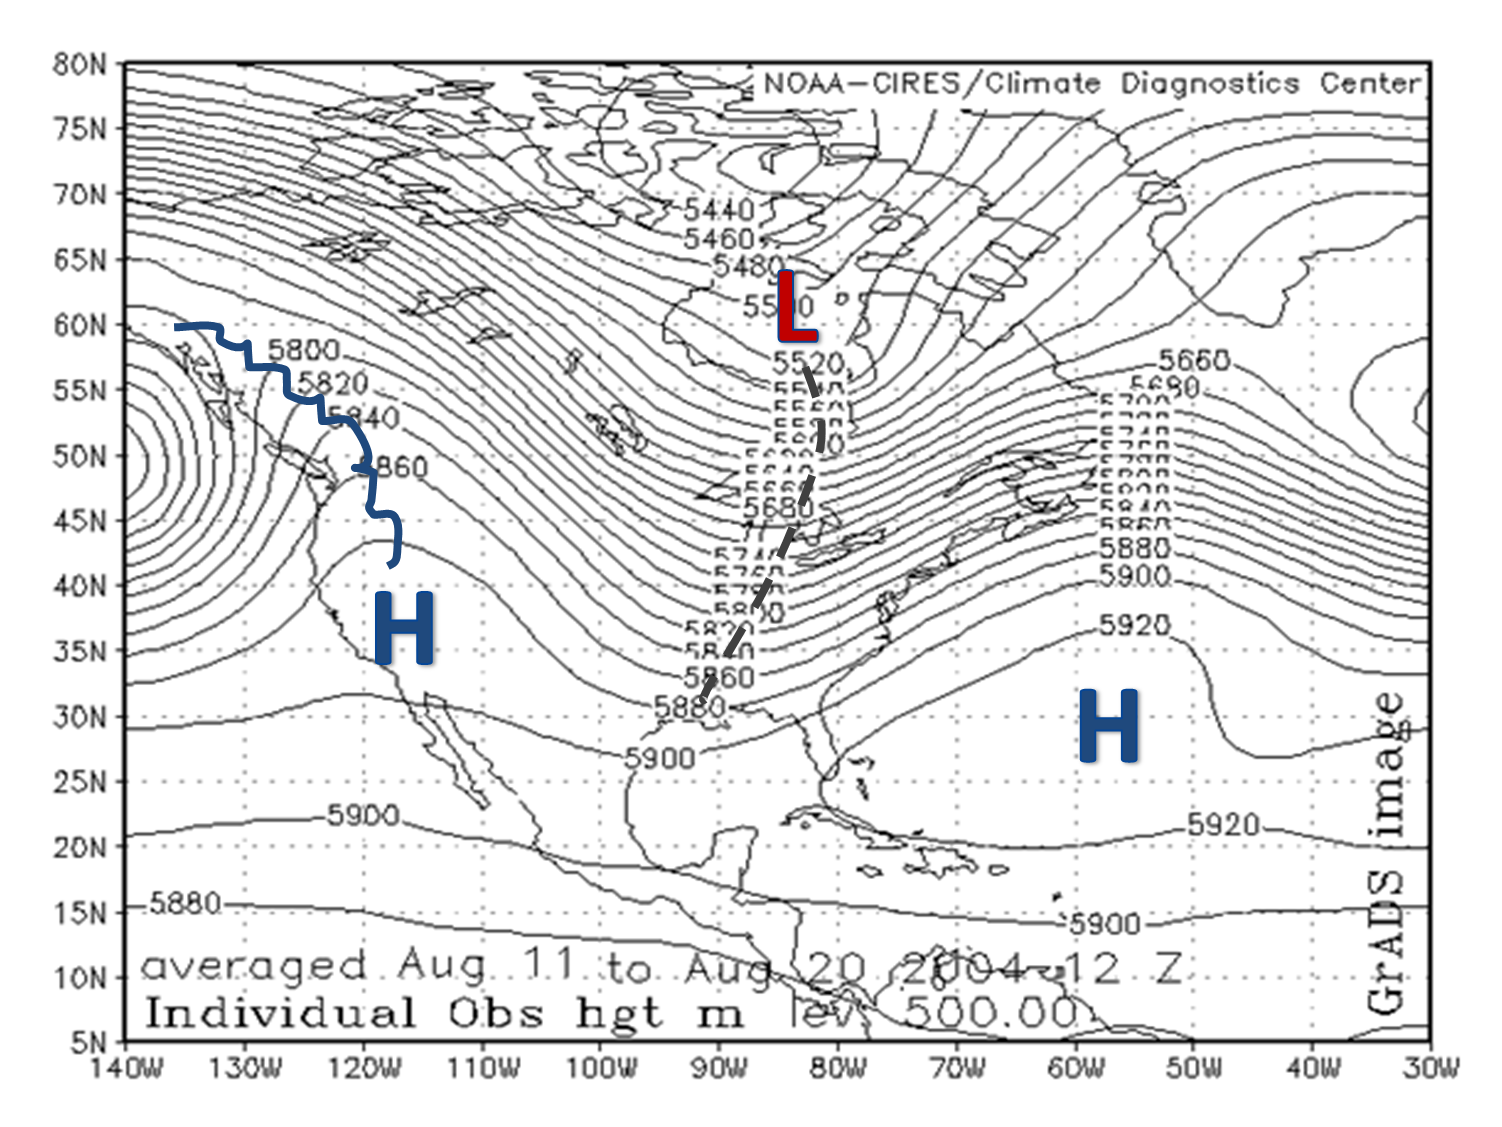
Figure 2. Average 500 mb heights during a weak El Niño episode in late summer (August 12-20 average) across North America. The high pressure ridge is referred to as La Canícula in northern Mexico.
|
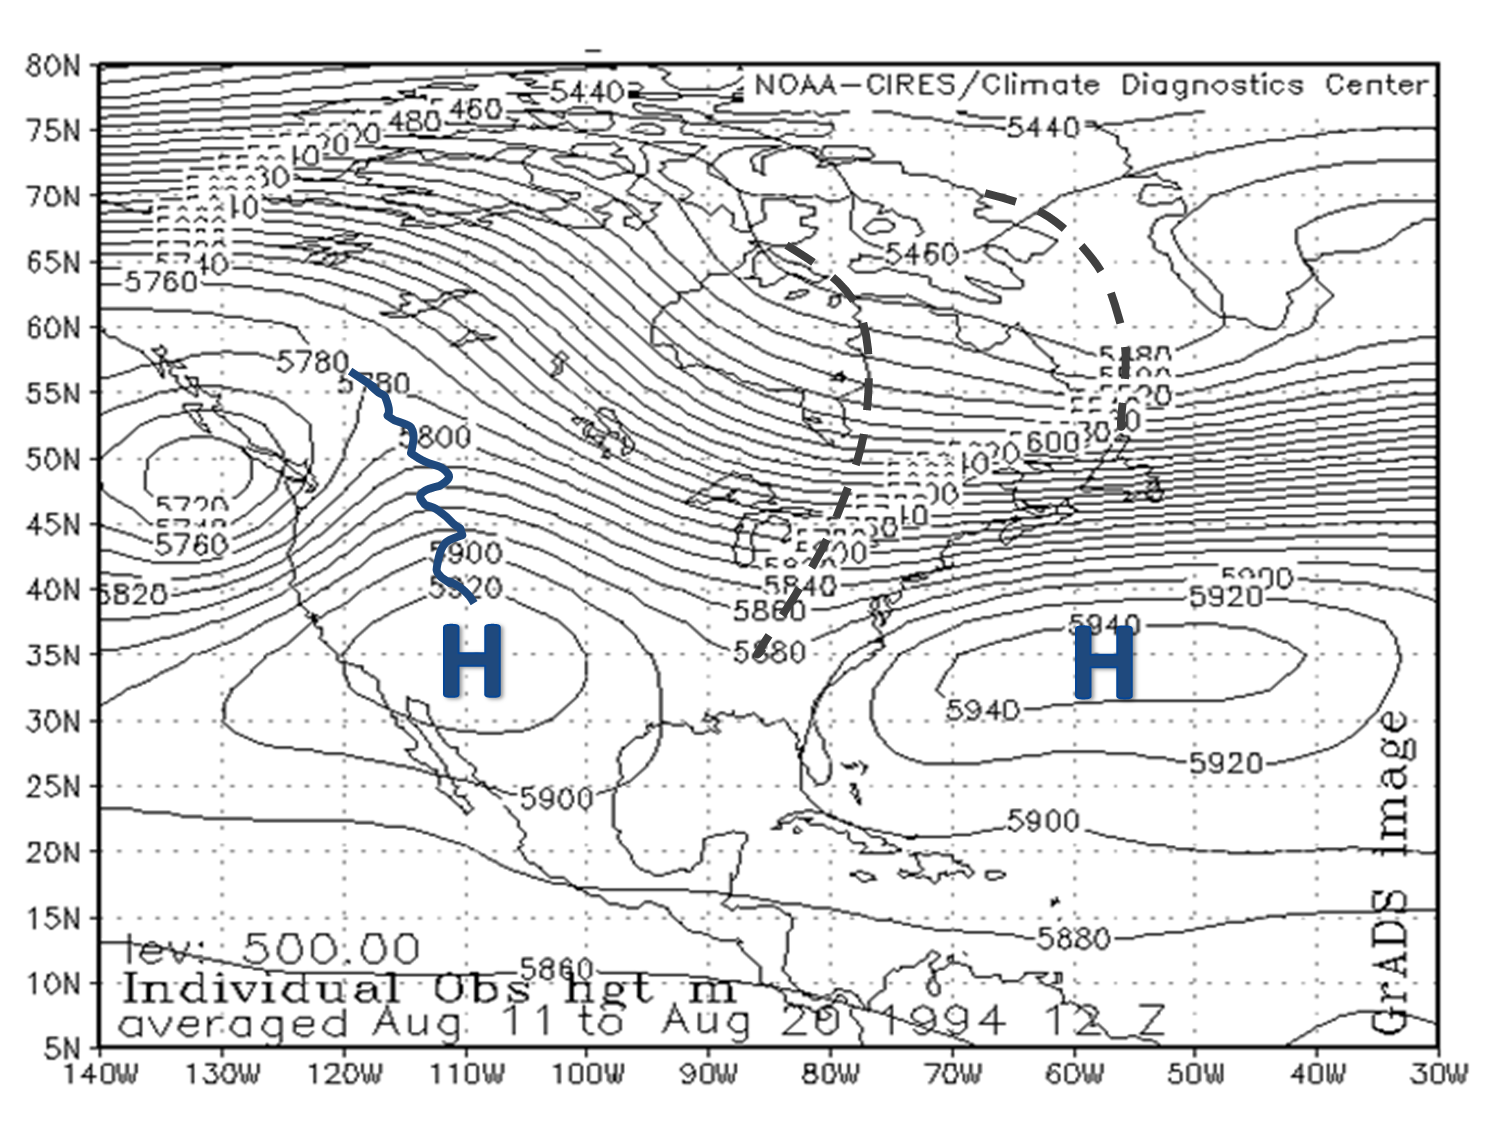
Figure 3. Average 500 mb heights during a moderate/strong El Niño episode in late summer (August 12-20 average) across North America. The high pressure ridge is referred to as La Canícula in northern Mexico.
|
|
What is the El Niño Forecast? 
Figure 4. Coupled Forecast System Ensemble for the 2009/10 El Niño. Three month spans are depicted after August. "ASO"=August through October, "SON"=September through November, etc. Click to enlarge.
|
|
|
References |
|

