|
July 2009: Not Seen Since 1998
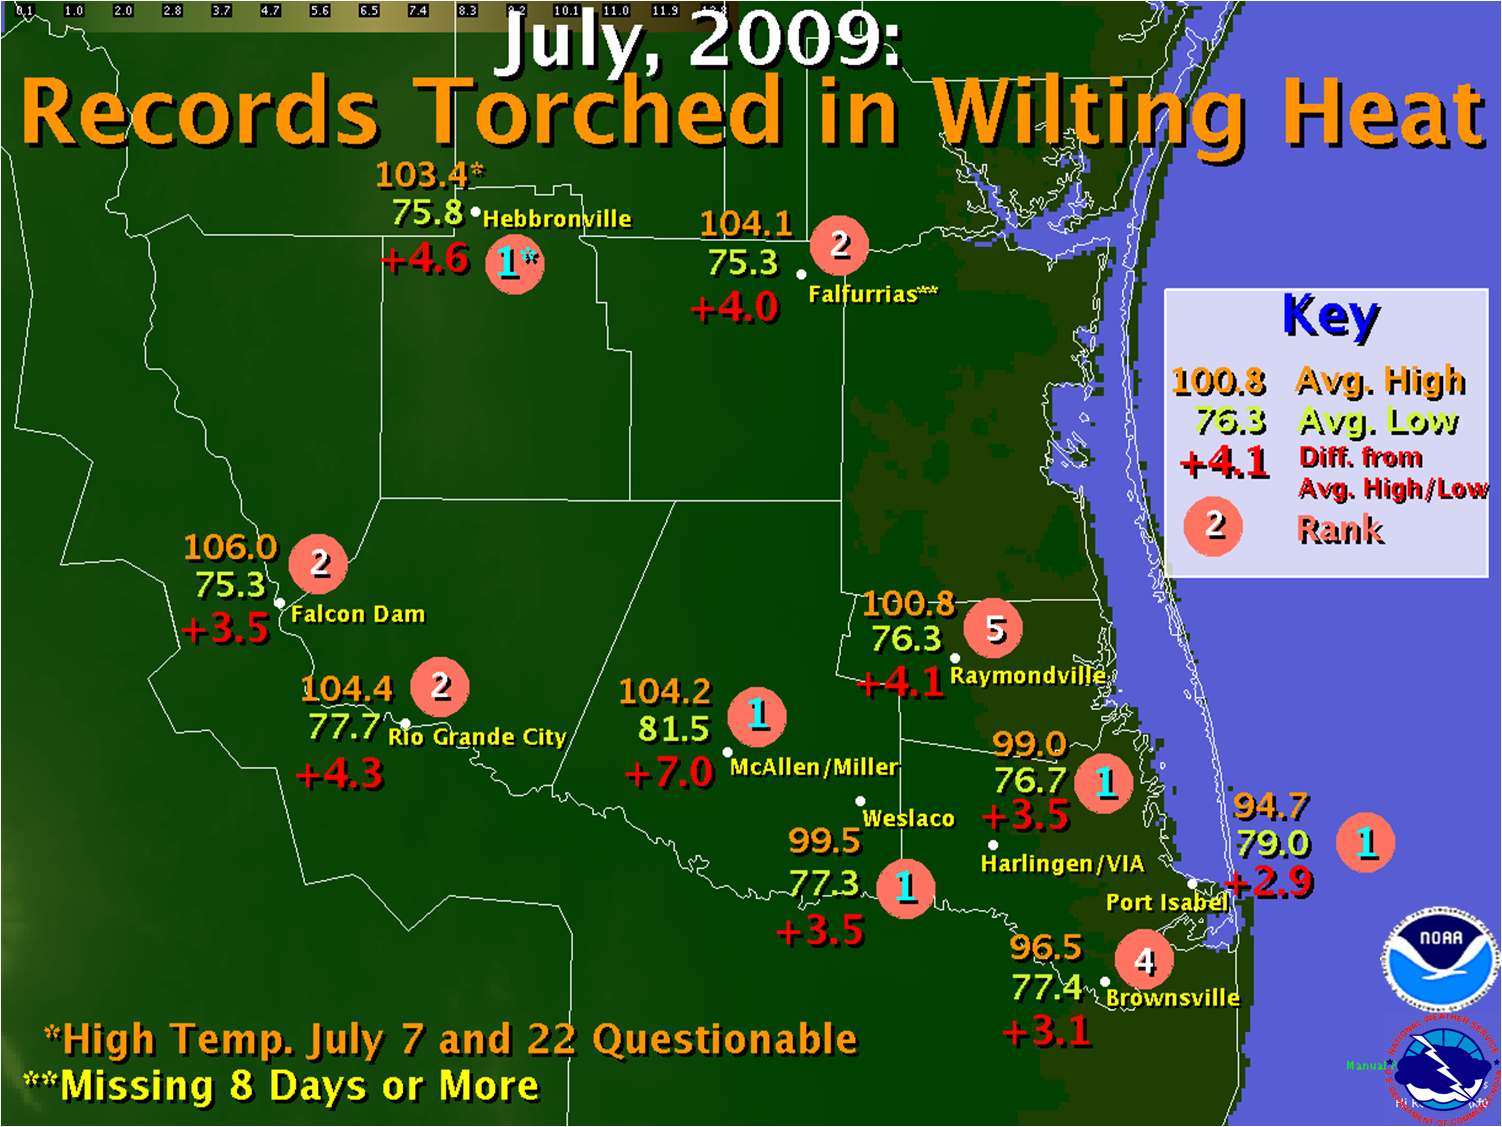
July 2009 will be remembered by many local residents for the heat wave that never quit, particularly inland from the coast. The month long heat wave, accompanied by nearly incessant southerly breezes, frequent intrusions of dry air, intensifying drought, and virtually no rain, was in stark contrast to July, 2008, a month with nearly two feet of rain in some areas, widespread flooding, and daytime temperatures around ten degrees lower, on average. Based on preliminary data (map above and table below), stations in McAllen, Harlingen, Port Isabel, and Weslaco surpassed their previous records set in 1998; most other locations, including those with longer periods of record, finished second all time.
McAllen’s Unique Record, Statistically
The City of McAllen, in particular, was a unique case. At Miller International Airport, the monthly temperature was nearly a whopping 7°F above average. This was a full 2.7°F higher than the previous all time record of 90.1 set in 1998. Twenty–three daily record highs were equalled or exceeded, and 25 record high minimum temperatures did likewise at Miller. In fact, on 18 consecutive days stretching into August, the temperature did not fall below 80°F. This included 16 straight days in July, shattering the previous record of 7 set in June, 1999. For the McAllen cooperative station at the water plant, the monthly temperature was nearly 6°F above average, and 2.1°F higher than the previous all time record of 88.7, also set in 1998.
Based on the 1971–2000 climate normals, the standard deviation (σ) or variability about the mean, for July temperatures is 2.1°F. This value is relatively low, indicating that temperatures on most days in the month of July tend to fall within 2°F of the average based on the 30 year record. Illustrating this point, consider the average daily high temperature for July to be 96.5°F and the daily low temperature to be 75.6°F. Day to day high temperatures falling within one standard deviation would range from 94.4°F to 98.6°F; low temperatures would range from 73.5°F to 77.7°F. Most residents take such change in stride, an expectation of the natural variability of summer weather. Assuming a normal distribution (below), this would account for about 68 percent of all observed temperatures. Moving beyond one σ becomes a matter of statistical significance. At two σ, the upper bound of July high temperatures for McAllen would be 100.7°F. Most residents would take notice of these temperatures, and alter activities slightly to account for the heat. Between two and three σ, the normal distribution assumes only 2.1 percent of the upper bound observations occur. In this case, the upper bound would be 102.8°F, and most residents would consider the day to be unusual.
In 2009, the average July high temperature at Miller International Airport was 104.2°F!!
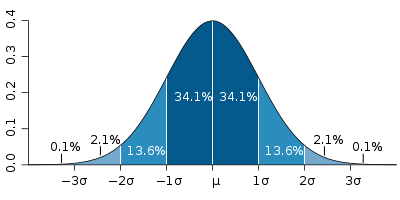
The normal (Gaussian) distribution, also known as the "bell curve". Standard deviations (σ) are evenly spaced on each side of the mean. Image courtesy of Jeremy Kemp, 2005.
Based on a normal distribution, this value might be assumed to fall in the highest 0.1 per cent of all recorded temperatures on any given July day in McAllen. When one considers that the average for the 31 day period was beyond three standard deviations above the 30 year mean, it is beyond question that residents of south central Hidalgo County suffered most from the oppressive heat. Simply put, the July 2009 average temperature was more than one σ above the previous all time record!!
Rainfall: Scarce Commodity
As one might expect during a hot, breezy, dry month, July rainfall fell well short of average, particularly in Hidalgo County, which generally missed out on the few events that did occur. At McAllen/Miller Airport, the monthly total – a single shower that dropped only 0.06 inches – was eighth driest all time. A lone plume of tropical moisture snuck into the eastern portion of the Lower Rio Grande Valley on July 11th, and locally heavy rain focused along the sea breeze into the early afternoon between Brownsville and Harlingen. While each airport received well below an inch, some locations from Cameron Park through Los Fresnos received well over an inch in several hours. Even after the morning rains, temperatures were able to recover well into the 90s during the afternoon. McAllen fell just shy of the century mark, only one of two days to do so in July 2009.
For climate statistics for many locations in the Rio Grande Valley and Deep South Texas, be sure to check out our Local Climate Page.
What About August?
In 1998, the summer heat was "front loaded" – that is, June was almost as oppressive as July, with nearly equal average temperatures, which also broke all time records. In 1998, June was 4 to 5°F above average, more than double the departure from June, 2009, when temperatures were 1.5 to 3°F above average. Now, it’s on to August. In 1998, with a similar atmospheric pattern well established, August began where July left off. For the first half of the month, daytime temperatures reached or exceeded the century mark in many locations, and sultry nights near 80°F were the rule, with temperatures continuing at 3 to 5 degrees above average. Readings slowly backed down for the last half of the month, but not enough to reduce what would be another statistically significant smoker. For the period of June through August, 1998 remains the benchmark. But for how much longer?
That depends on where. Barring a change in the overall pattern, which current model data suggest is unlikely through at least the first half of August, both climate stations in McAllen could see an all time record summer in 2009, barely edging out 1998. Harlingen has an outside chance at nearing the 1998 marker; Brownsville is currently more than a degree shy of its all time summer mark in 1998, but 2009 does rank in or near the top 10.
The Relentless Pattern
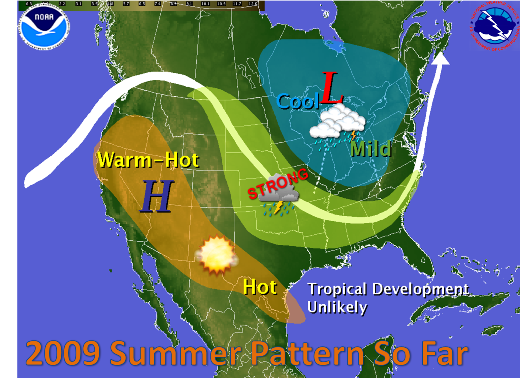
"La Canícula", a persistent ridge of atmospheric high pressure stretching across northern Mexico during the heart of summer, shows no sign of giving an inch anytime soon. A north to northwest flow around this ridge will continue to suppress the arrival of any welcome deep layer tropical moisture into South Texas. Through August 1st (Figure 1, below left), a broad flat trough extending from the east edge of the ridge, from Oklahoma through the upper Mississippi Valley and extending northeast into New England, will allow waves of energy to ride along its base, energizing the atmosphere into strong and severe weather near a stationary front. Farther north, near the core of the trough, fair but pleasantly cool weather will end July and welcome August across the Great Lakes and New England. From August 2nd to the 7th (Figure 2, below right), and probably beyond, the ridge will strengthen and spread east as it has several times before this summer, returning heat to the southern Plains, and likely returning lower surface humidity, along with breezy (rather than windy) conditions to Deep South Texas. One thing won’t change: Temperatures soaring over 100°F each afternoon away from the coast.
Preliminary Records and Rankings
The table below shows average temperatures for July 2009, compared with historical averages since records have been kept. Indeed, July 2009, and perhaps the entire June through August period, won’t be forgotten soon.
Average Temperatures, July 2009 (preliminary data)
|
Station
|
2009 Average
|
Rank
|
All-Time Record
|
Year
|
|
McAllen/Miller Arpt. (since 1961)
|
92.8
|
1
|
90.1
|
1998
|
|
McAllen/Coop (since 1941)
|
90.8²
|
1
|
88.7
|
1998
|
|
Weslaco (since 1914¹)
|
88.4²
|
1
|
87.8
|
1980
|
|
Port Isabel (since 1928¹)
|
86.8²
|
1
|
86.4
|
1998
|
|
Harlingen/Airport (since 1942¹)
|
87.9
|
1
|
87.6
|
1998
|
|
Hebbronville (since 1917¹)
|
89.6³
|
T-1
|
89.6
|
1998
|
|
Harlingen/Coop (since 1911)
|
87.9
|
2
|
88.1
|
1998
|
|
Falfurrias (since 1907)
|
89.7²
|
2
|
89.95
|
1998
|
|
Rio Grande City (since 1900¹)
|
91.1
|
2
|
91.8
|
1998
|
|
Falcon Dam (since 1962)
|
90.6
|
2
|
91.65
|
1998
|
|
Brownsville (since 1871)
|
87.0
|
4
|
87.5
|
1980
|
|
Raymondville (since 1913¹)
|
88.6
|
5
|
89.8
|
1947
|
¹Data incomplete, especially early in 20th century.
²July 2009 missing 8 or more dates (incomplete)
³Suspect Data on 7/8 and 7/23
|

