| Average and Median Rainfall for Lower RGV Stations La Niña and 30–Year Averages Shown |
|
|
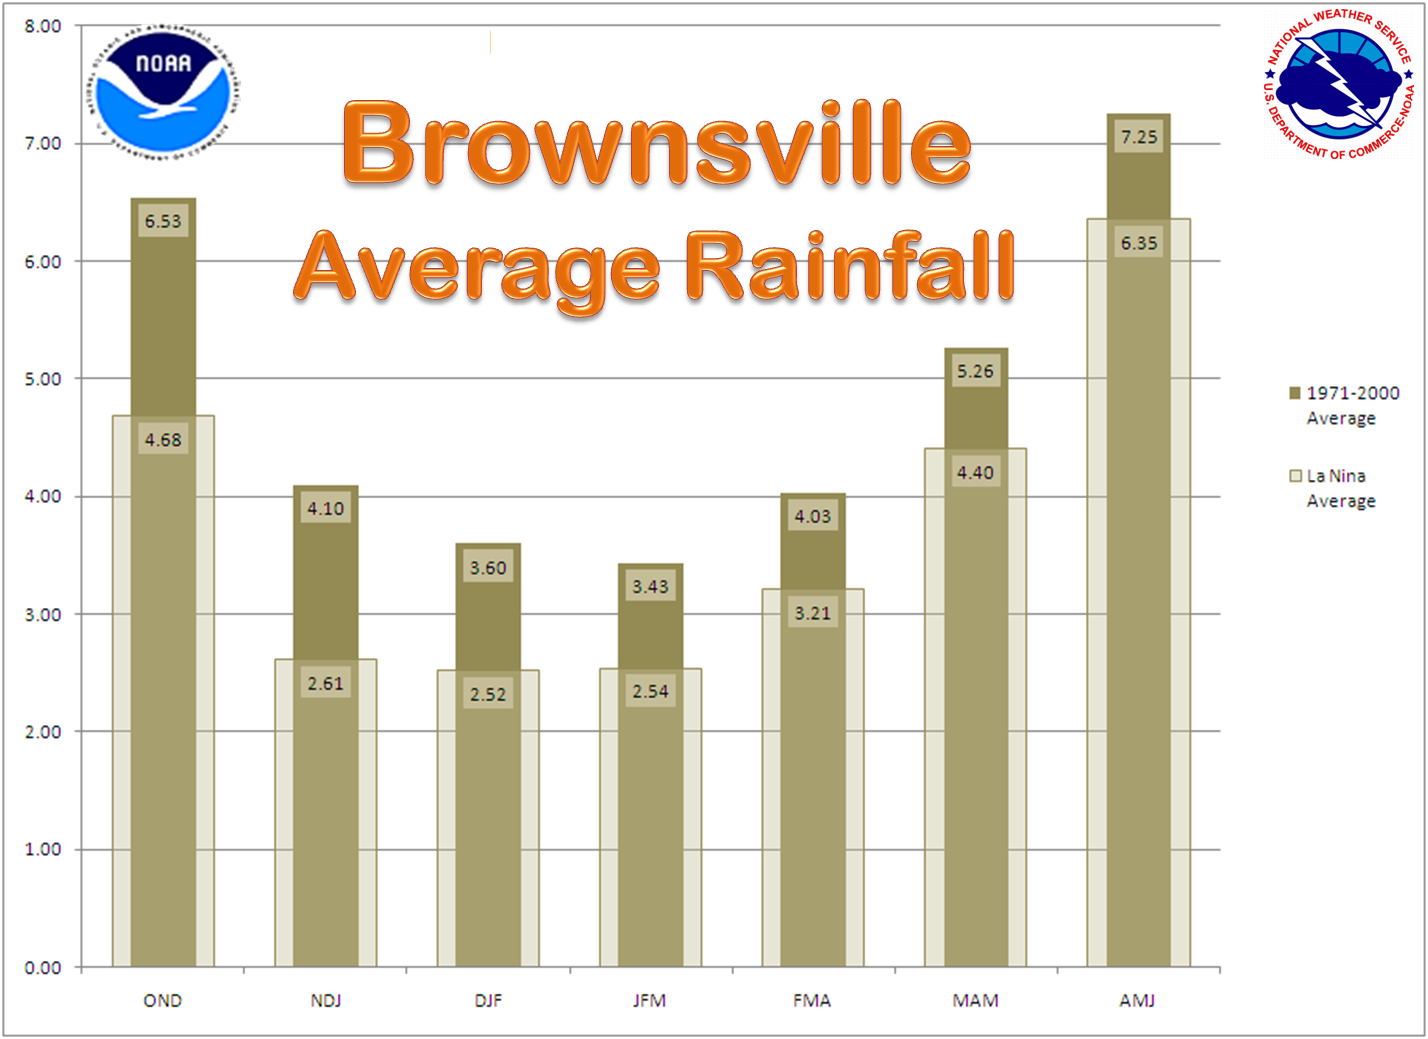
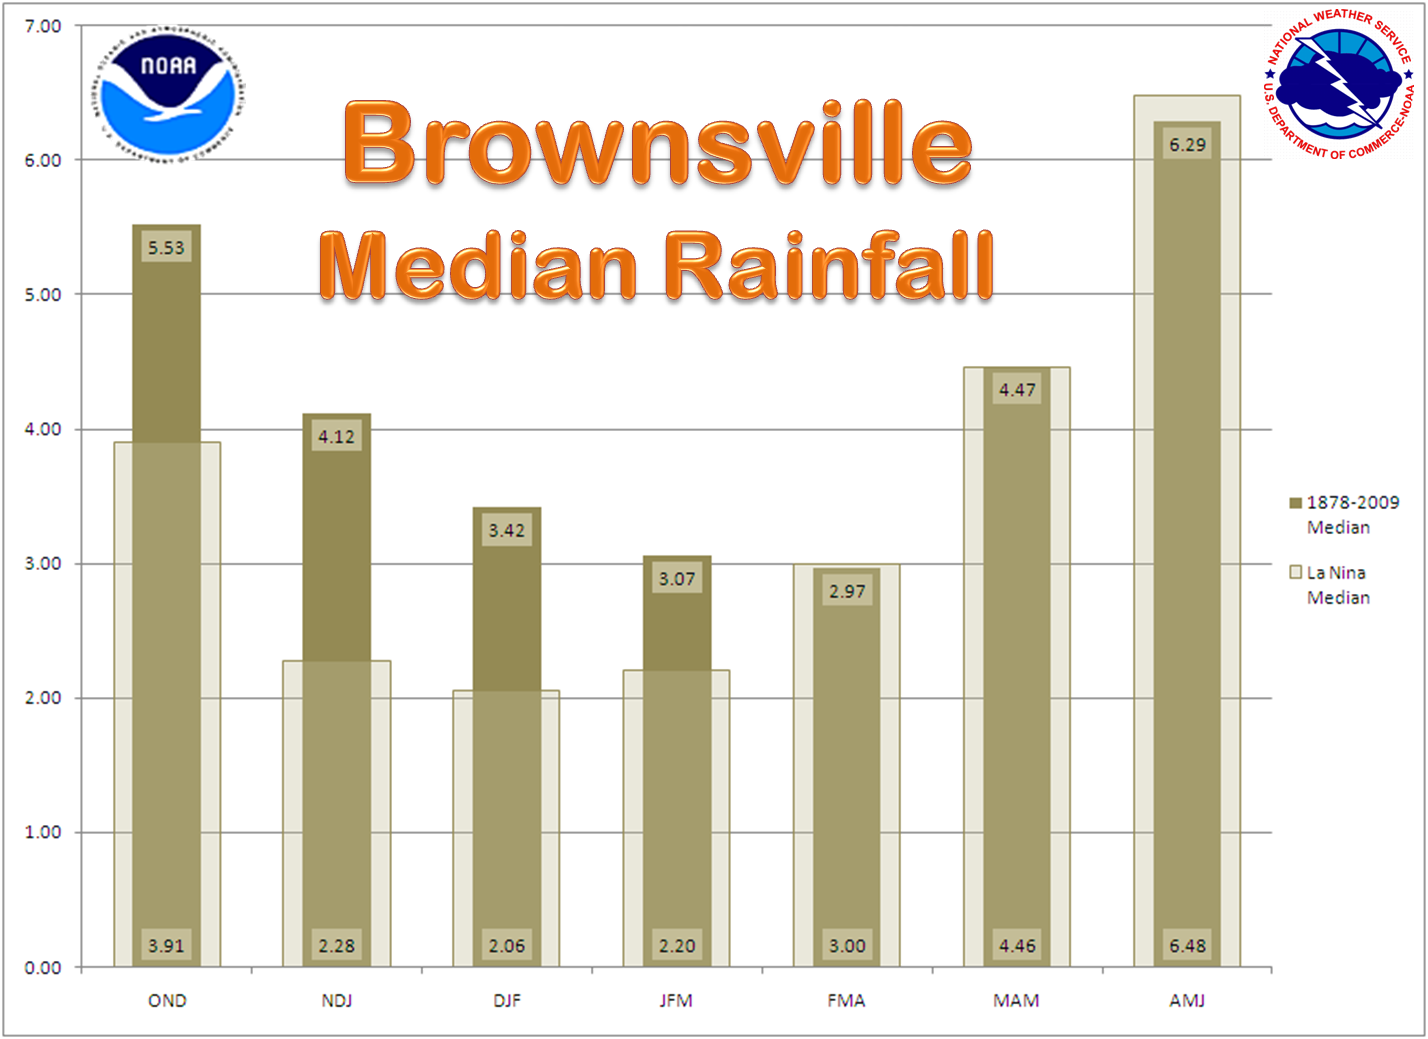
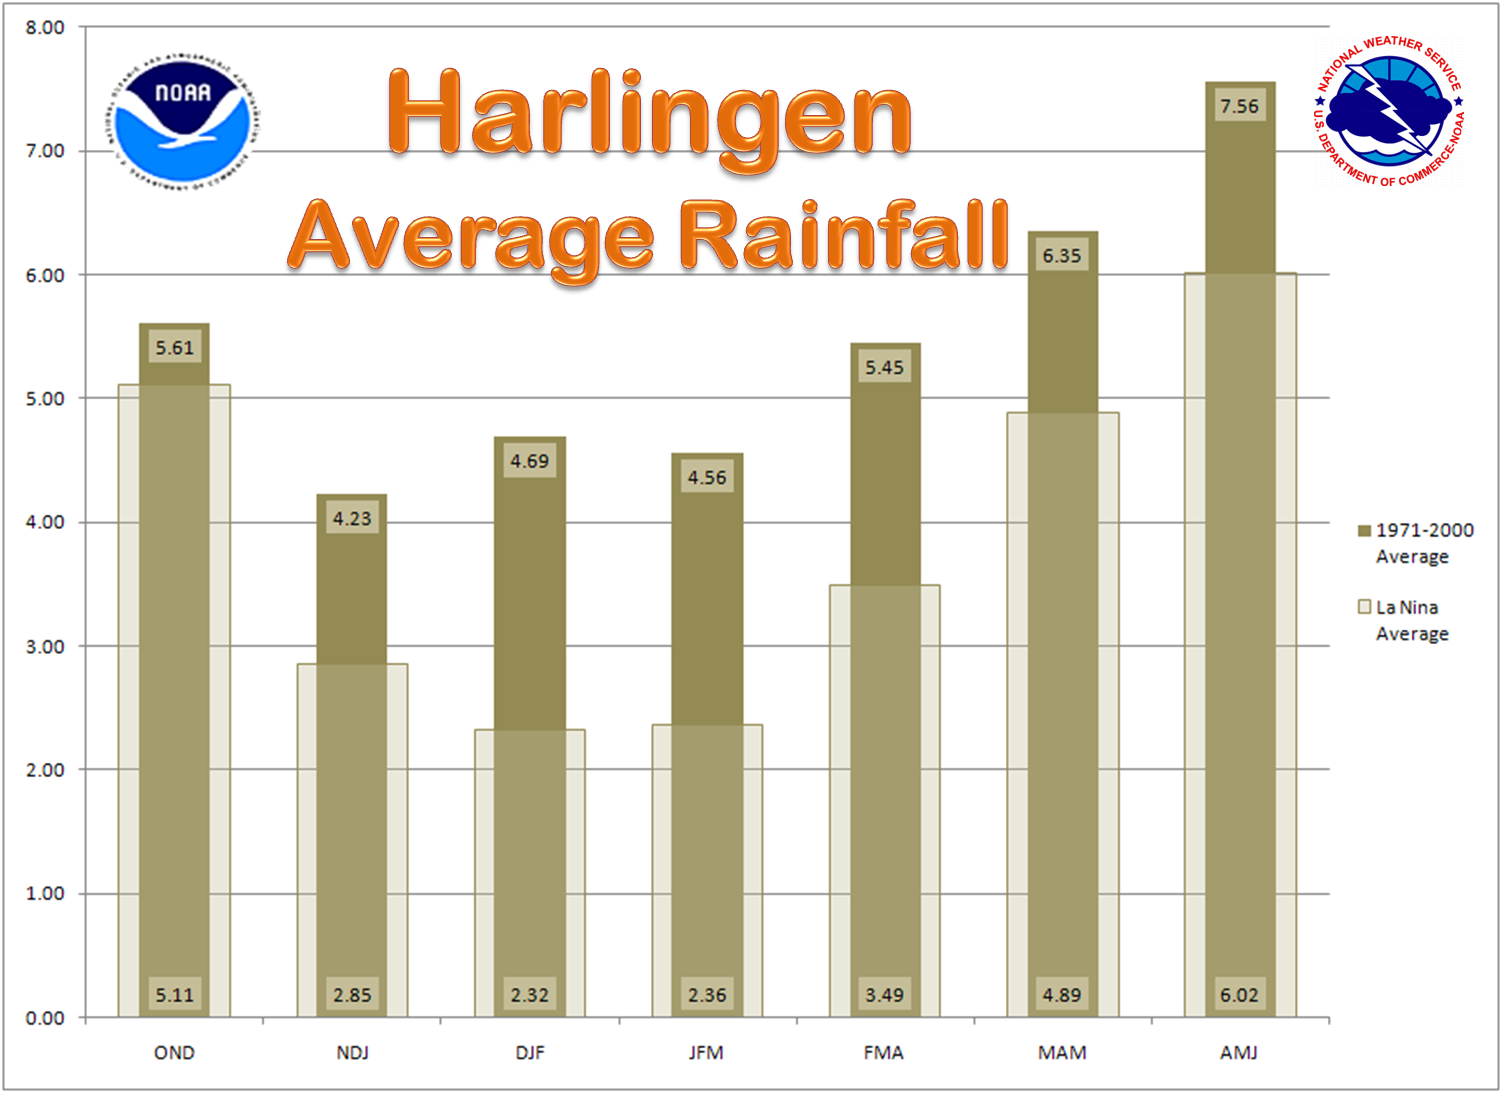
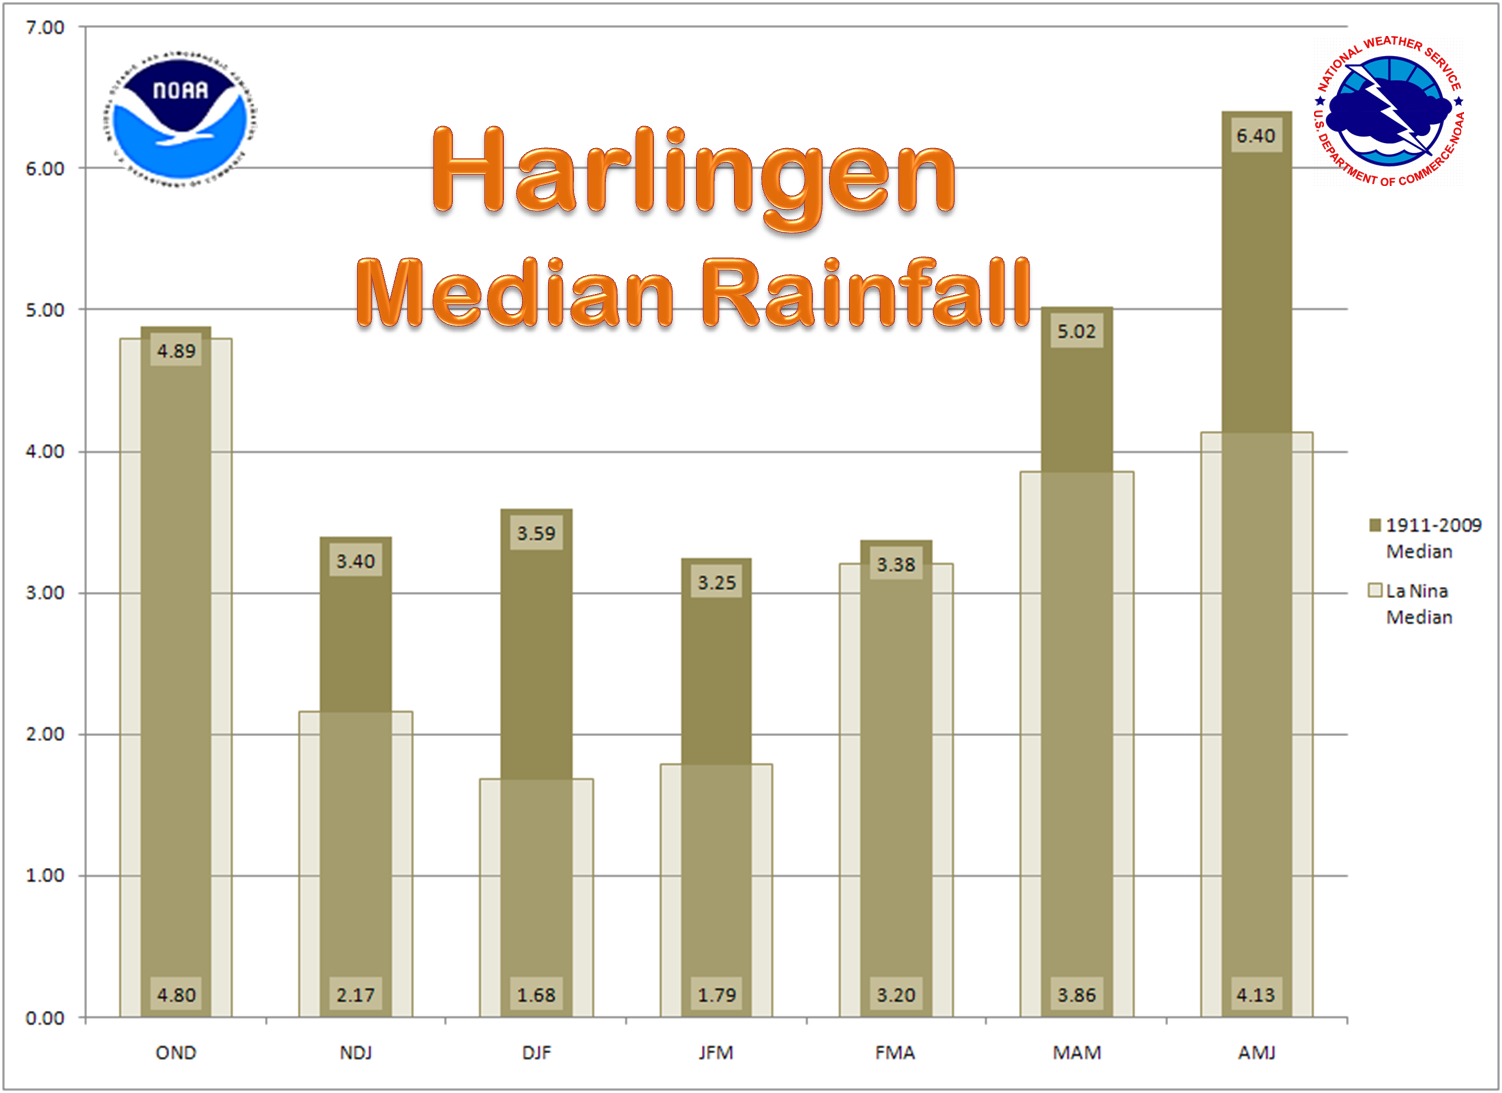
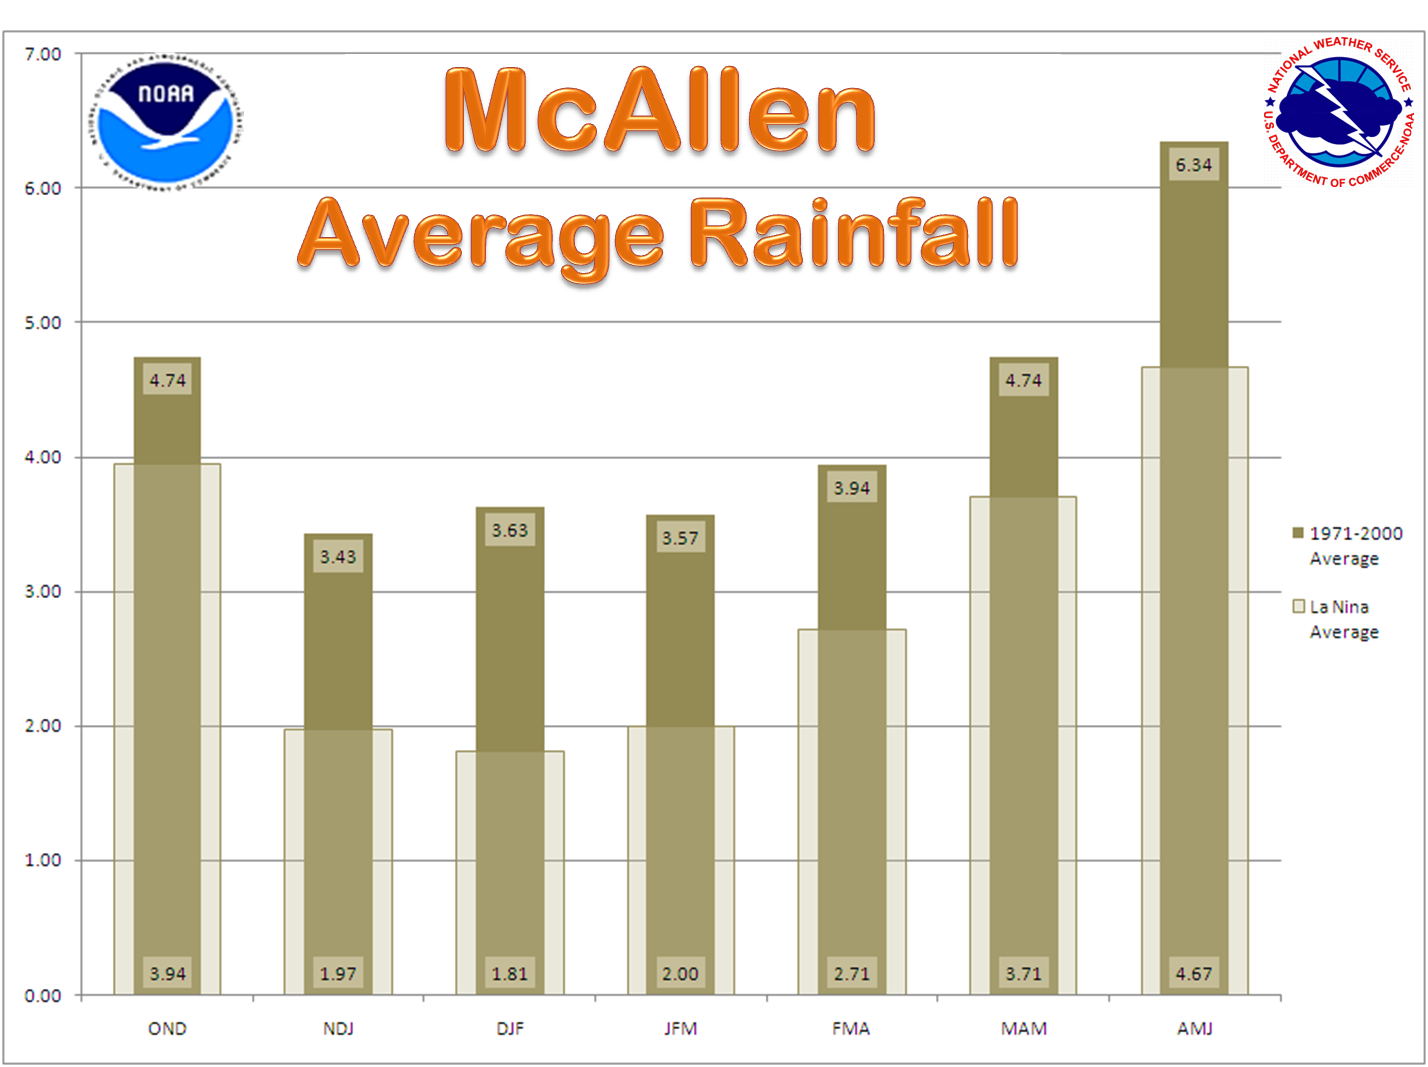
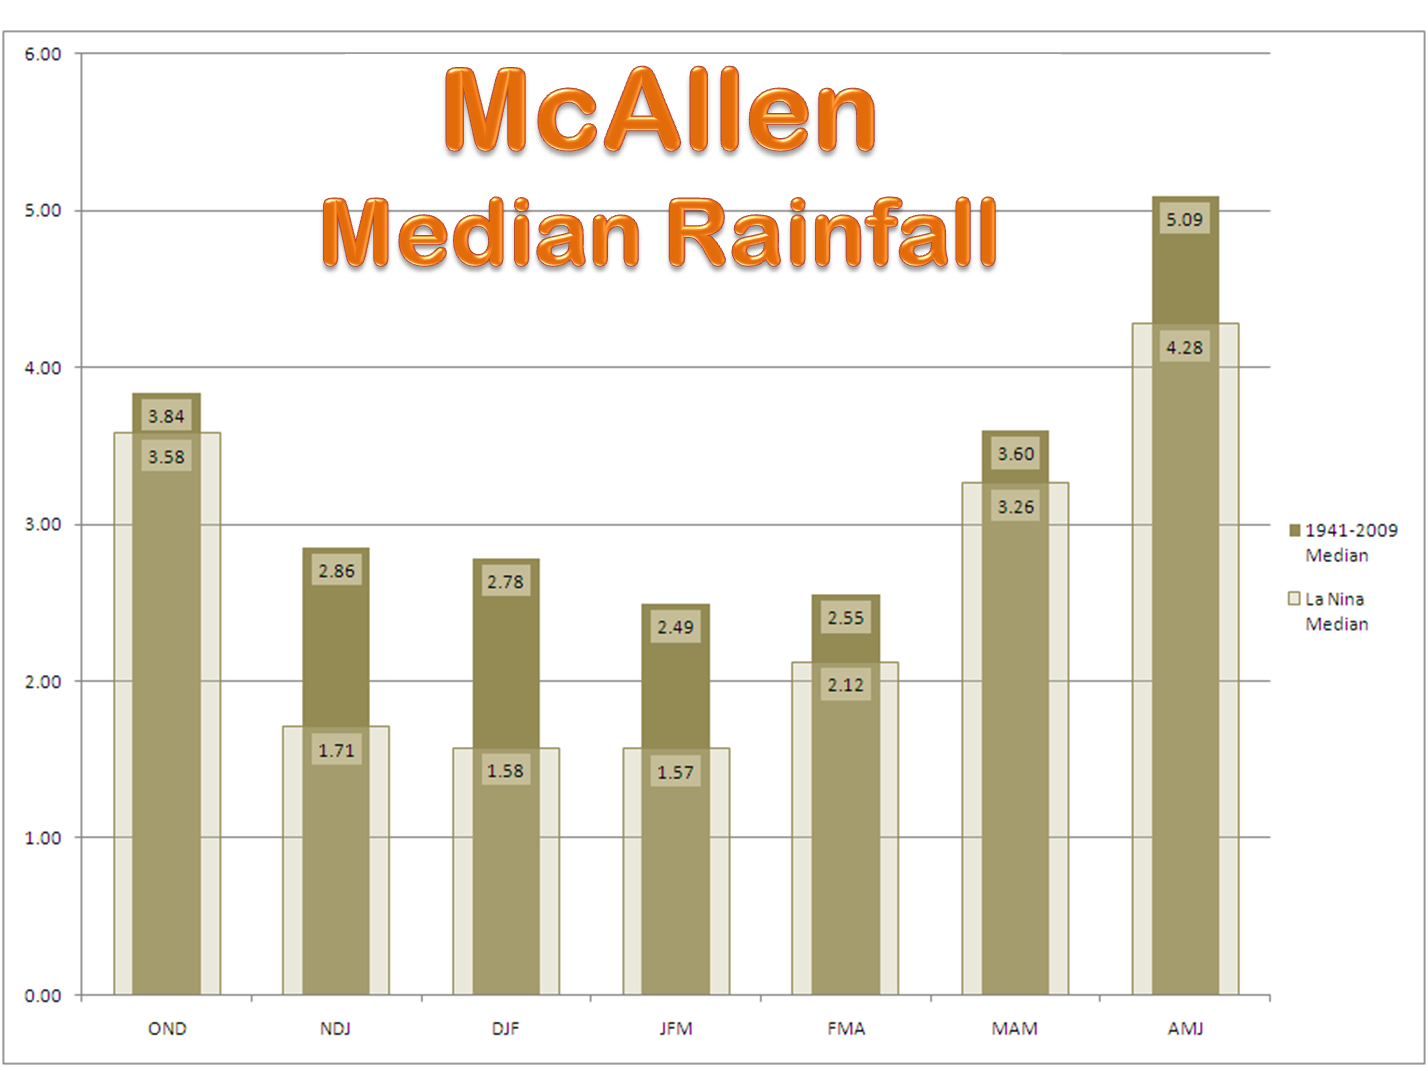
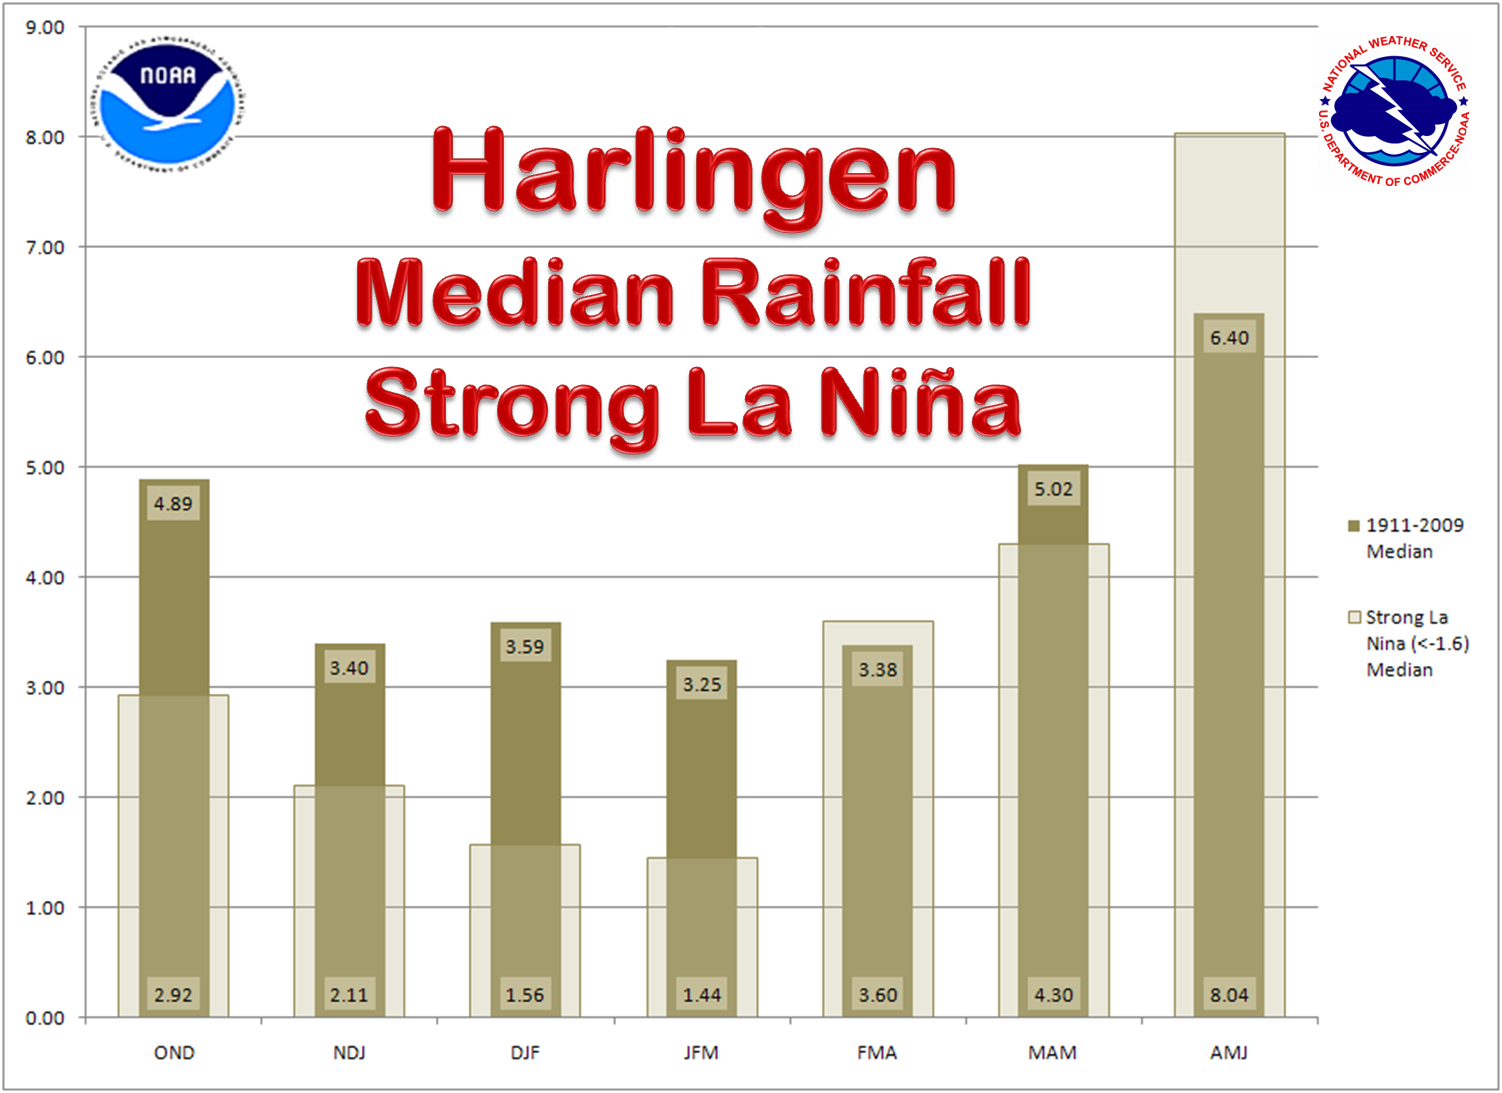
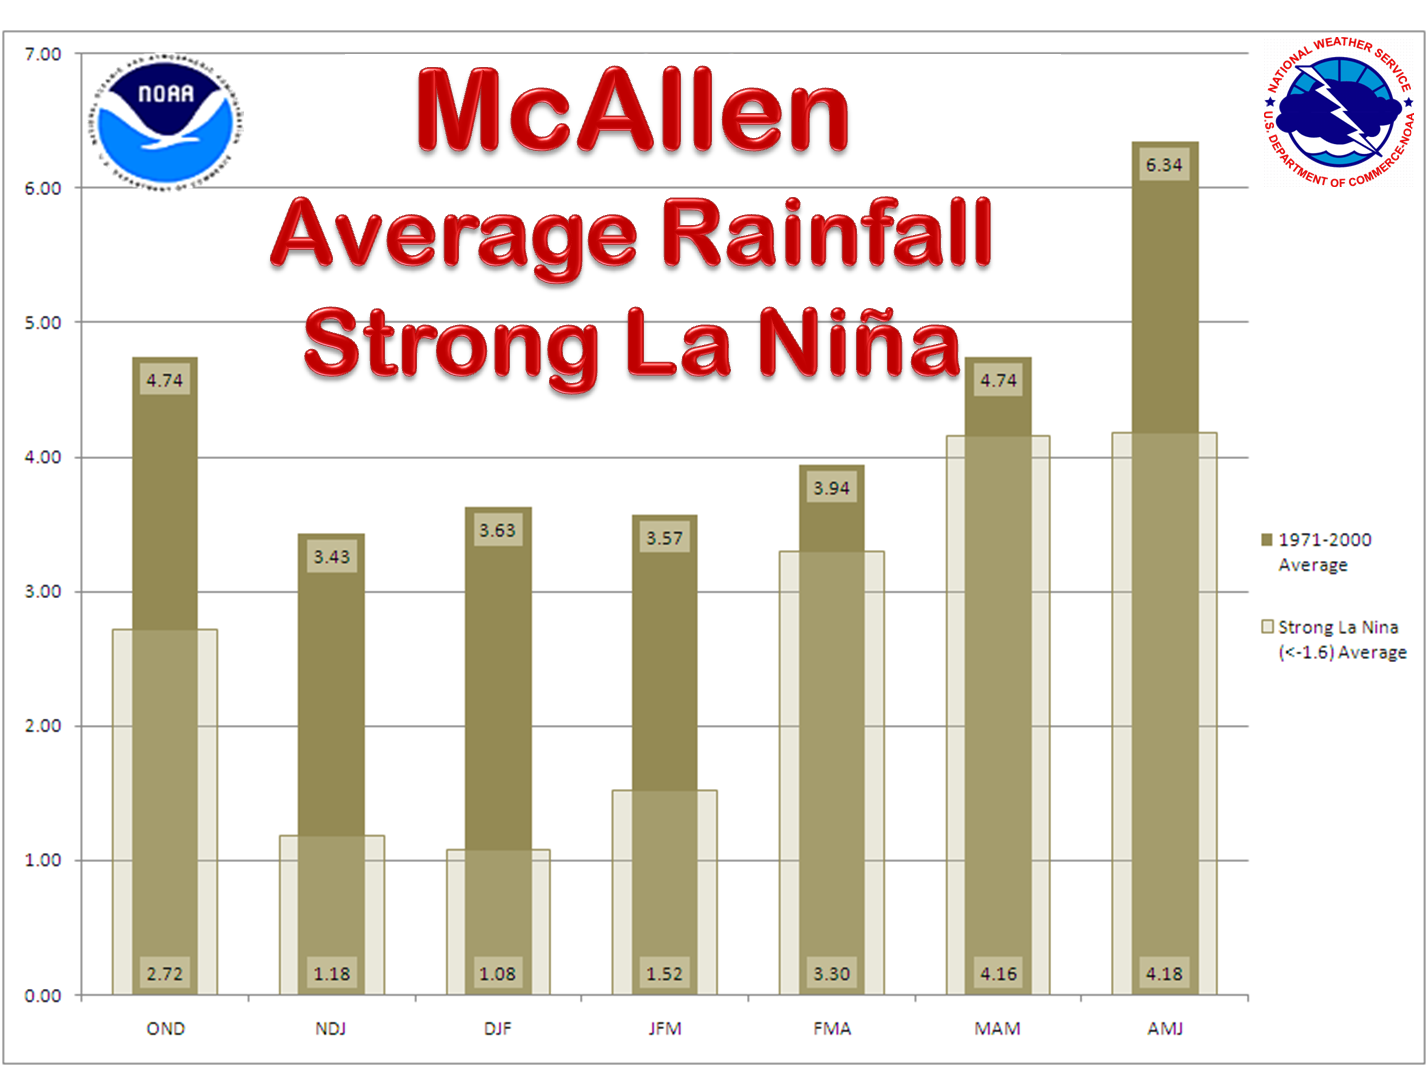
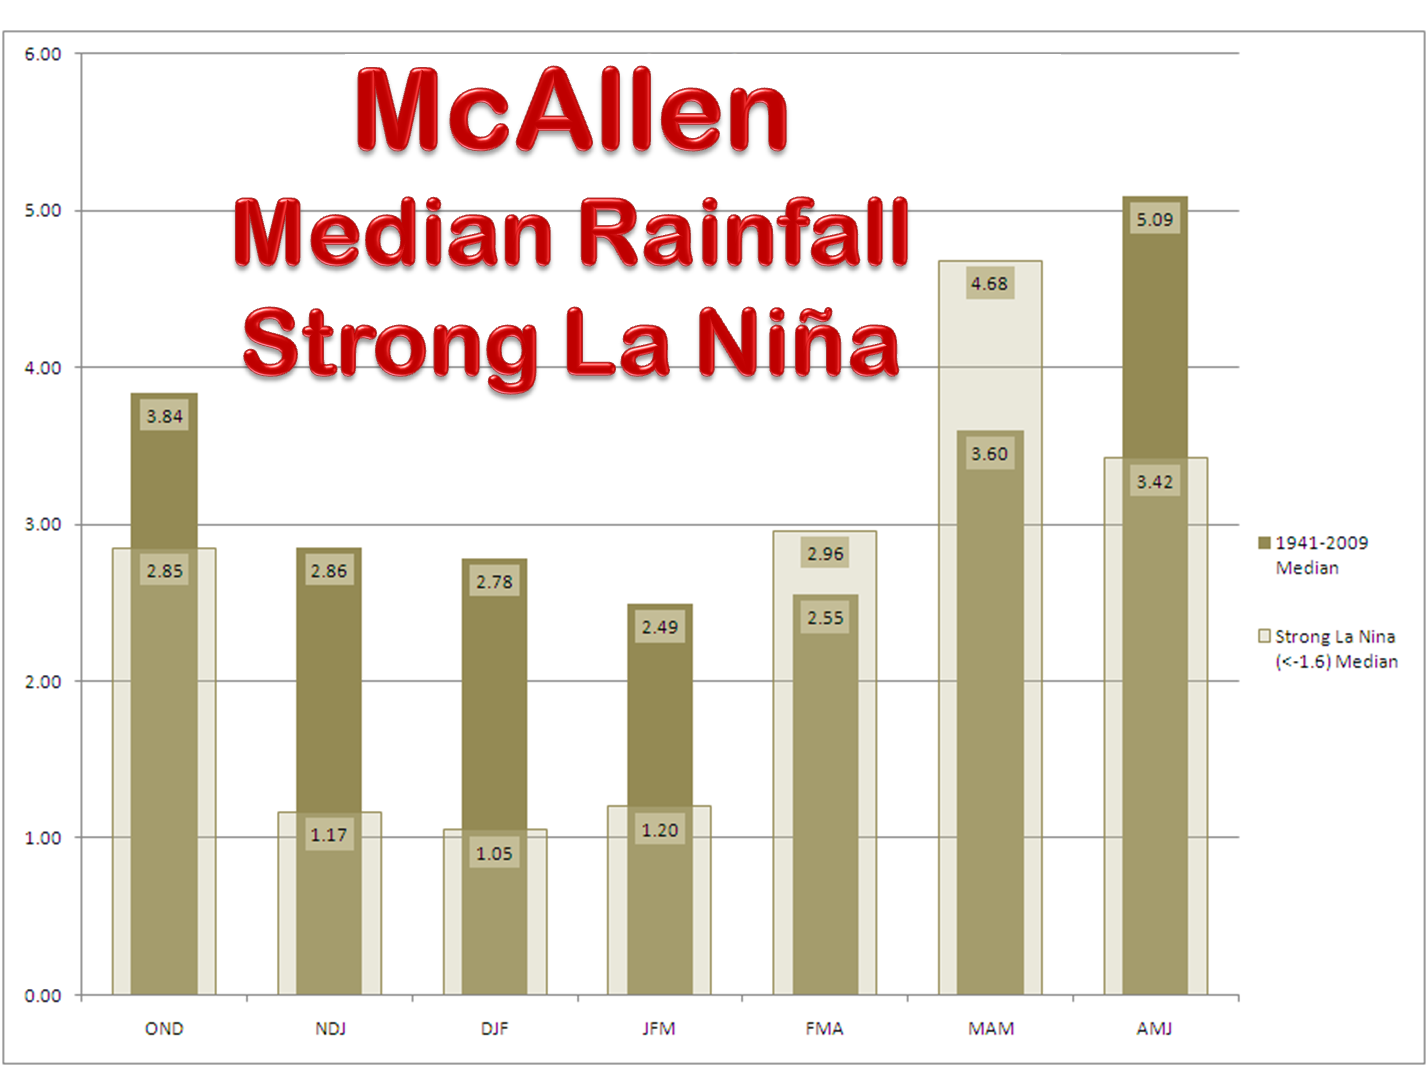
Average and Median Rainfall for Brownsville, Harlingen, and McAllen (All La Niñas) Accumulated rainfall totals for three month intervals are shown. For example, "OND" shows the average rainfall for October through December, "NDJ" shows the average rainfall from November through January, etc. Rainfall values inside each solid bar are for either the 1971 to 2000 period (averages) or for the station period of record (medians); accumulations inside each shaded bar of the chart are for La Niña years. Click on each graphic for a full size image. |
|
 |
 |
 |
 |
 |
 |
|
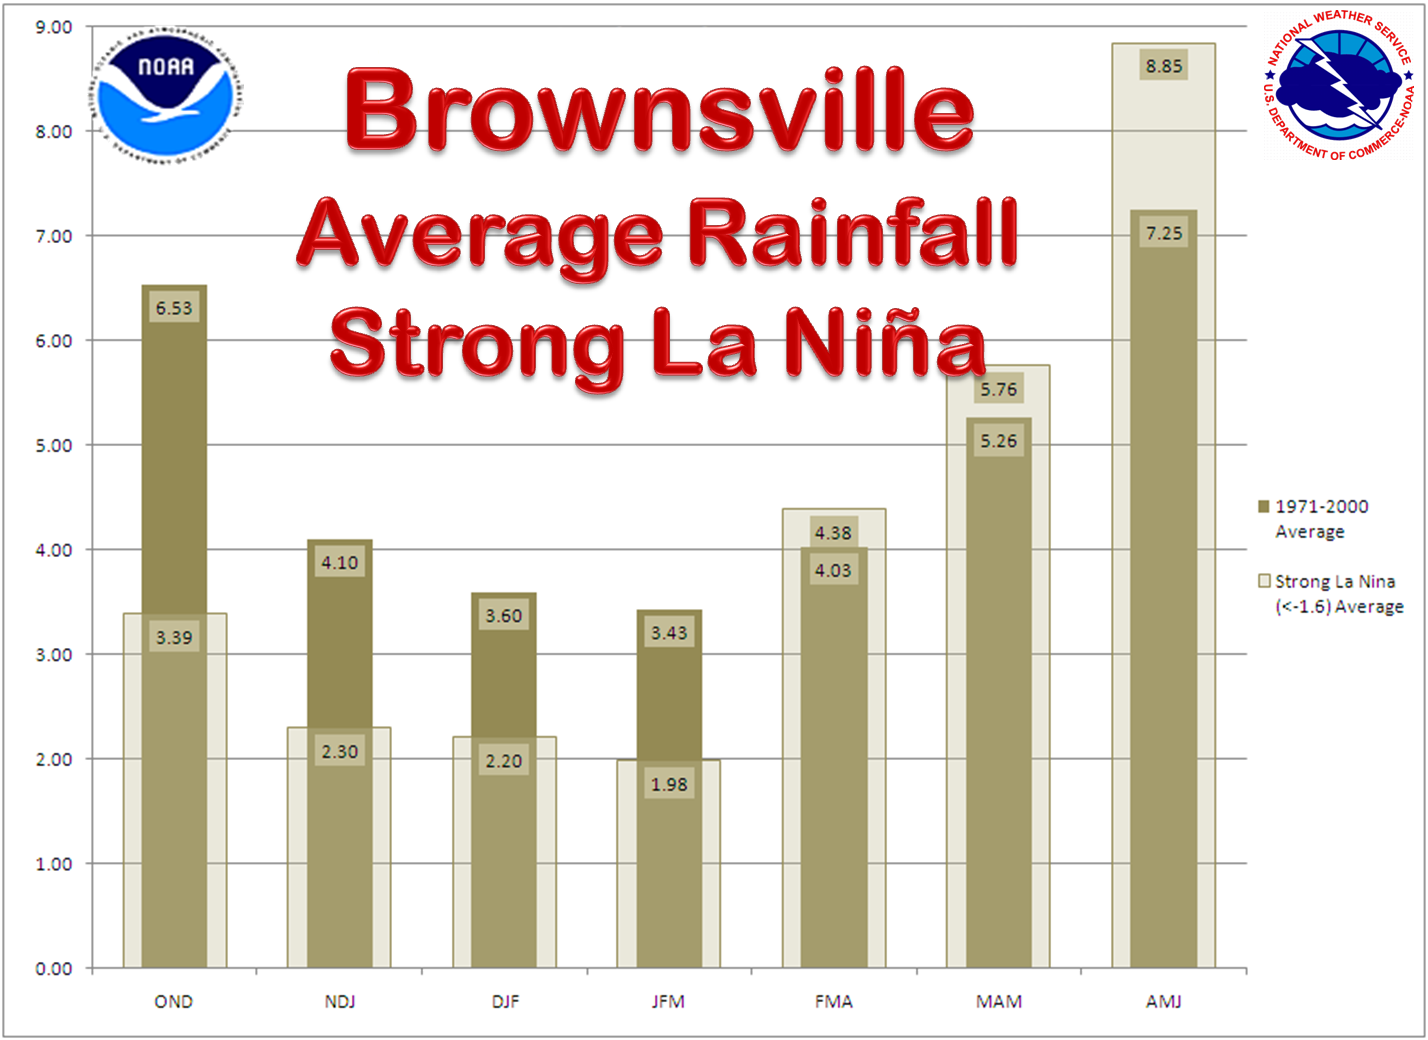
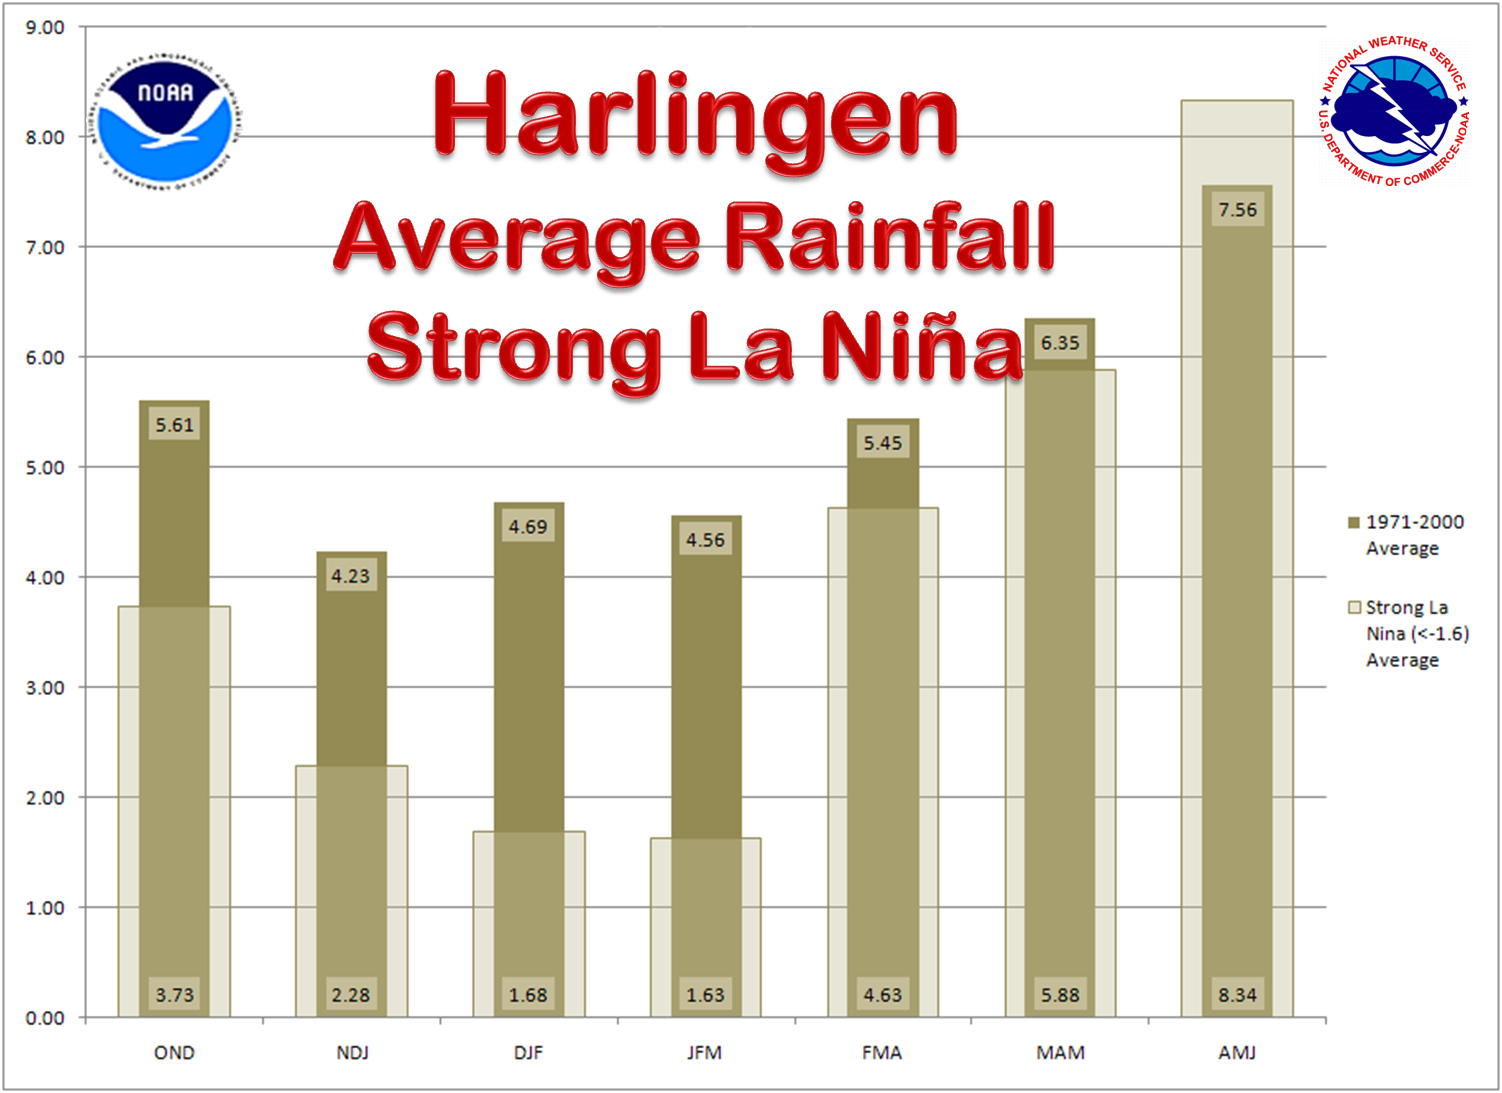
Average and Median Rainfall for Brownsville, Harlingen, and McAllen (Strong La Niñas) |
|
 |
 |
 |
 |
 |
 |
| Return to Article | |

