Brownsville/Rio Grande Valley, TX
Weather Forecast Office
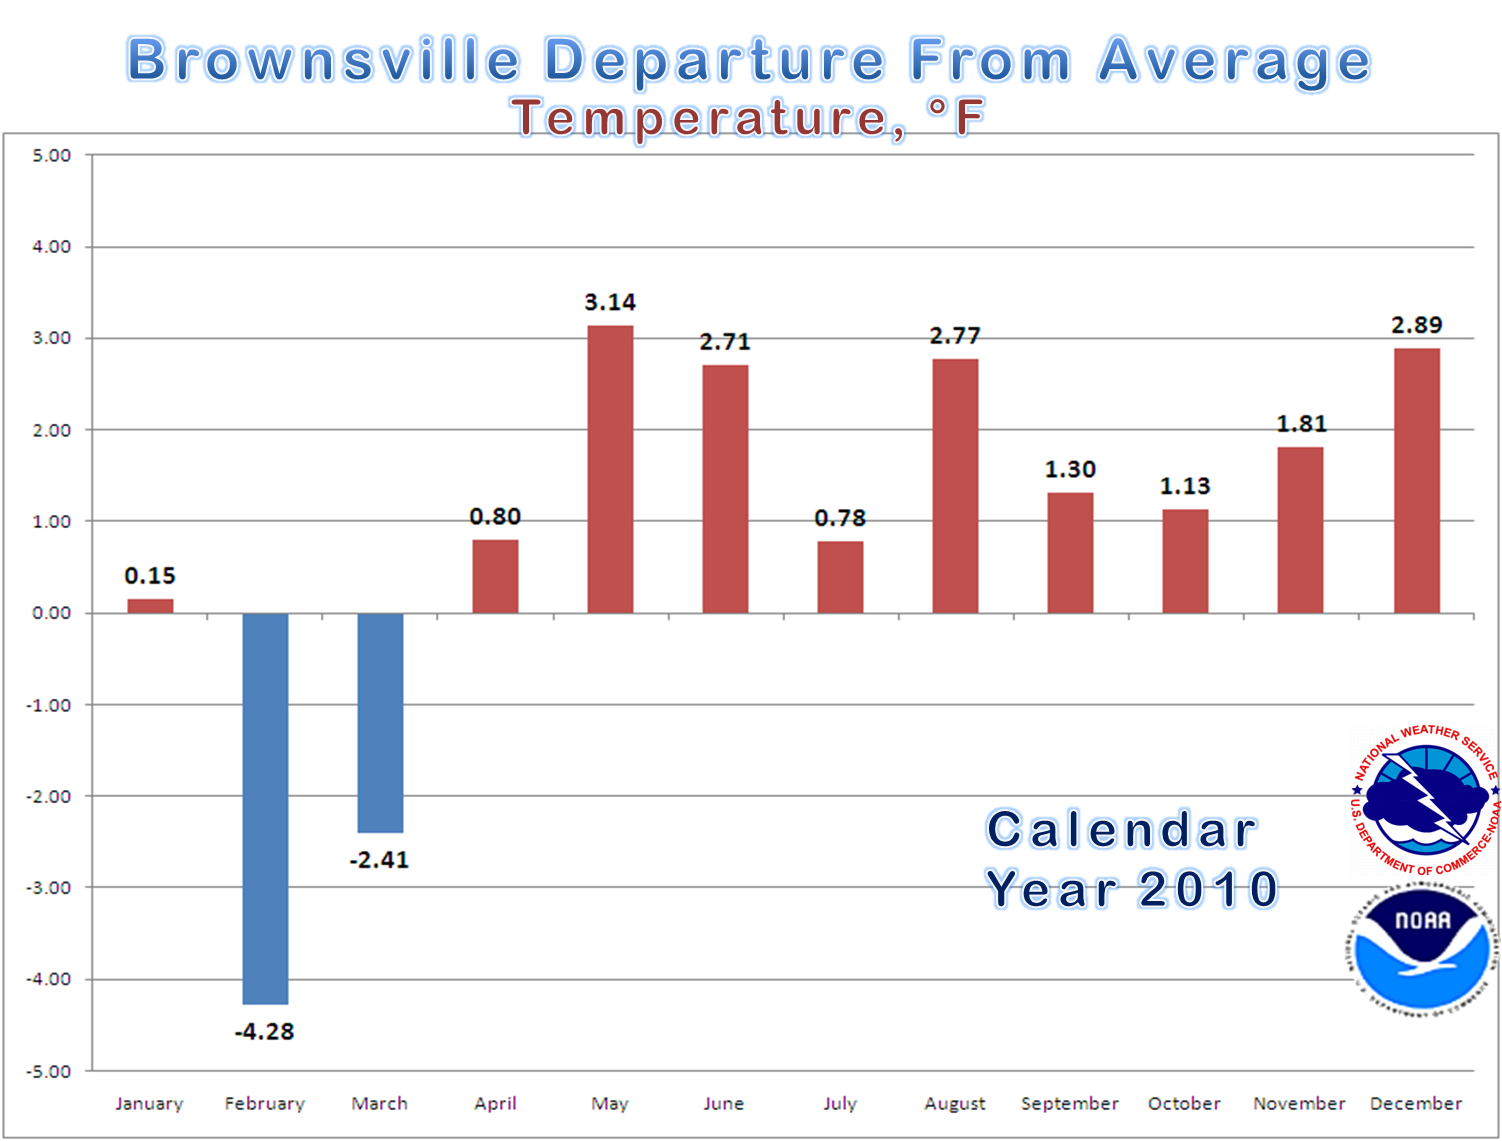
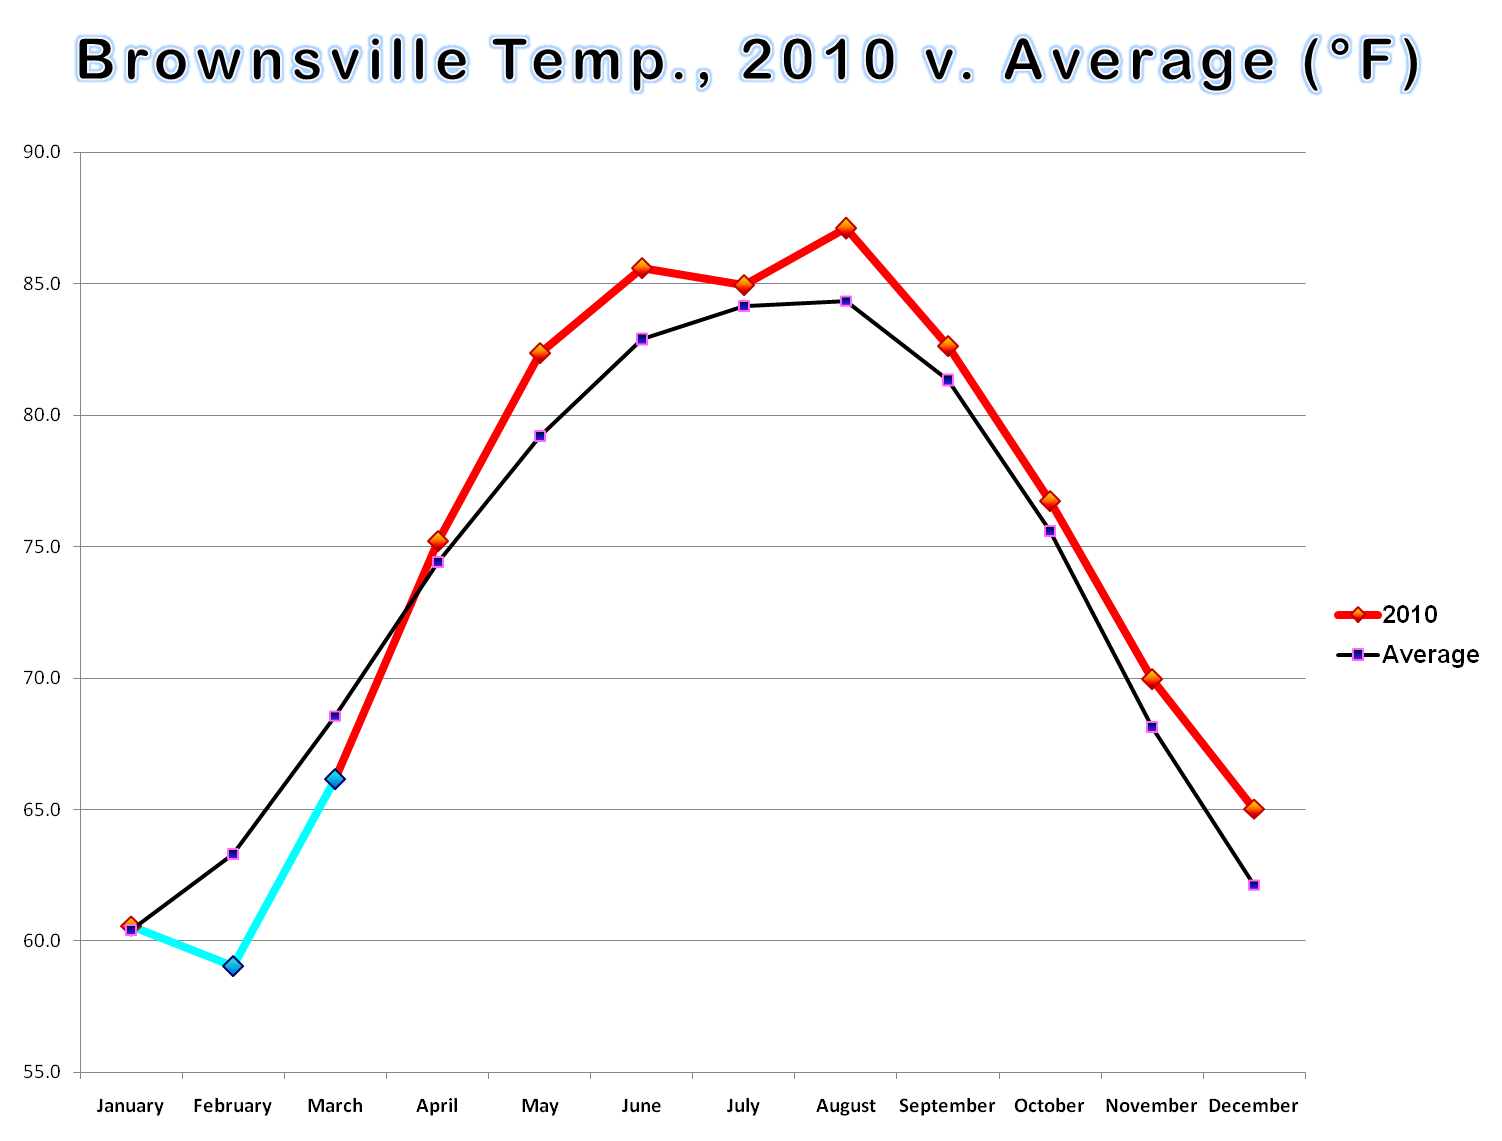
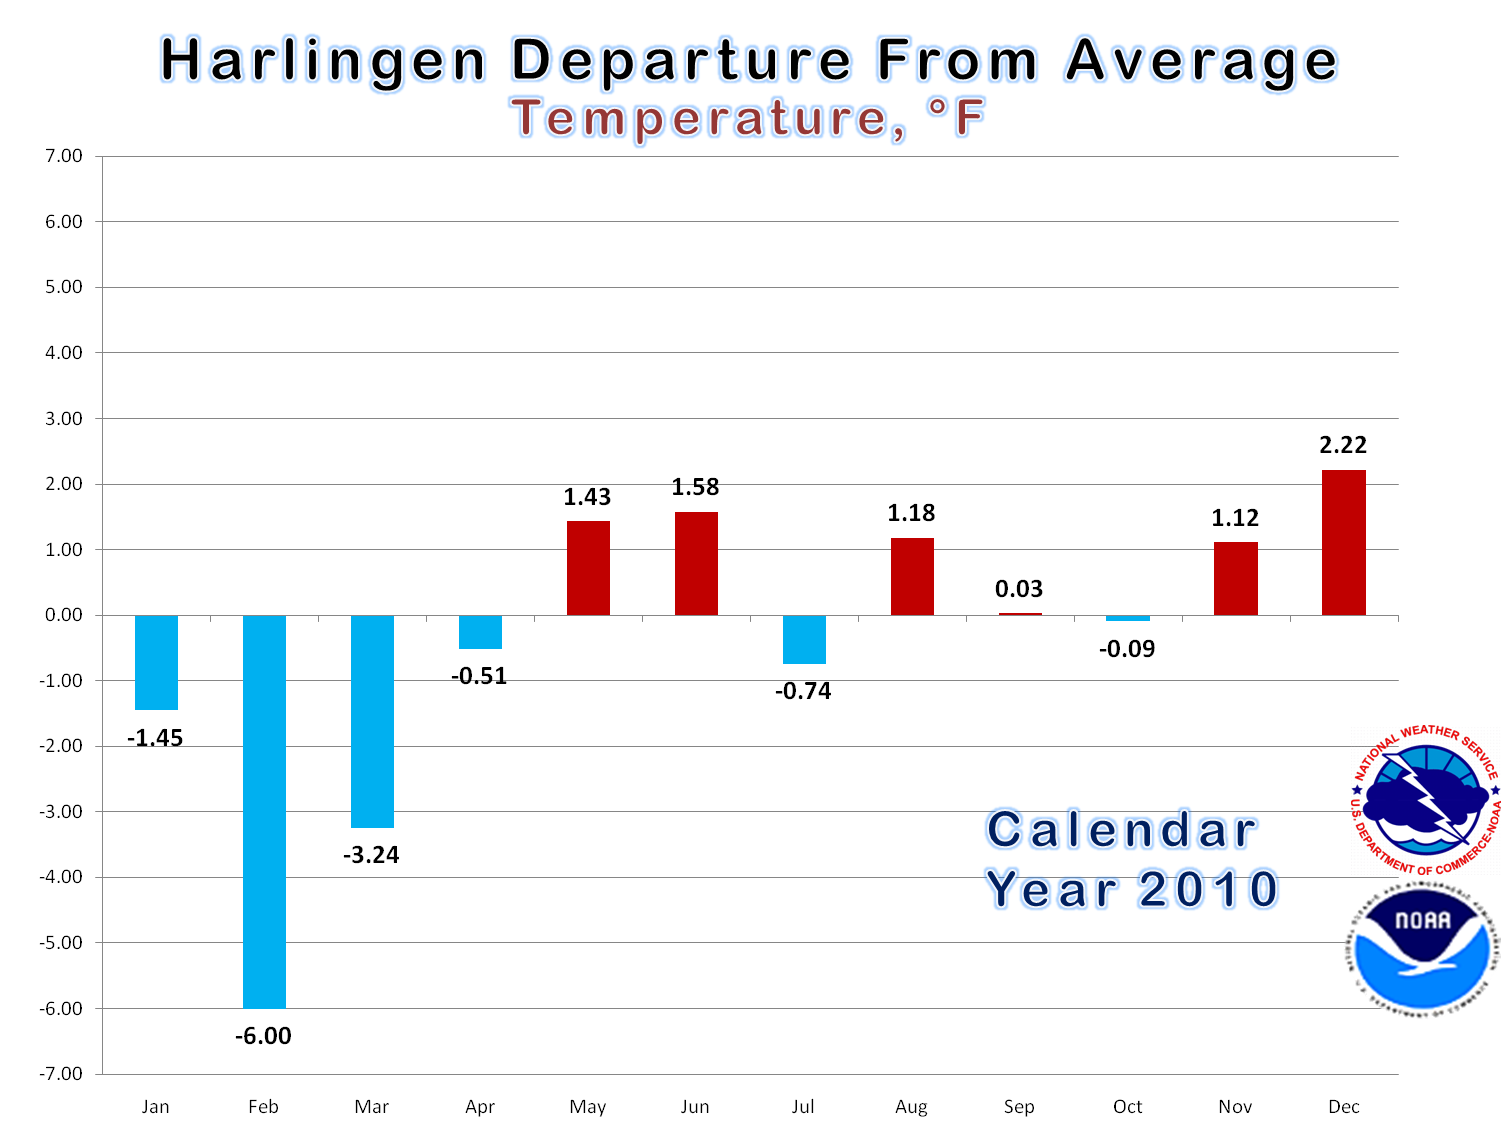
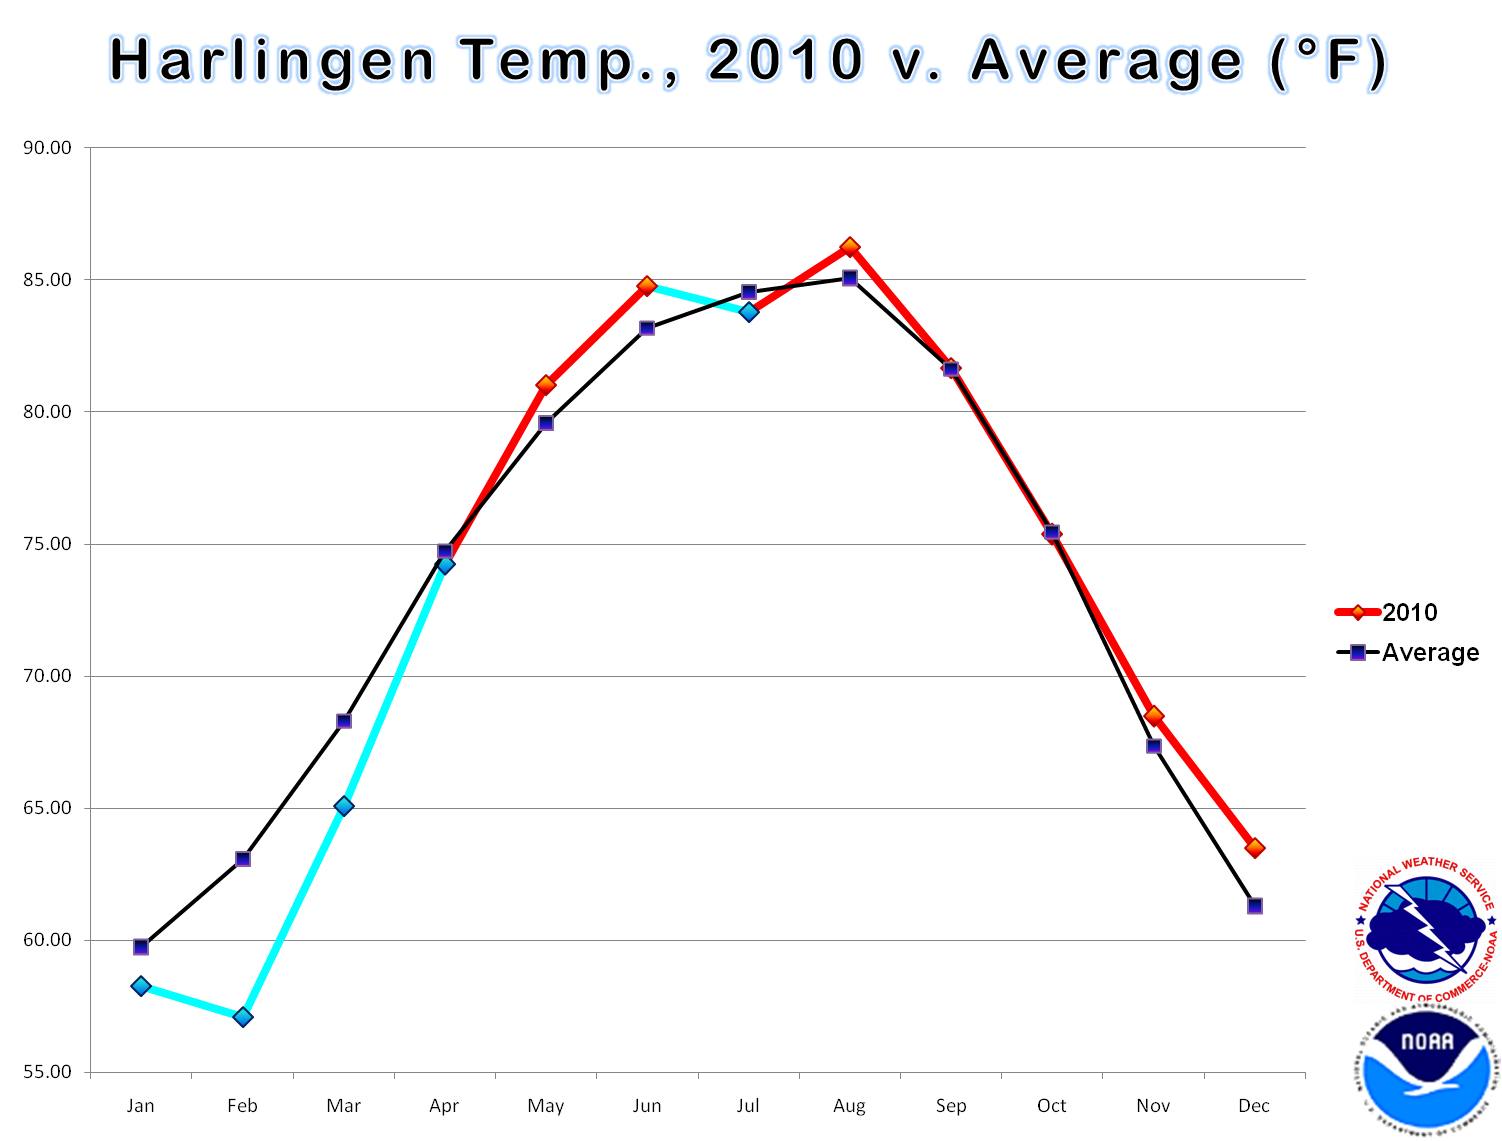
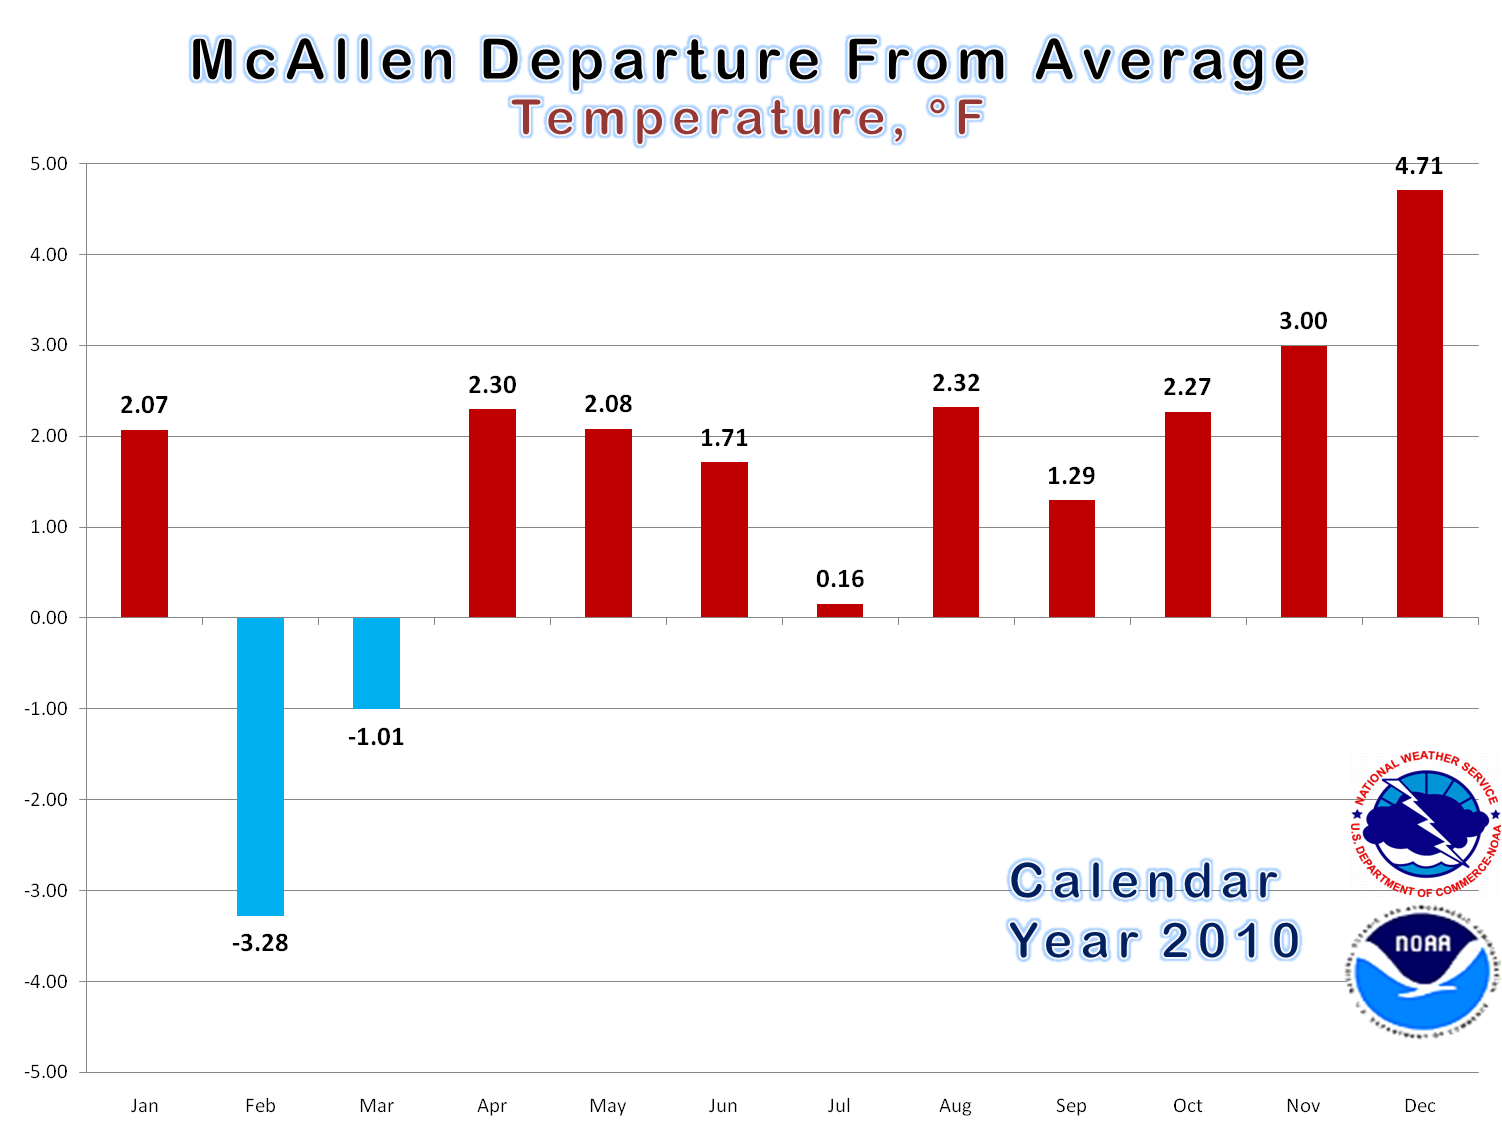
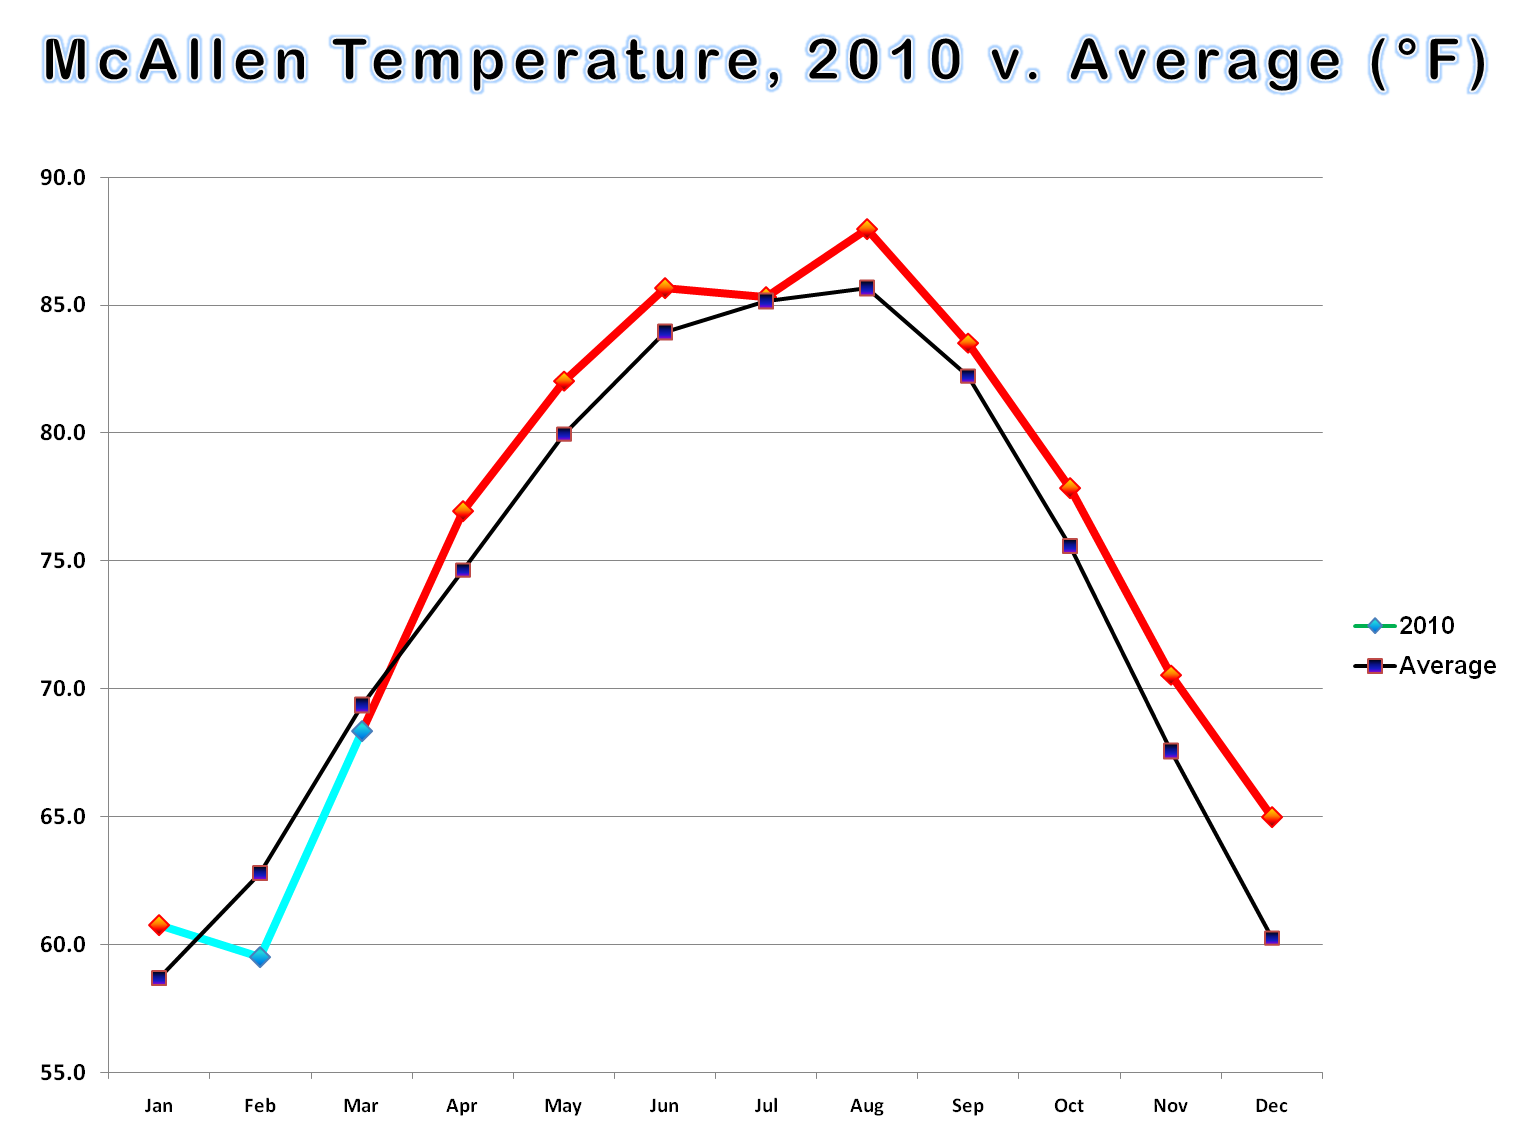
| Temperature Trends Brownsville, Harlingen, McAllen, in 2010 The following charts depict the general trend of 2010, which began with a moderate El Niño leading to generally above average precipitation, particularly in February, and extensive cloud cover and cooling fronts to maintain below average temperatures through winter and early spring. A return to above average temperatures arrived by mid spring, continuing through the rest of the year but punctuated briefly in July when residual ground moisture associated with Hurricane Alex and Tropical Depression Number 2 may have contributed to near to slightly below average temperatures. The rapid development of La Niña in late summer and autumn turned the spigot off at the end of September; despite frequent cooling fronts, abundant sunshine and drying ground helped boost temperatures to well above average on many days in November and December. |
|
 |
 |
 |
 |
 |
 |
| Back To Page 1 | Back To Page 2 |
CURRENT HAZARDS
Daily Briefing (National)
Outlooks
Severe Weather Text
Local Storm Report
Submit a Storm Report
CURRENT CONDITIONS
Surface Observations (map)
Text Observations
Satellite
Rivers and Lakes
Observed Precip - RGV
Tides and Currents
CoCoRaHS Texas
FORECASTS
Forecaster's Discussion
Graphical
Hourly View
Activity Planner
Marine
South Padre Tides
Wave Prediction
Beach
Surf
Fire Weather
Aviation
Tropical
Winter Storm Severity Index
Model Guidance
US Dept of Commerce
National Oceanic and Atmospheric Administration
National Weather Service
Brownsville/Rio Grande Valley, TX
20 S. Vermillion Avenue
Brownsville, TX 78521
956-504-1432 (8 AM to 430 PM Mon-Fri)
Comments? Questions? Please Contact Us.

