Drought, Out! 2015 Brings Green and Flooding to Valley Year in Review: Wet Was the Word; Cool Start, Warm Finish Dry, Hot Summer Gives Way to October Floods, Warm Fall and Early Winter |
|
 |
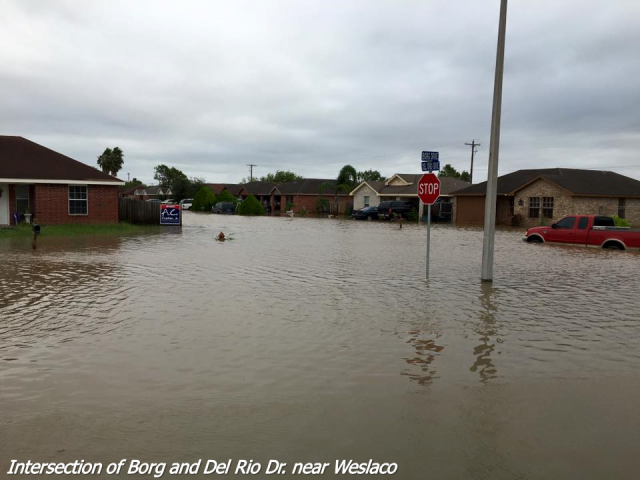 |
| Above: Flooding in late October, 2015, was the capping event of a year remembered for water across the Rio Grande Valley. From "Lake Willacy" (left) to widespread neighborhood flooding in Weslaco, not seen in decades, impacts were sufficient to warrant Federal Disaster Assistance to Cameron, Hidalgo, and Willacy County. | |
| July to September: "La Canícula’s" Hot, Dry Summer Broken by Late August Storms | |
|
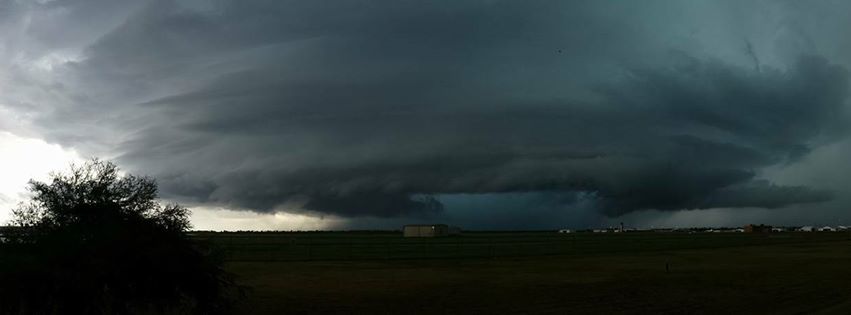
For a third summer in a row, July was largely uneventful as the upper level high pressure ridge, commonly referred to as La Canícula took control. Opening Day thunderstorm rains up to 2 inches signaled the last of the wetness for awhile; by mid month, after top soils were sufficiently dried by the searing summer sun, a long string of century-mark (100°F) afternoon temperatures dominated the mid and upper Valley; McAllen/Miller airport would soar to 2.4°F above the 1981-2010 average by month’s end. August began the way July ended, with La Canícula in full swing and no sign of the associated upper level high pressure ridge eroding, century mark temperatures dominated most areas west of U.S. 77 for the first two–thirds of the month. The "flip" from a wet spring to a hot, dry summer is a common thread in strengthening El Niño’s, as enhanced upper ridging across the southwest U.S. and northern Mexico meshes with increased westerly wind shear from the southern Gulf through the Caribbean, each stopping deep moisture flow in its tracks. Though hot and dry would be the memory of July/August 2015, there were exceptions that occurred in the last quarter (August 17 to 31) of the period. A breakdown in La Canícula in mid August brought enough instability in the form of cold air well above the earth’s surface to create a small clusters of thunderstorms from the King Ranch through the Lower Valley. Boundaries from these triggered a single potent storm that produced a microburst with winds up to 65 mph that affected the west side of Harlingen during the late afternoon of August 17th. A much larger scale event fired up ahead of an upper level disturbance, in very unstable air, from Starr County through the heart of the Valley (McAllen/Mission through Weslaco) from just before midnight on the 20th through the morning. Explosive thunderstorms with excessive lightning and torrential rains dropped 4 to 7 inches in less than six hours, with widespread minor flooding with pockets of life–threatening flooding in the McAllen metro, more than 30,000 residents without power and considerable damage to five homes due to lightning strikes, and cotton loss in fields with full boll. For many, the rains replaced a monthly deficit with a surplus. The full story is here. For Brownsville, August saved its biggest action for the 31st, when a high precipitation supercell flooded the west side of the city with more than six inches of rain in a less than three hours. The Brownsville office was briefly situated just north of the updraft core, with a beautiful cloud display. September was relatively uneventful when considering the monthly rainfall is by far the highest – two to three times in some cases – of any month in the calendar year. September’s climatological rainfall "spike" is from a combination of deep tropical moisture flow around the Bermuda/southwest Atlantic Ocean high (which peaks in September) and any tropical wave or cyclone that rides the flow around this ridge into the western Gulf. With wind shear closing the door on the Caribbean/Gulf season through September, and La Canícula returning to the mix after a brief respite in late August, most areas were drier than the 4.5 to 6 inch average. That said, there were a few thunderstorm and locally heavy rain producing events sprinkled throughout the month, particularly in the Lower and mid Valley; these events kept drought/dry conditions away. For the Upper Valley and Ranchlands, however, the lack of rainfall brought moderate drought conditions back to portions of Jim Hogg and Zapata County by start of October. |
|
| October to December: Flooding Rains Crush October Rain Records; Warm/ Humid Weather Closes Year | |
|
October would be remembered for years to come, as wary predictions of heavy rainfall and flooding based on the analog El Niño and Pacific Decadal Oscillation from October 1997, which produced more than 10 inches of rain across much of the Lower Rio Grande Valley through the King Ranch, became an eerily similary reality again in 2015. The month began innocently enough, with a continuation of the hot and generally rain-free weather, along with a continuation of abnormally dry/moderate drought conditions across the Rio Grande Plains/Upper Valley Ranchlands and even a brief introduction of abnormally dry conditions in eastern Cameron County by October 20th. Not all was fair; a weak upper level disturbance and dissipating front combined with near record heat across the mid/upper Valley and ranchlands to produce clusters of thunderstorms that produced a microburst in the La Joya/Alton area, as well as locally heavy rainfall across the ranchlands, on October 13th. Unfortunately, the pattern that brought the dry weather maintained a onshore or "downshore" flow on water and wave action, which elevated or maintained Karenis Brevis ("Red Tide") algal blooms on South Padre Island and produced frequent periods of wave run-up and some tidal overwash. The bloom, which began in earnest the final full week of September, would continue into late October and be the longest duration event in four years. Beach erosion was also a factor with the frequent wave run-up. The pattern change arrived around the 20th, as a broad upper level ridge developed across the eastern third of the U.S. with a trough in the southwestern U.S. In between, southerly flow at all levels tapped the very warm waters of the eastern tropical Pacific, as well as the southwestern Gulf. The first event, a thunderstorm system that developed in place from Rio Hondo to eastern Willacy County, dropped an estimated 6 to 10 inches and created "lakes" on fallow cropland in Willacy and northern Cameron. The memorable event arrived less than two days later, courtesy of a piece of the southwestern trough which linked up with the rapidly moving remains of record-setting Hurricane Patricia. From Weslaco to Willacy, hundreds of homes and large swaths of land were inundated with several feet of water. For Willacy, an additional 4 to 6 inches piled onto the earlier waterlogged soils, building further temporary "lakes" (above photo, left). For Weslaco, an measured and estimated rainfall of 10 to 14 inches in four to six hours flooded more than 500 homes and likely left tens of millions in property damage behind. Check out the full story on one of the biggest floods in the mid Valley since Hurricane Beulah. And that was not all. Though the piece of upper level energy that captured Patricia’s remains brought the season’s first notable cool down (daytime temperatures into the 70s), the broader pattern had not changed and the southerly to southwesterly flow of deep tropical moisture resumed later that week. On October 30th, another spurt of upper level energy created the necessary lift to produce another round of torrential rains and flooding, which focused on Brownsville in the form of another thunderstorm system and dropped the highest rainfall total in more than five years on Brownsville’s east side, including the airport. For some locations along and just east of U.S. 77/IH 69C in Brownsville, the combined rainfall from the August 31st event was more than ten inches. On the same day, another four to six inches fell in north central Willacy County, adding insult to injury and worsening flooding, particularly in San Perlita, where one to three feet of water inundated the town. Those rains came with a pair of mini–supercell storms right around daybreak, each which produced short lived EF0 tornadoes in Los Coyotes and Willamar (east of Lyford and Raymondville) which caused damage to barns, a cotton holding tank, mobile home, and other outbuildings – as well as one injury to a teenage boy. About the only thing October’s deluges did not do was break long standing monthly rainfall records at cooperative locations with long observation periods. Still, nearly all sites from Weslaco to Brownsville finished among the top five wettest of all-time. Click here for a brief summary and associated maps. The close–out to 2015 was much quieter than the month (October) that preceded it. One primary difference between how 2015 ended when compared with the similarly strong El Niño and Pacific Decadal Oscillation of the end of 1997 was with temperatures. November and December were well into the plus side compared with average, best epitomized by the "Green" Christmas week, where temperatures averaged 12 to 17°F above normal, more similar to mid May or early October than late December, and somewhat similar to what happened in mid to late December 2014. November was considerably drier than October, which is to be expected when the deep tropical moisture feed typically cuts off. However, the abundance of remaining warm and still humid air along the Lower Texas/Mexico Gulf coast influenced a coastal trough on November 20th; associated rainfall pushed monthly totals close to their 1 to 1.5 inch normals. Despite a long–awaited chill down to close the year – for a second Holiday season in a row – it was not enough to remove December 2015 from the top ten warmest list across most Valley locations. |
|
| To Page 1 |
|

