Dangerous heat expands across the Desert Southwest, Plains, Mississippi Valley and Midwest. Critical fire weather for portions of the Intermountain West. Risk for severe thunderstorms and flash flooding across the Upper Midwest/Great Lakes, Ohio Valley, and portions of the mid-Atlantic. Active monsoonal moisture fuels thunderstorms over the Southwest. Hurricane Fausto in the Pacific, should weaken Read More >
|
Hello West Michigan Hydro Community! Resources. |
Map of monthly streamflow compared to historical streamflow for the month of the year (Michigan)
|
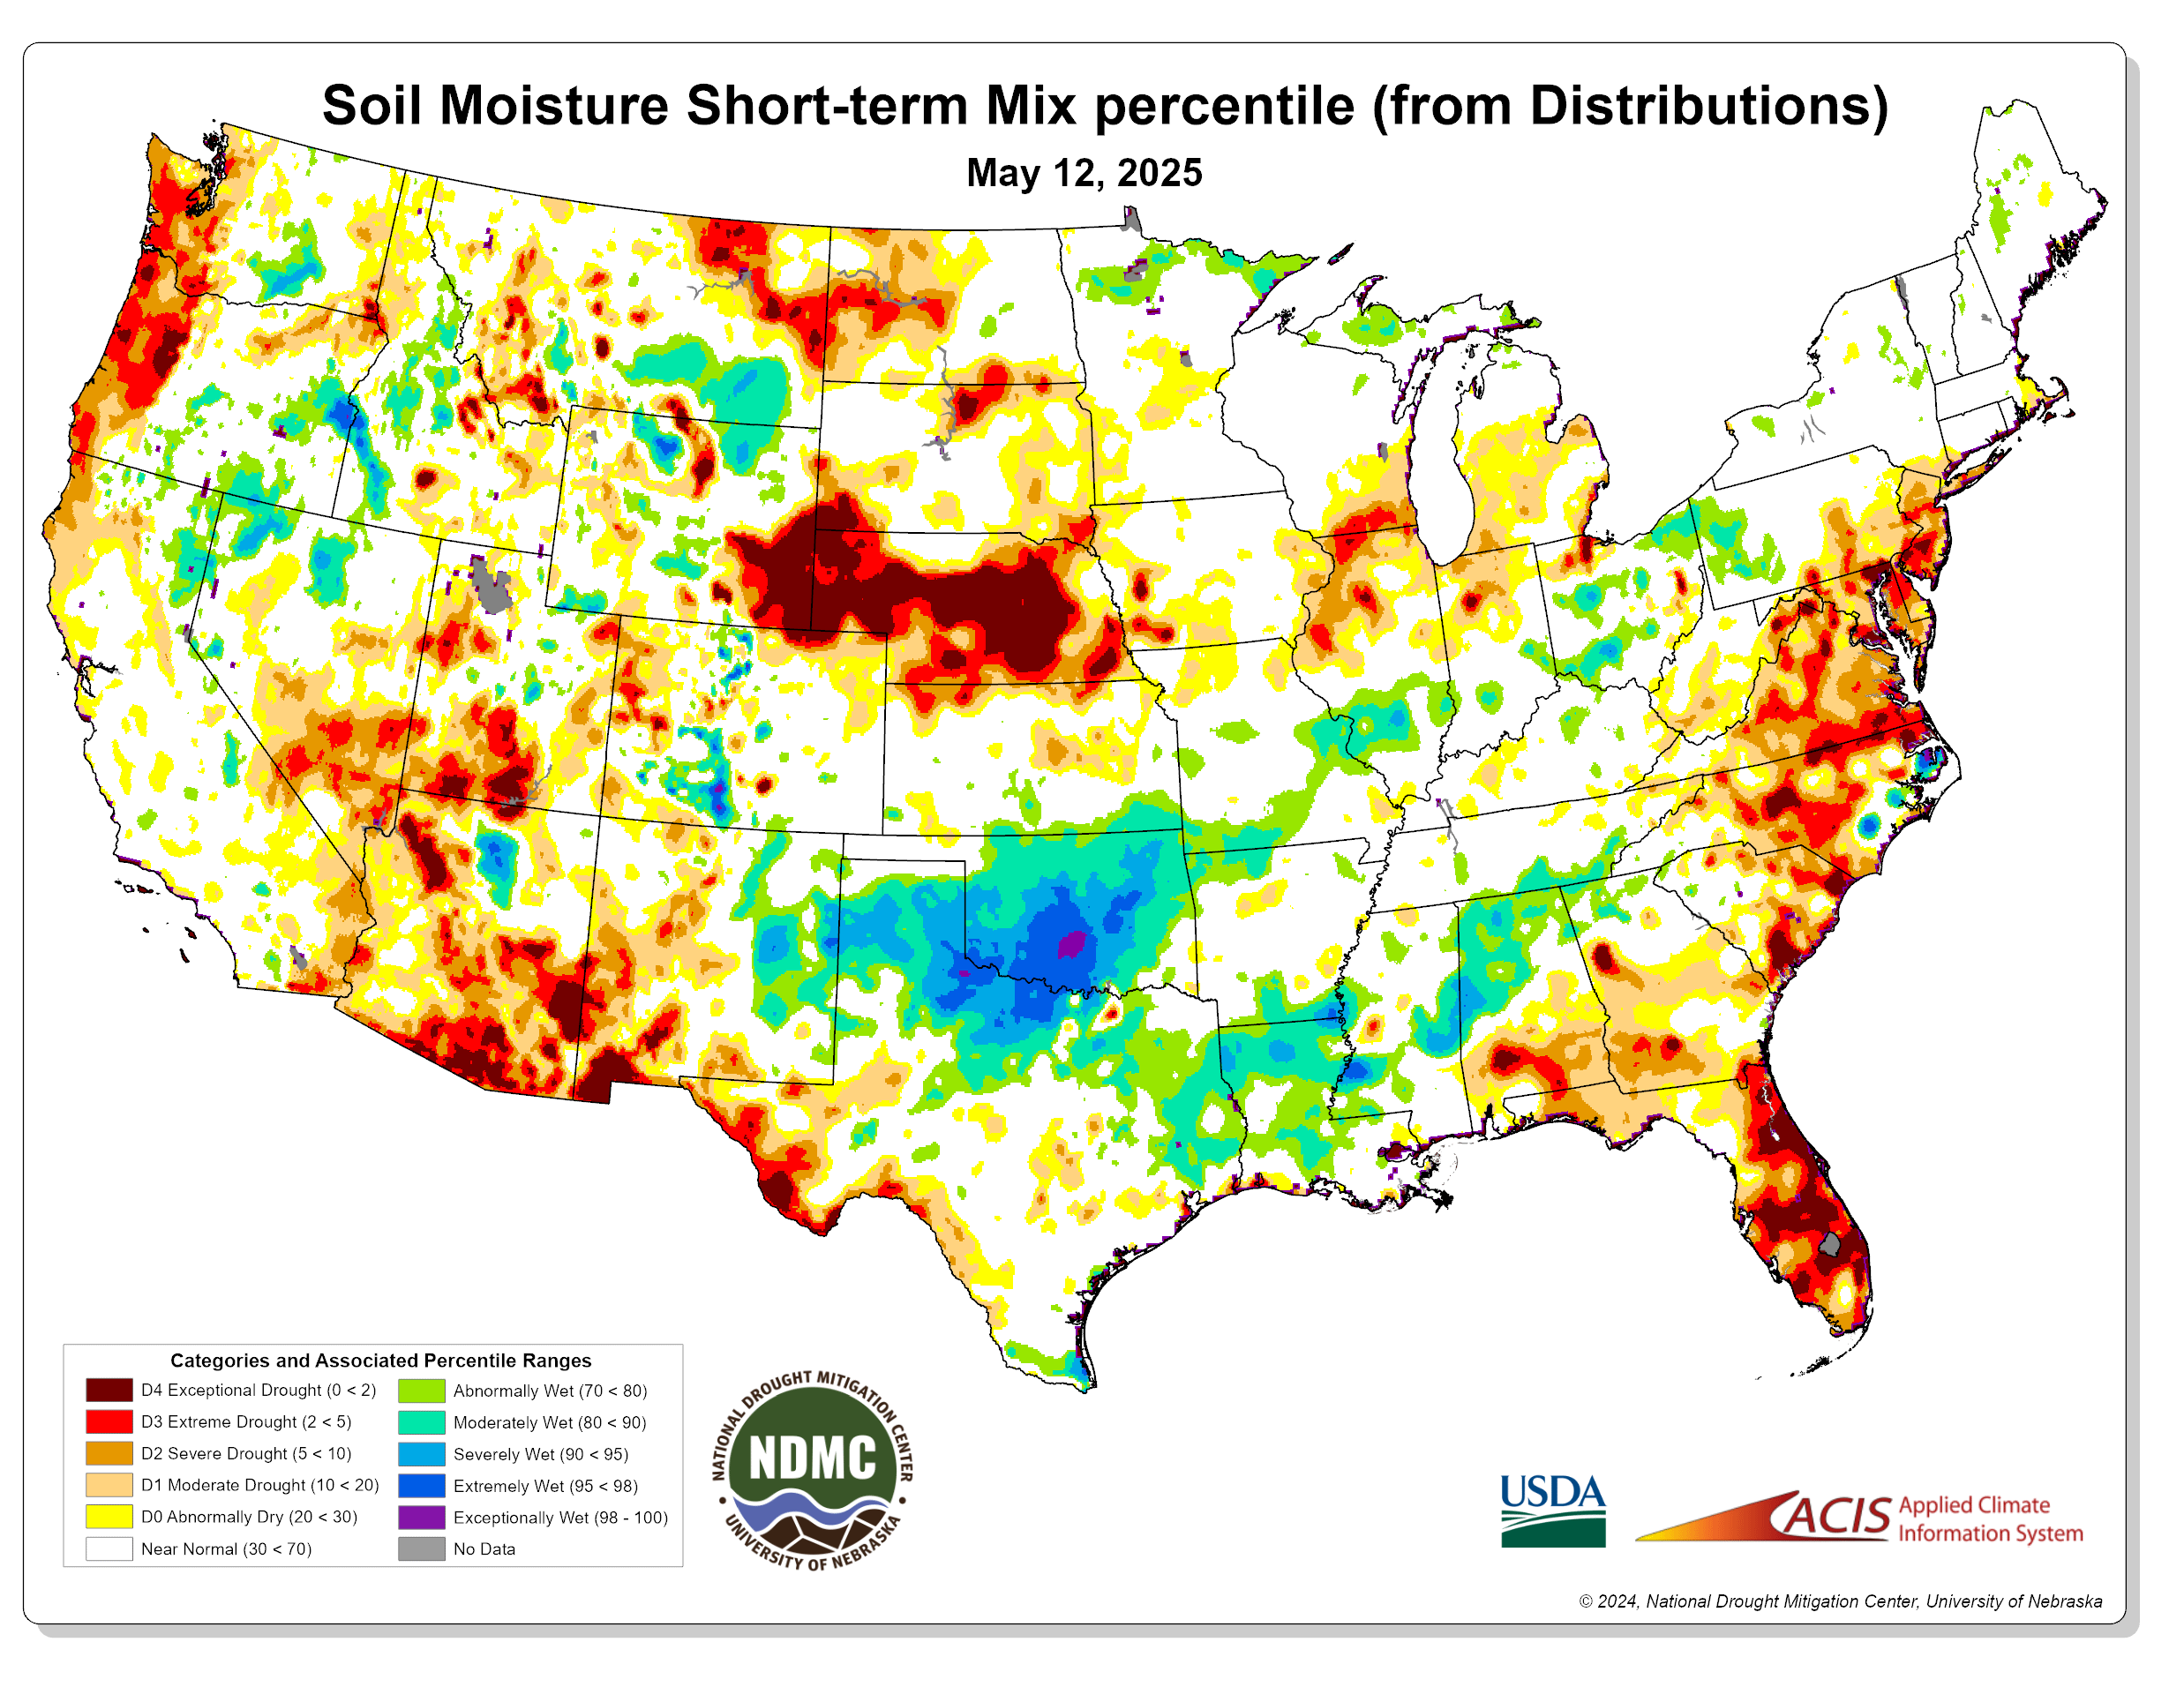
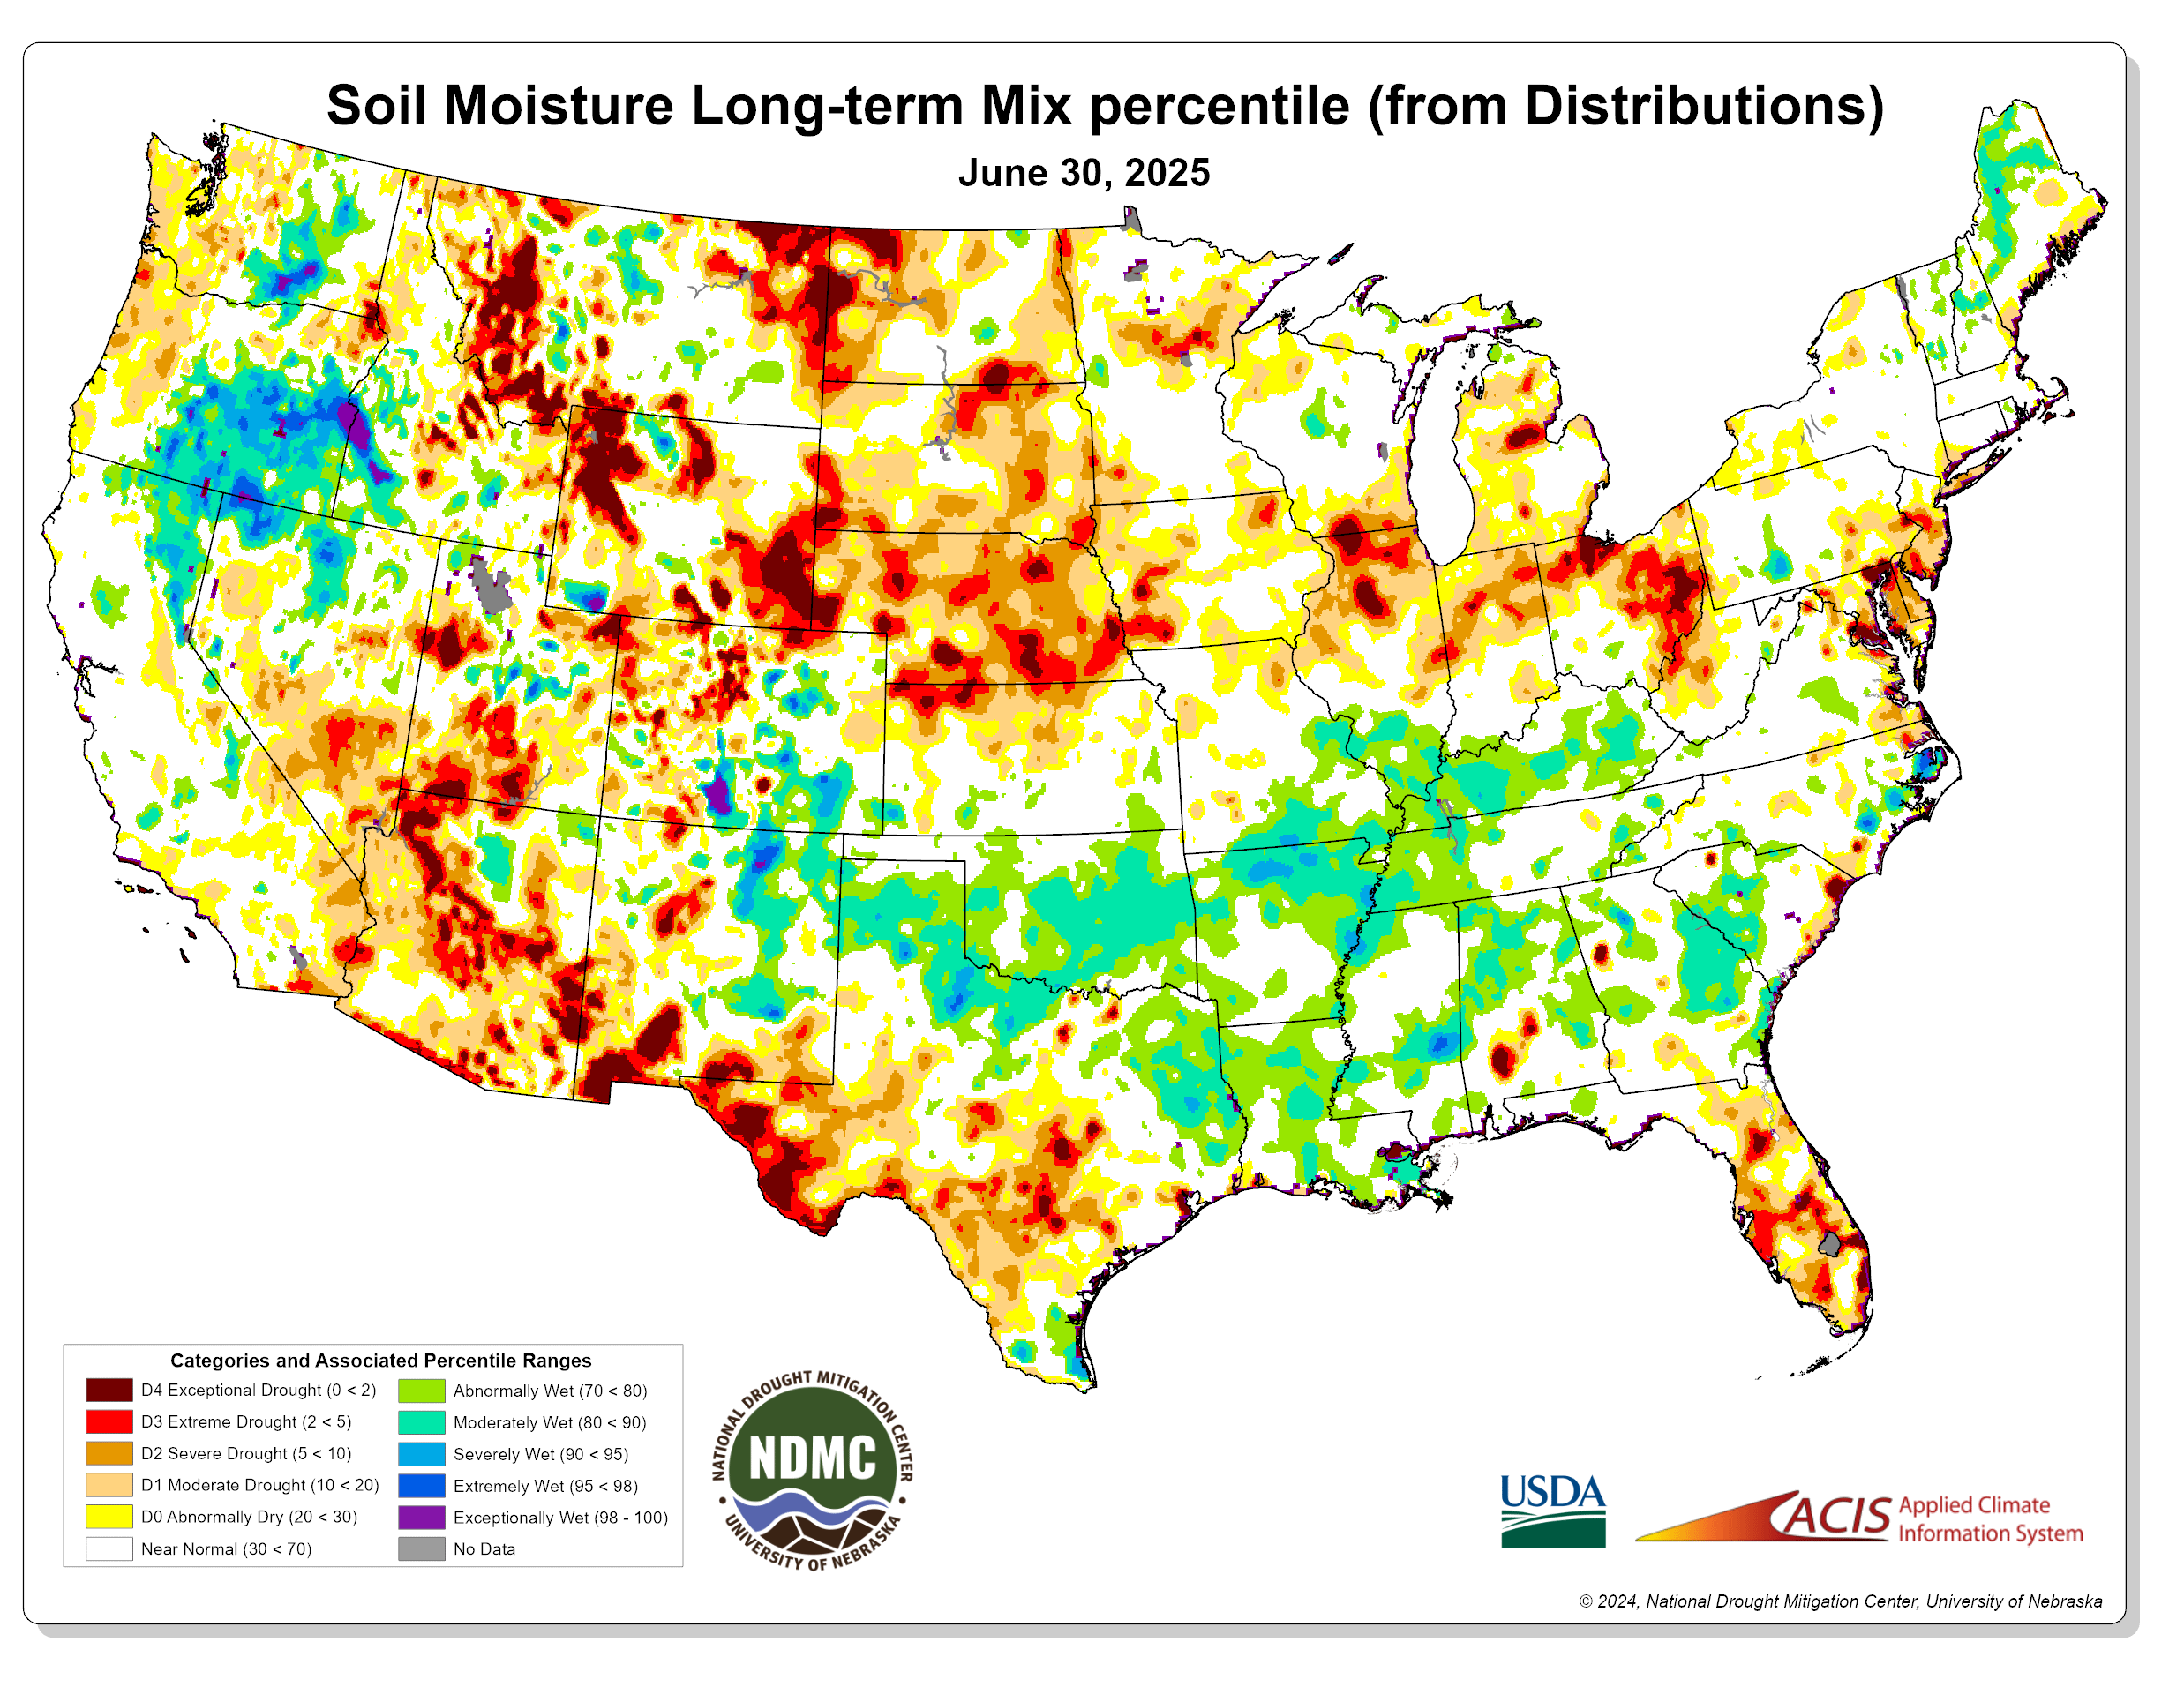
Calculated Soil Moisture
| Calculated Soil Moisture Ranking Percentile | Calculated Soil Moisture Anomaly |
 |
|
|
|
|
| Calculated Monthly Soil Moisture (mm) | Calculated Soil Moisture Anomaly Monthly Change |
 |
 |
Resources
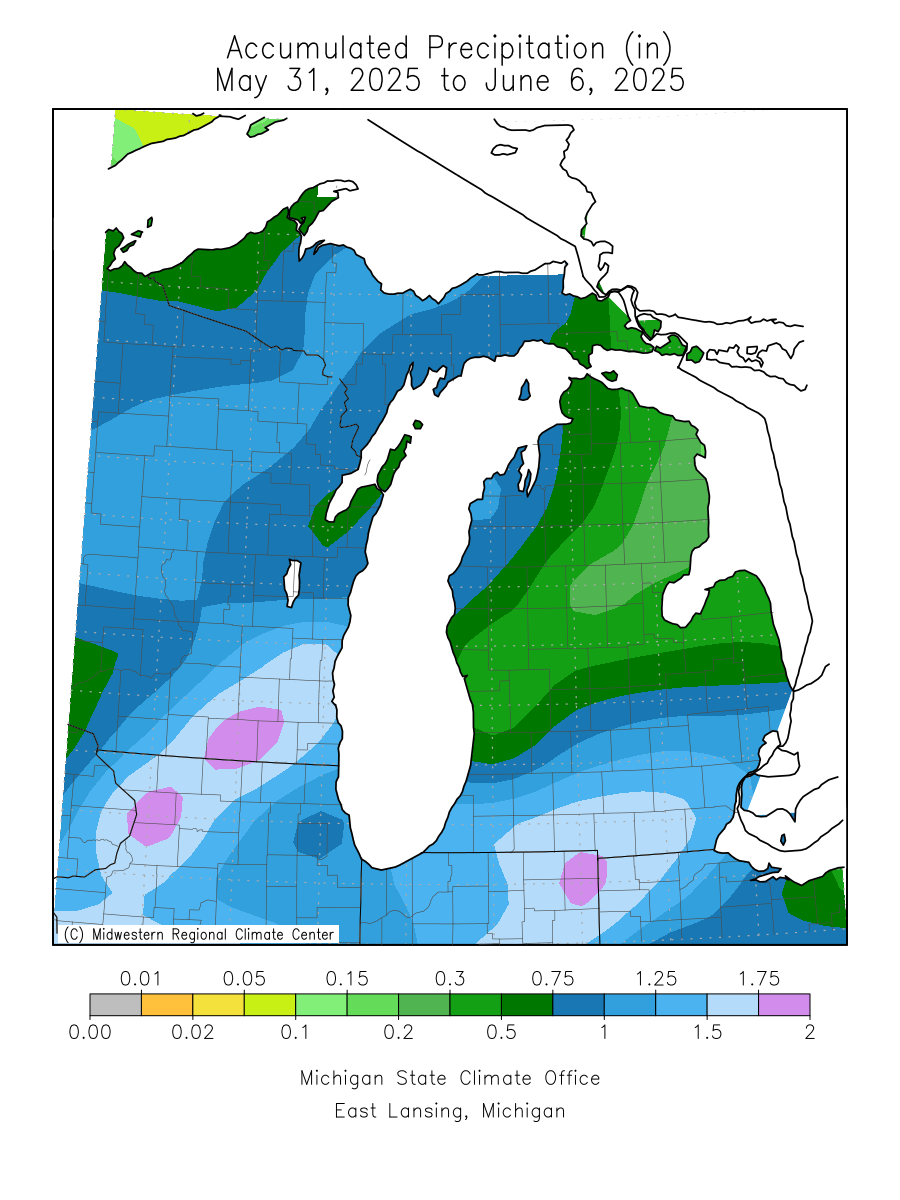
Latest Precipitation and Temperature Trends
| Total Precipitation | ||
| Past 7 Days | Past 30 Days | Past 90 Days |
 |
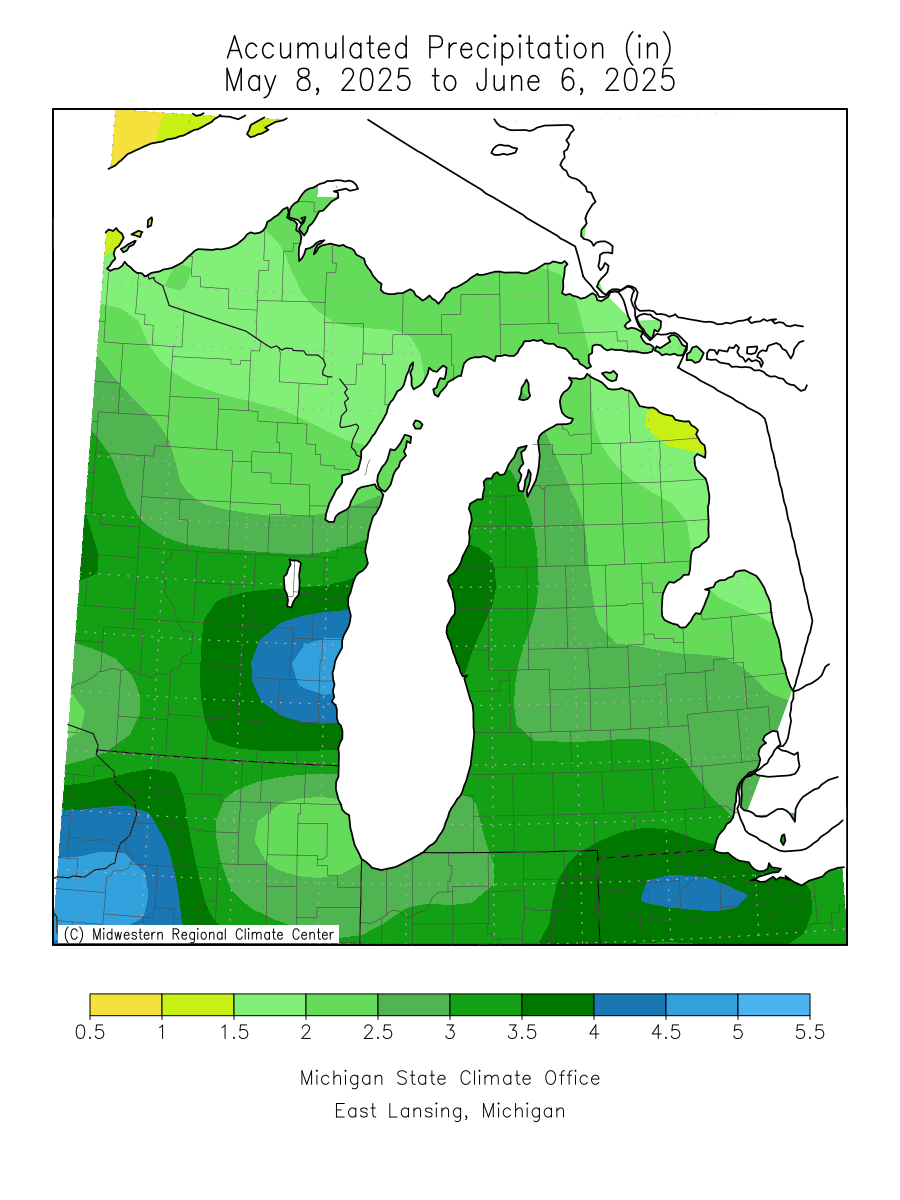 |
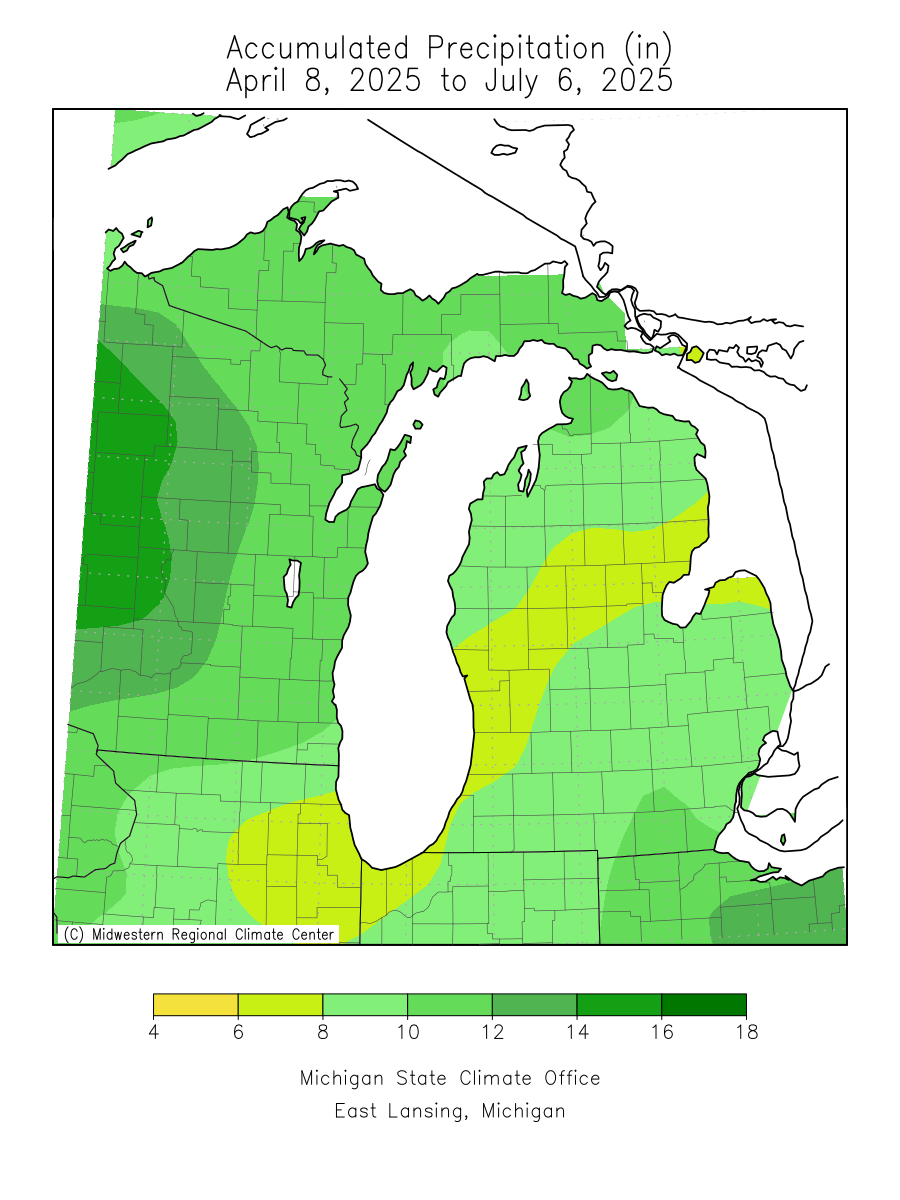 |
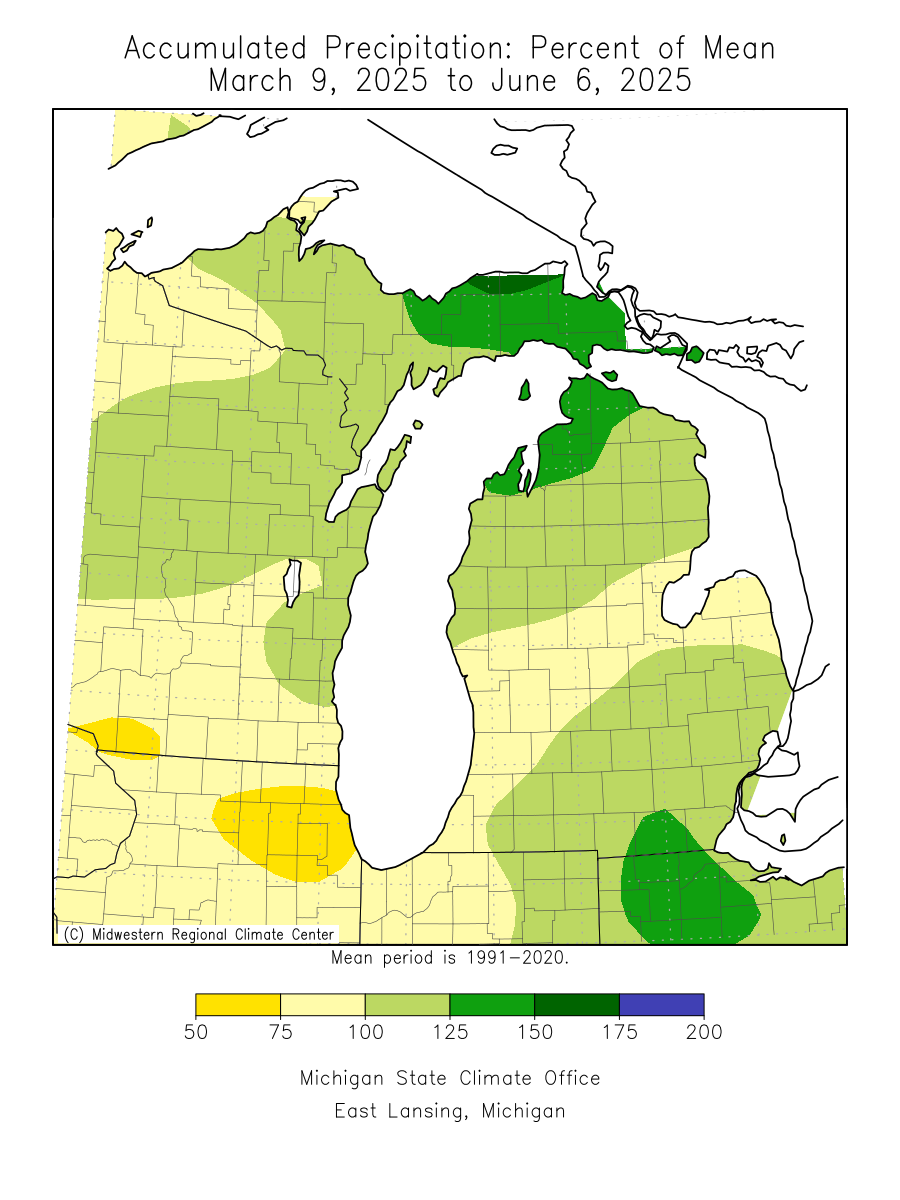
| Precipitation Percent of Mean | ||
| Past 7 Days | Past 30 Days | Past 90 Days |
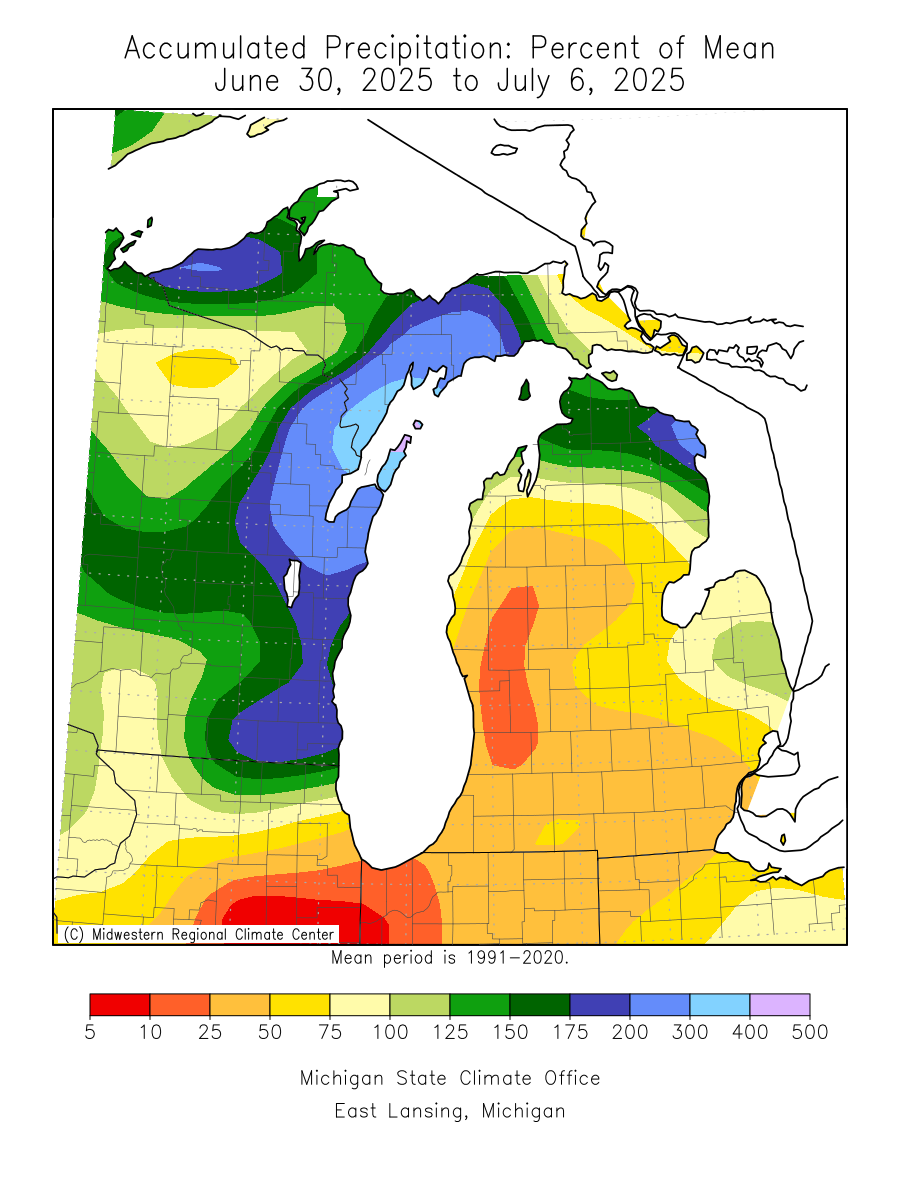 |
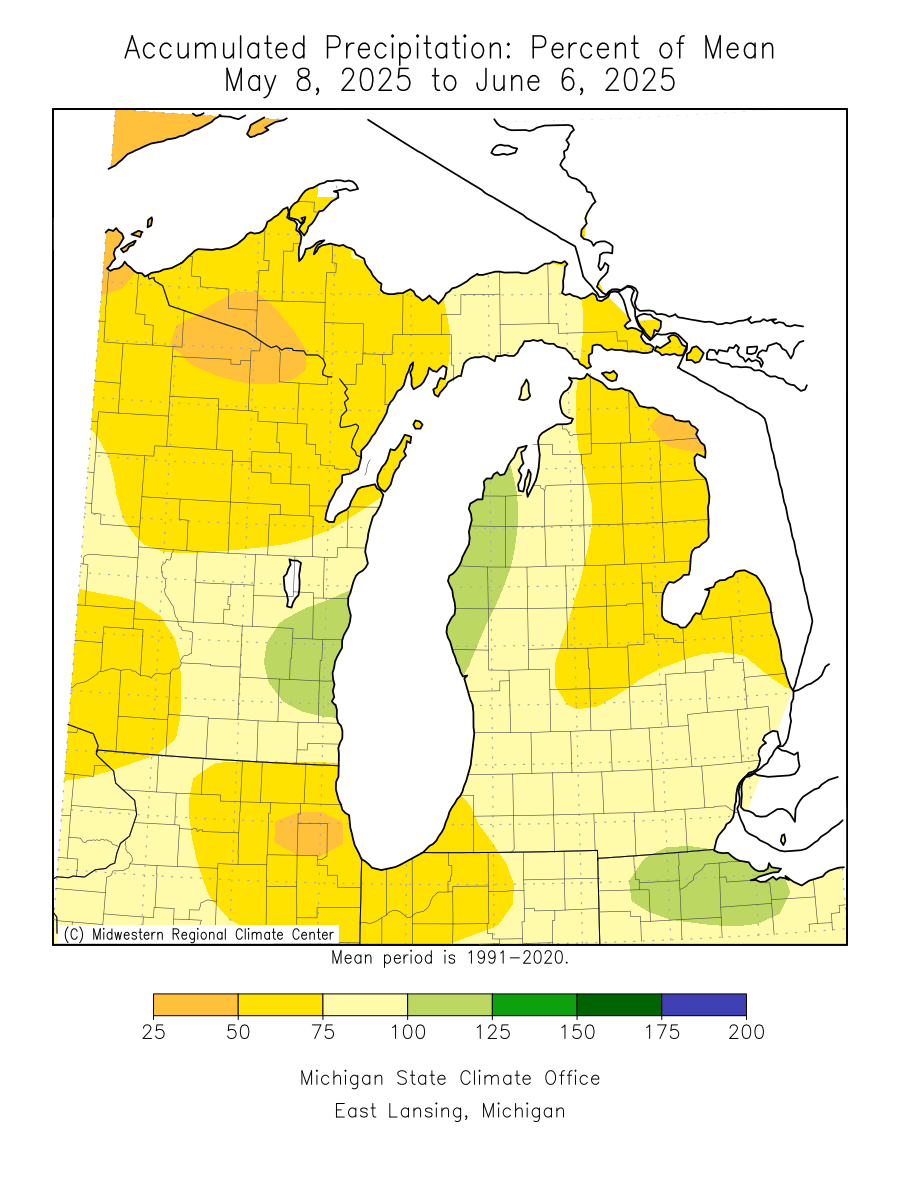 |
 |
|
|
||
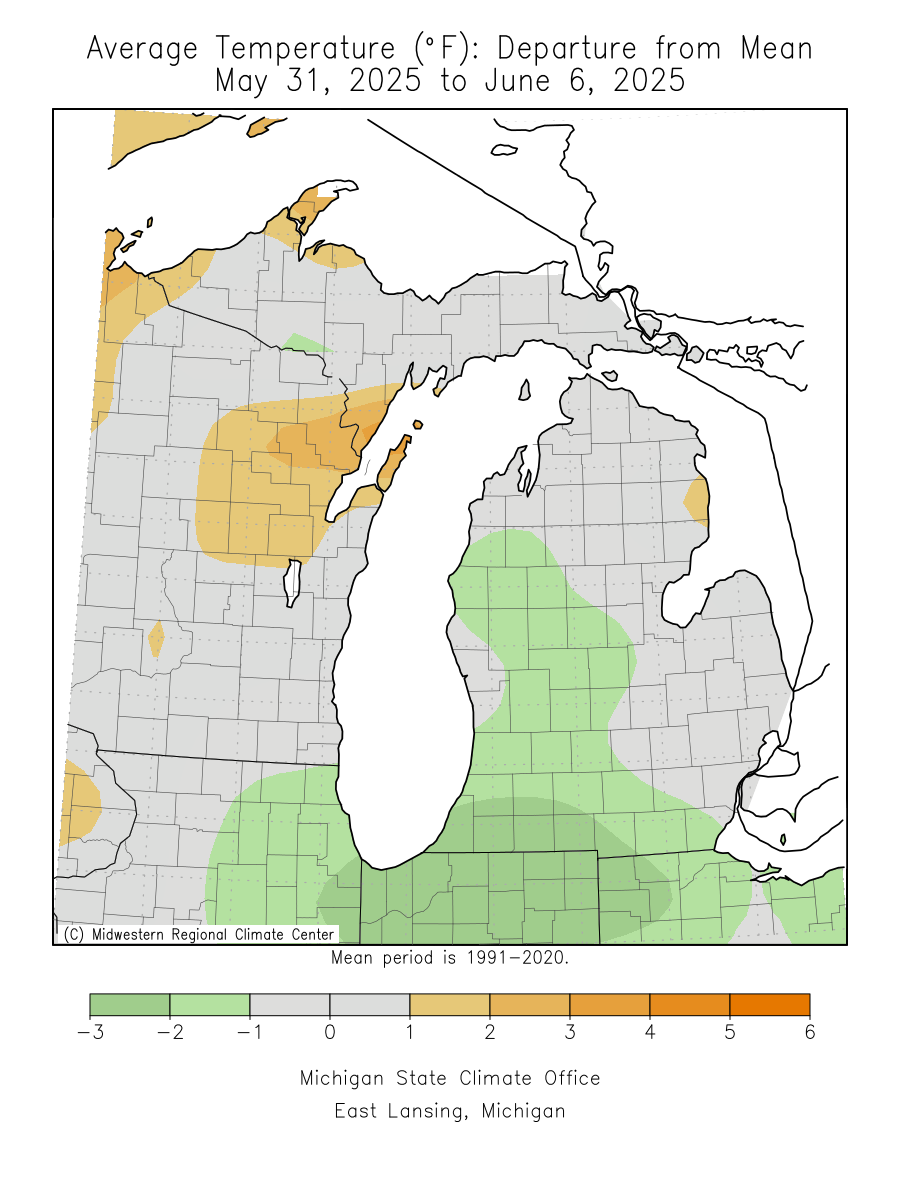
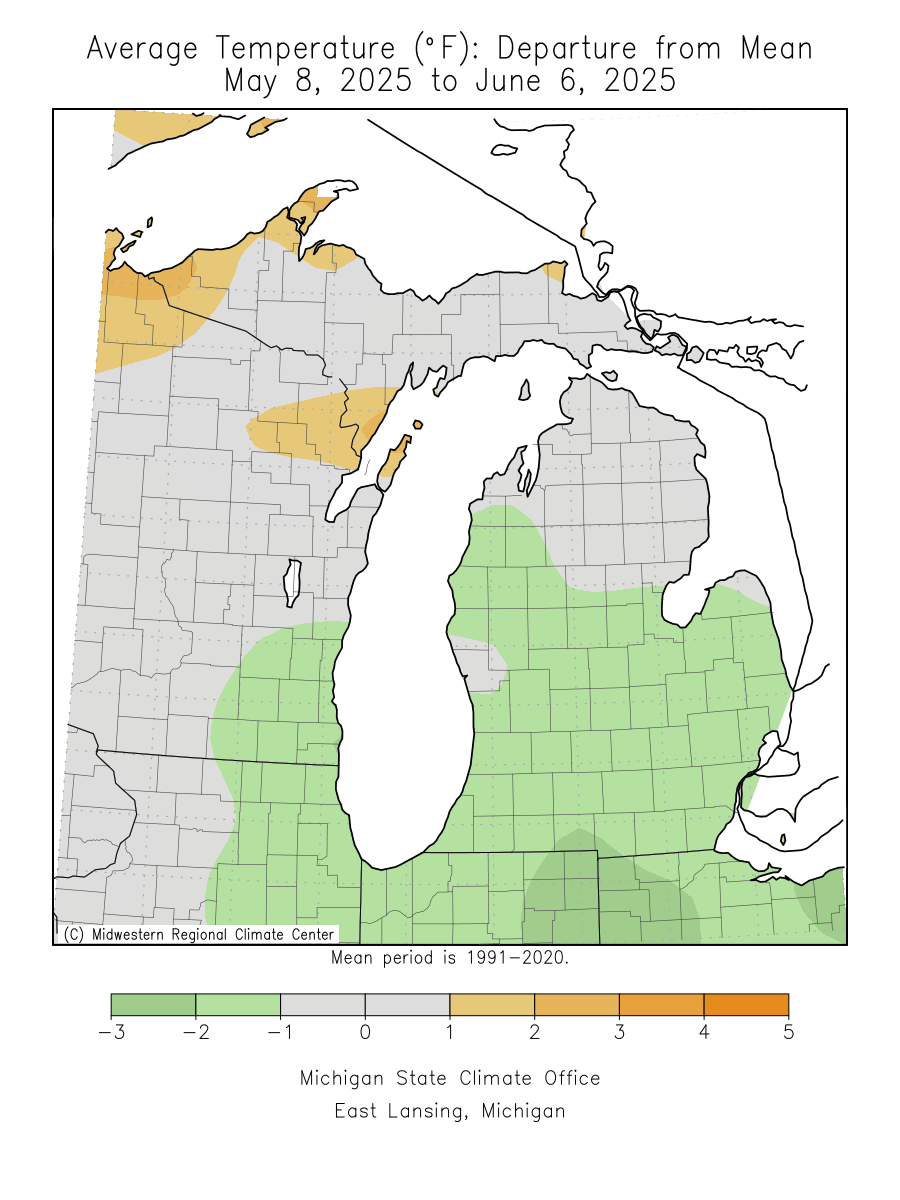
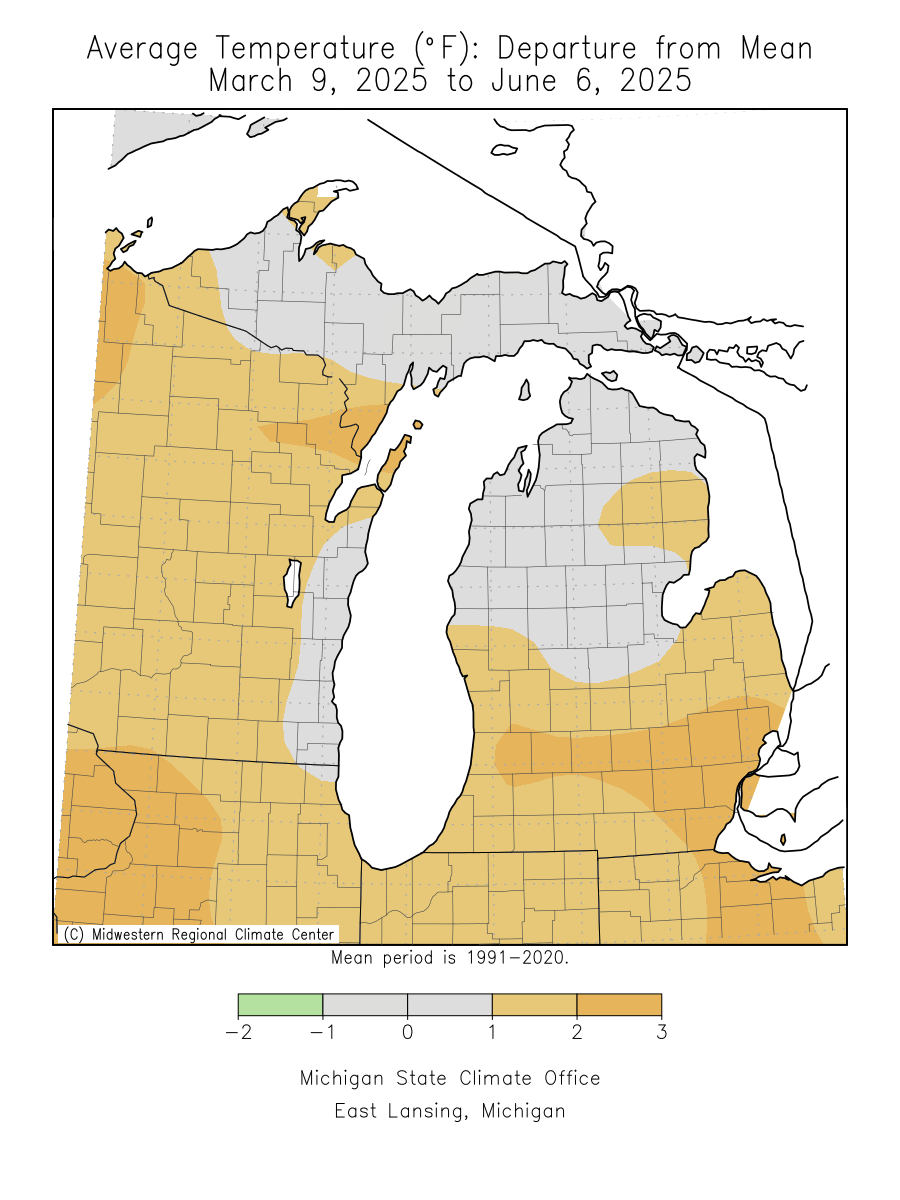
| Temperature Departure from Mean | ||
| 7 Day | 30 Day | 90 Day |
 |
 |
 |
|
|
||
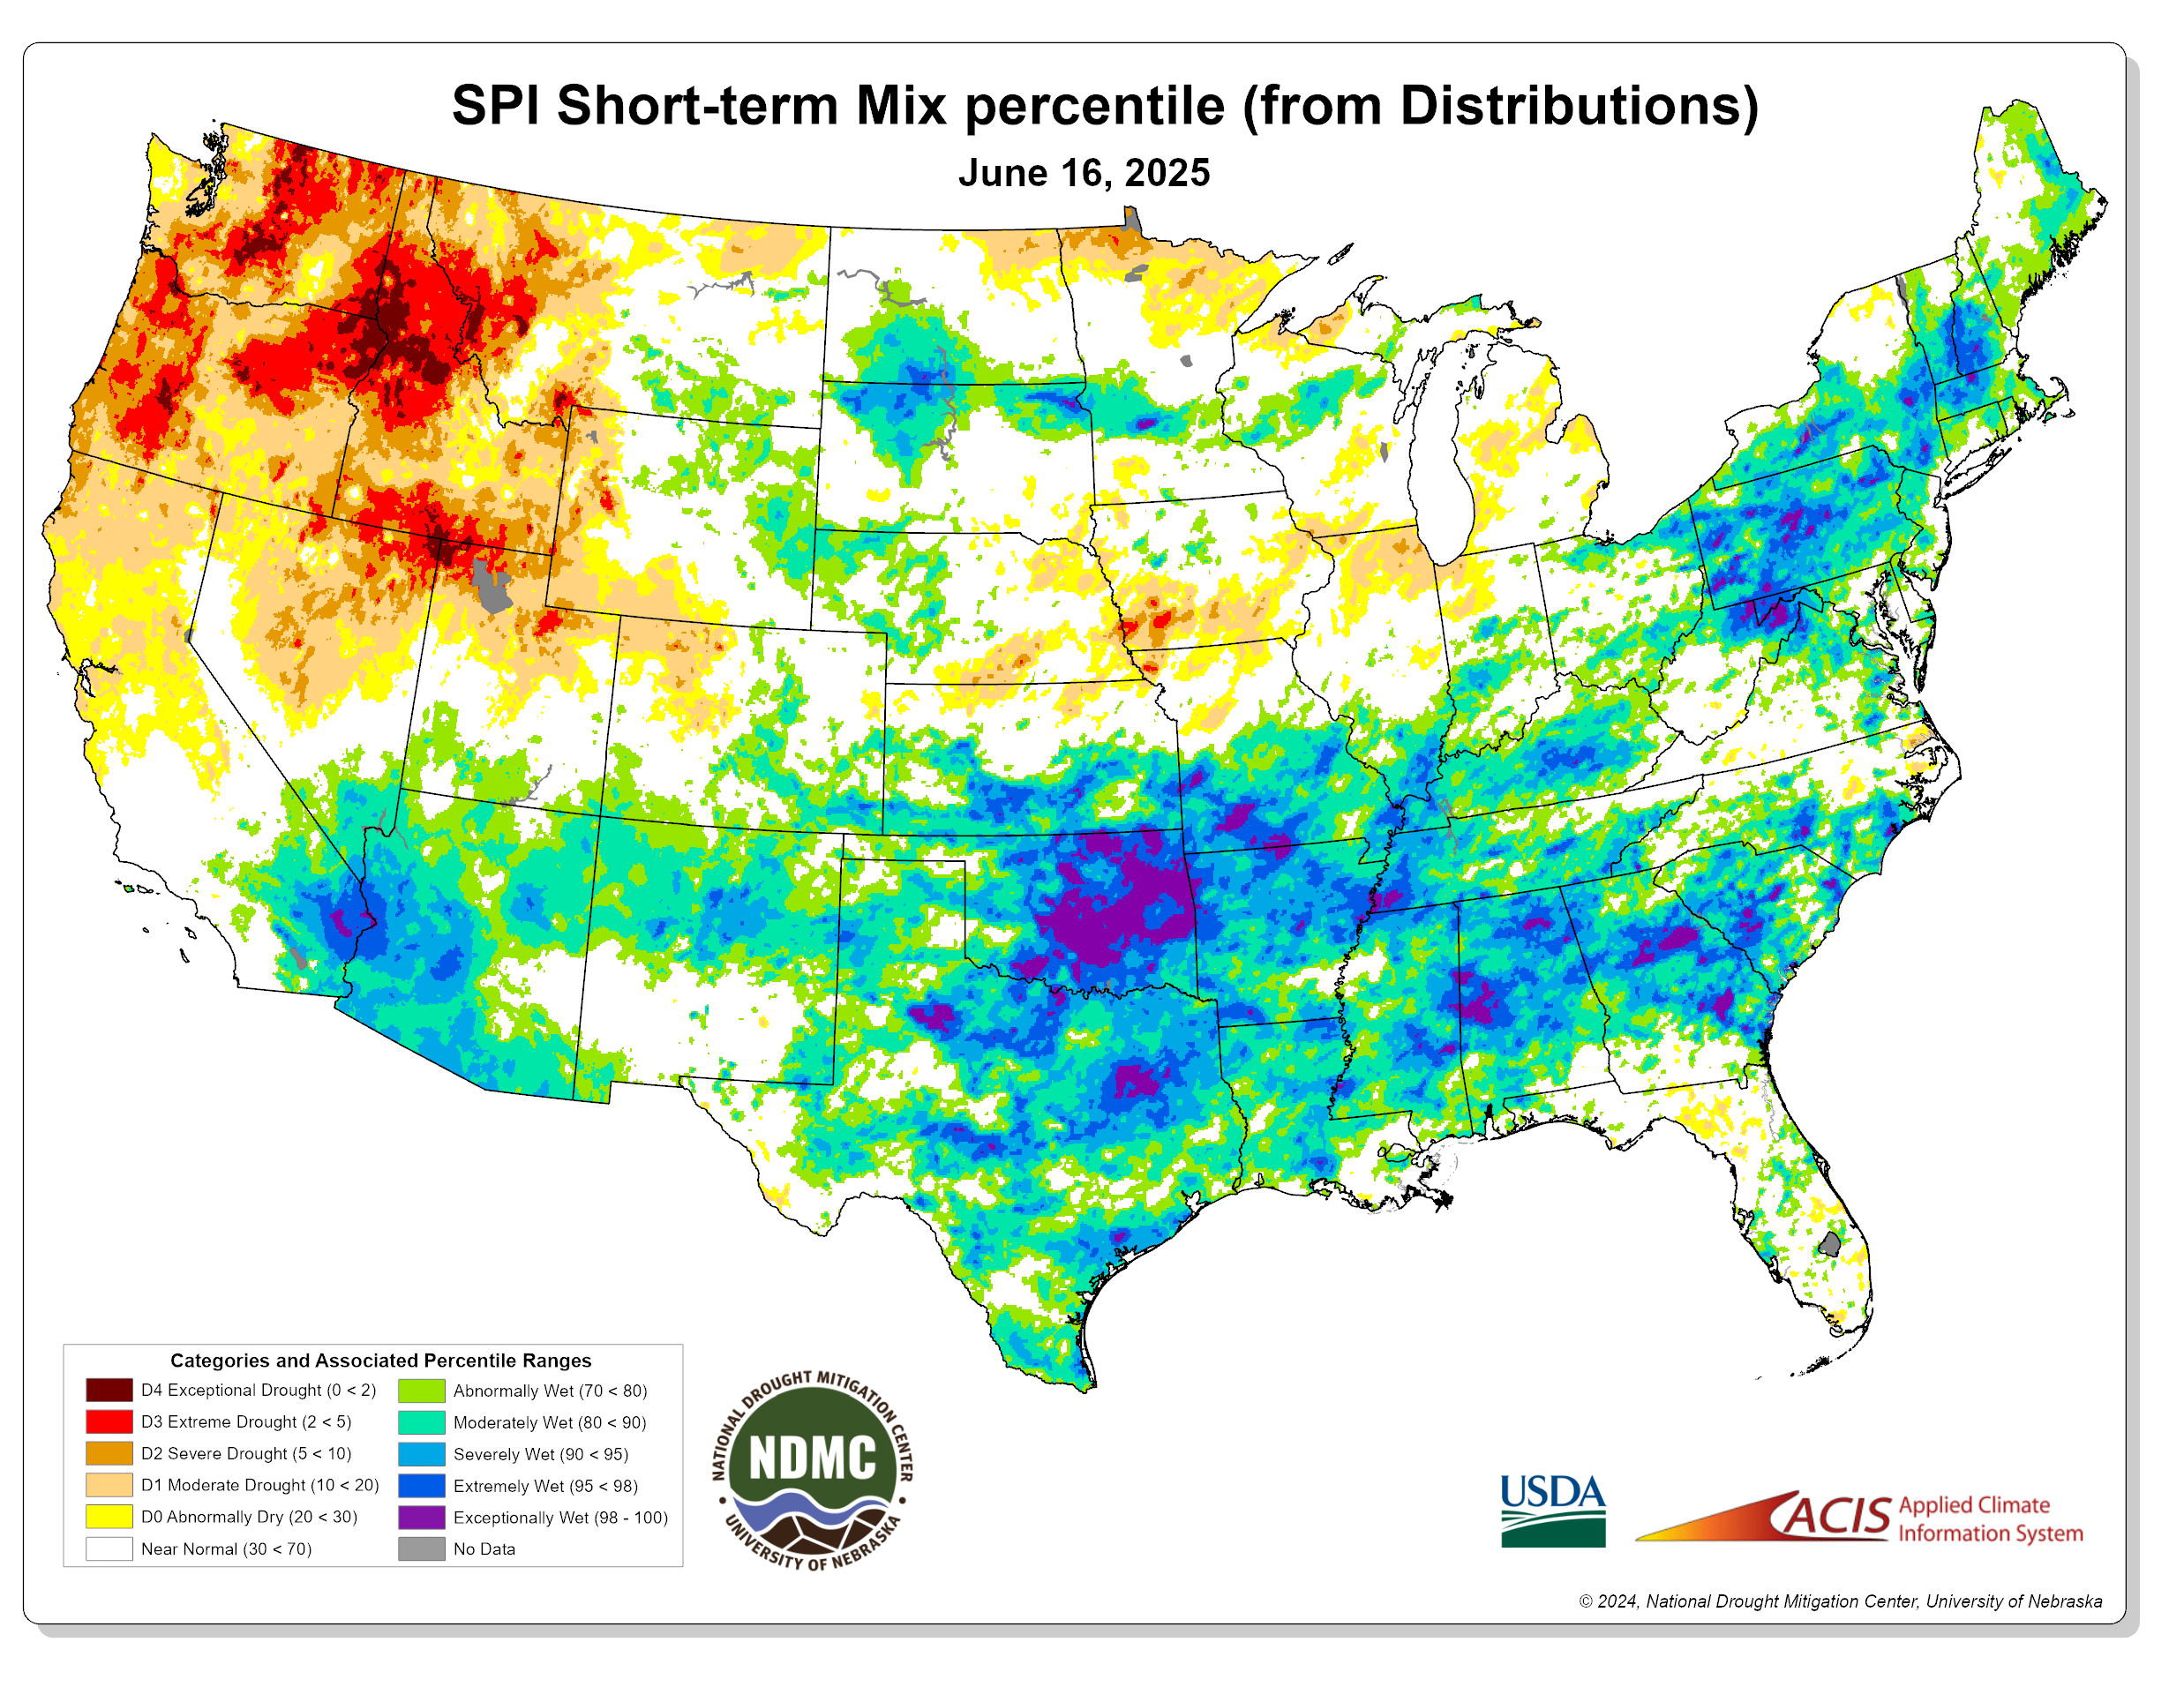
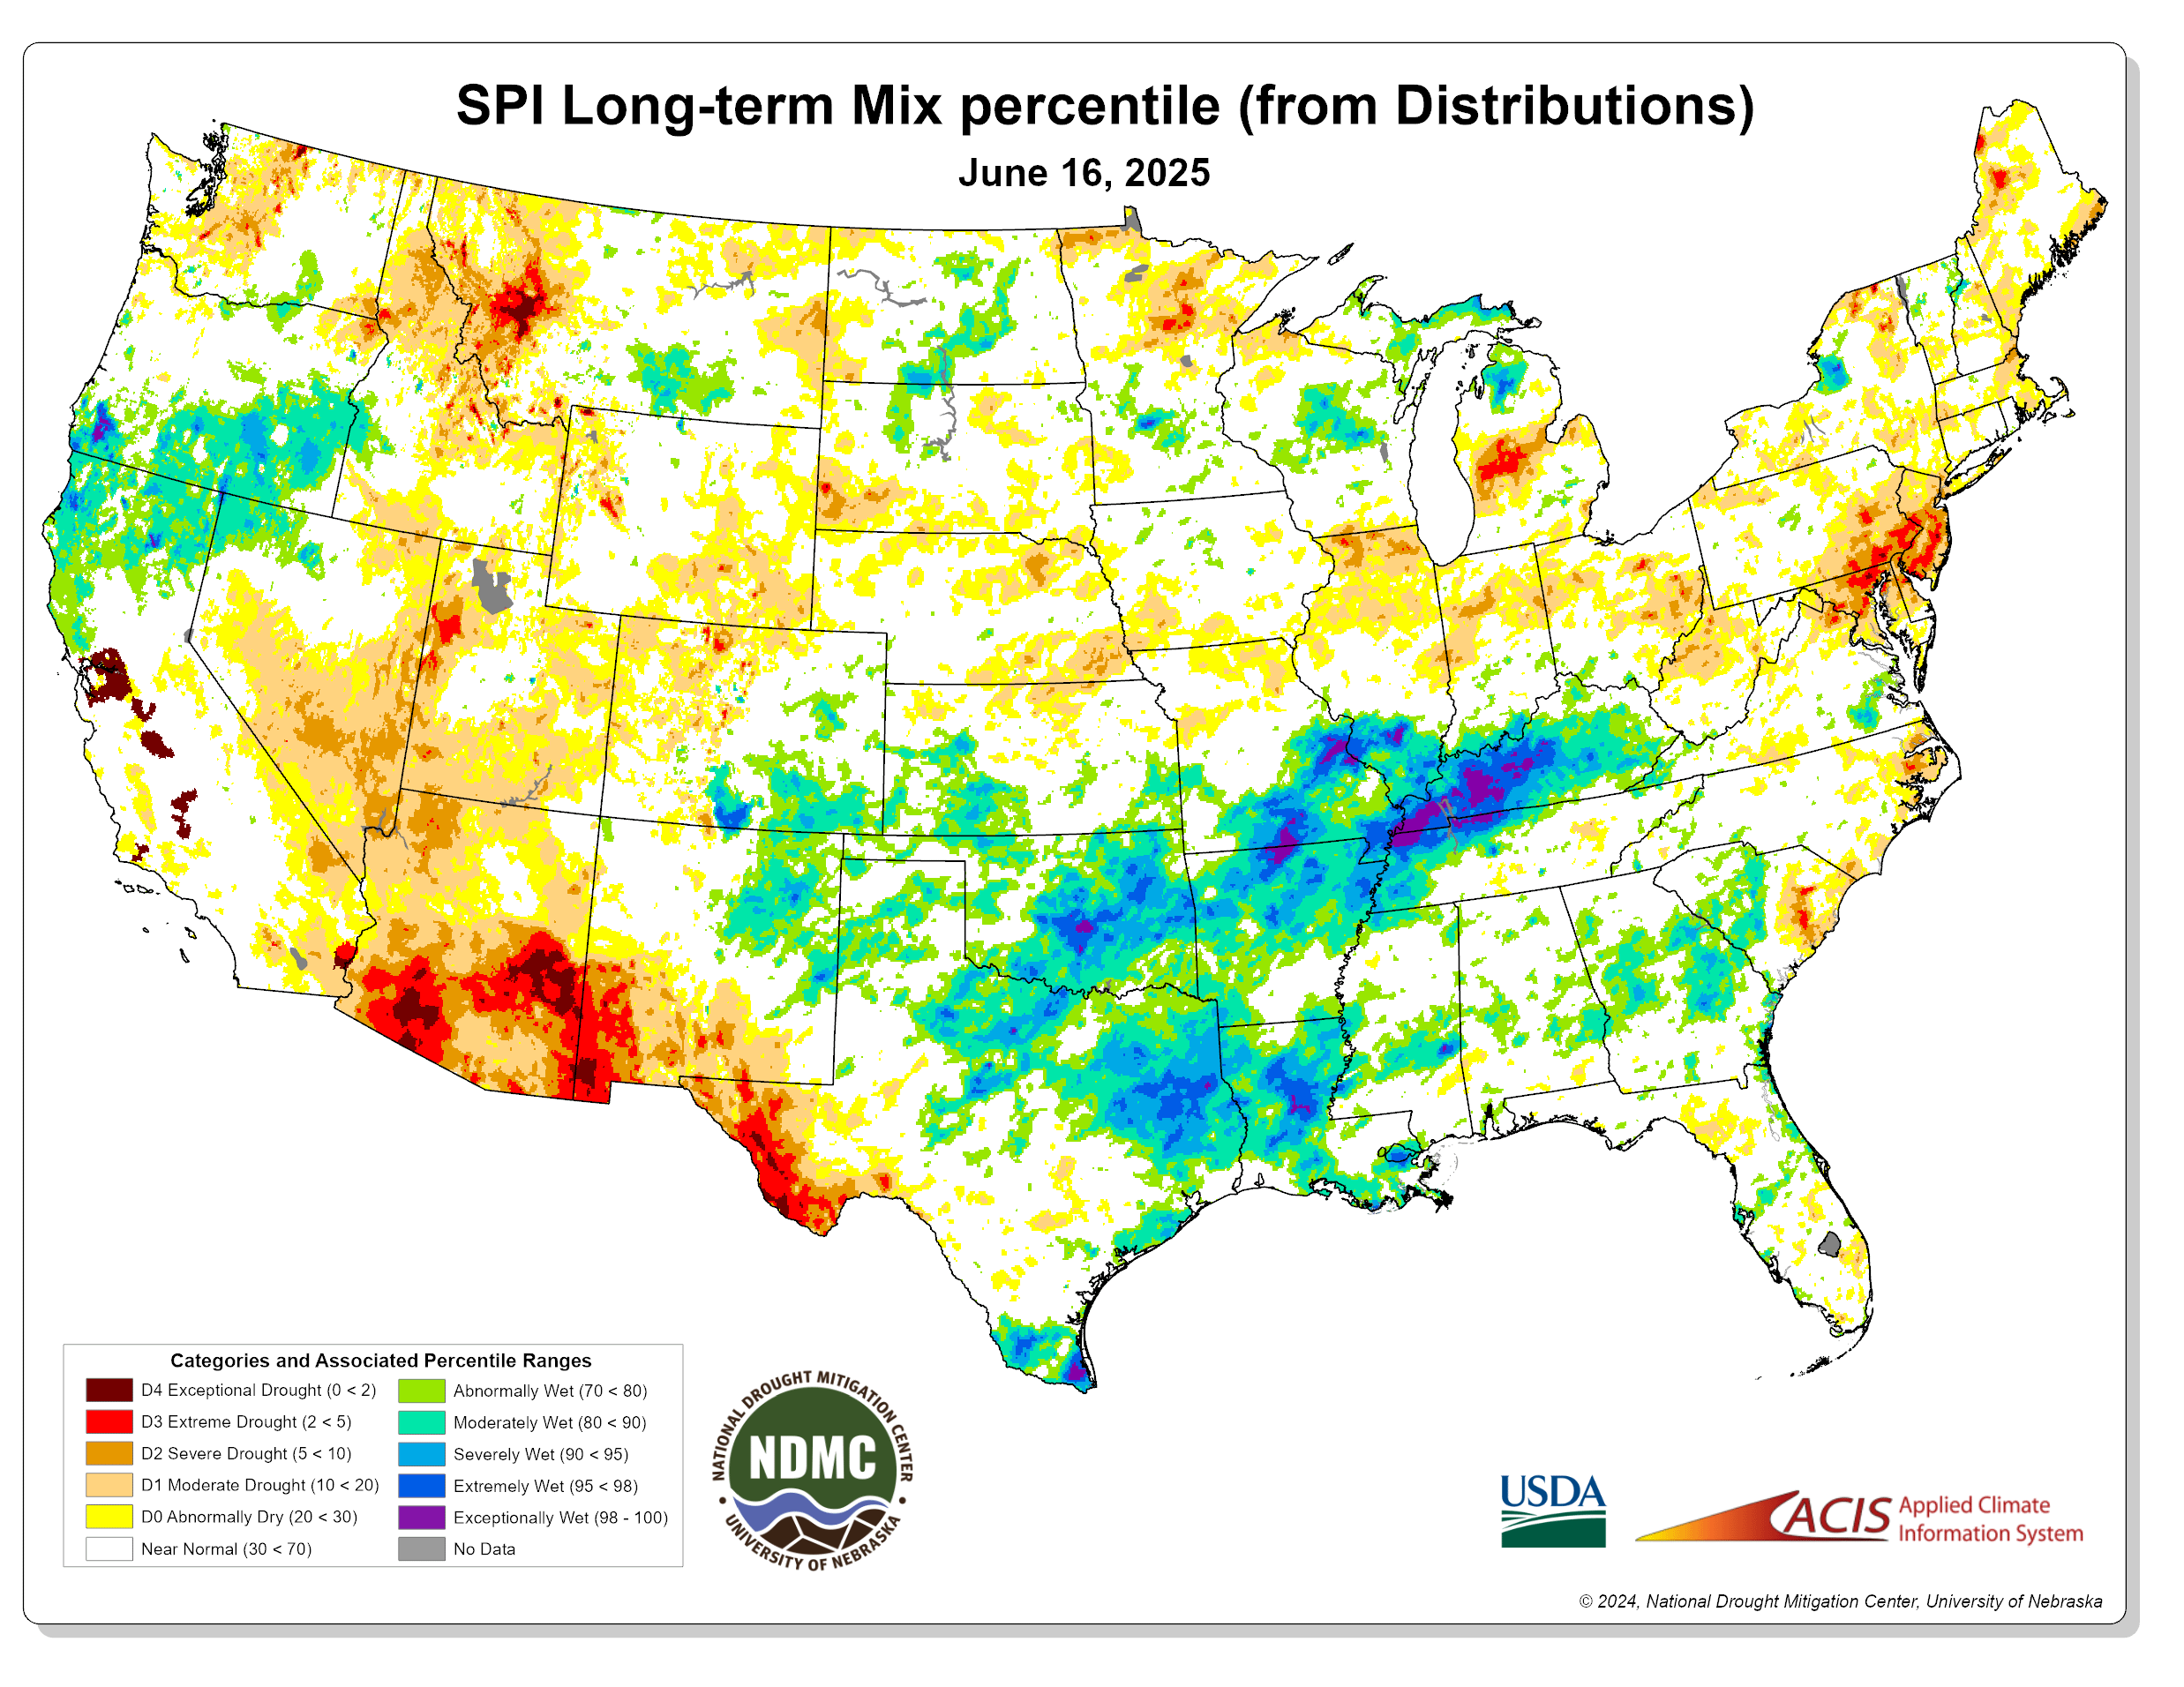
| Standardized Precipitation Index (SPI) Definition |
||
| 30 Day | 60 Day | 90 Day |
 |
 |
 |
|
|
||
Resources
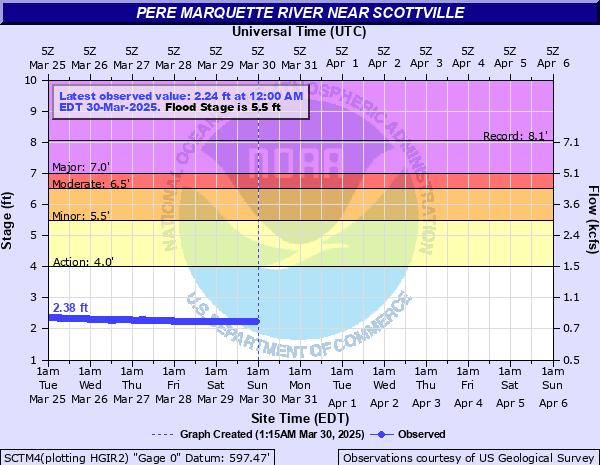
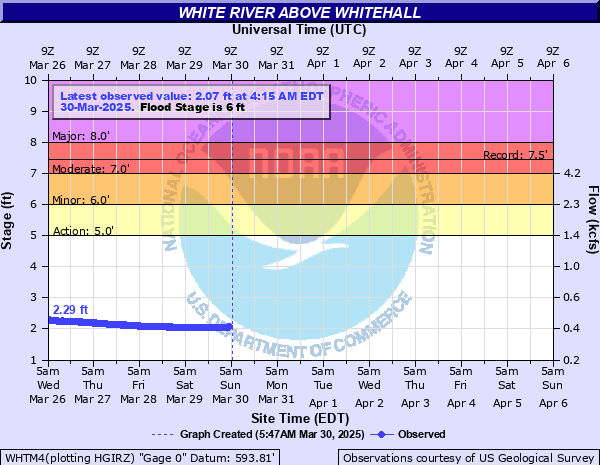
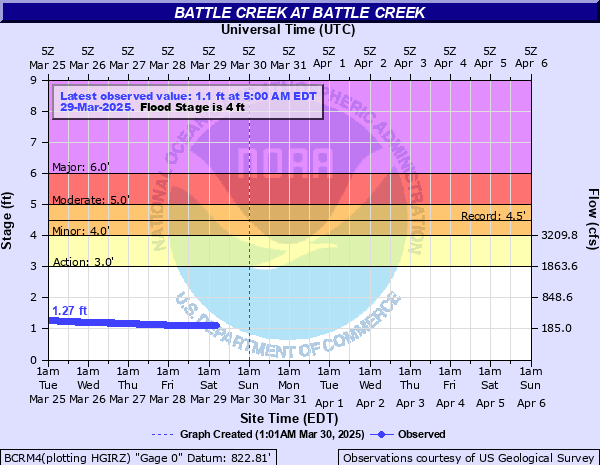
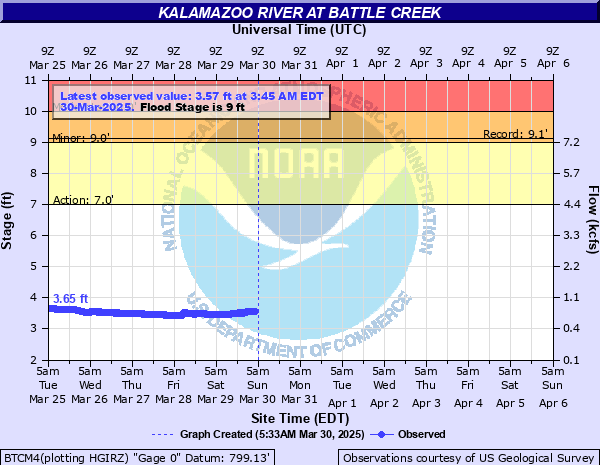
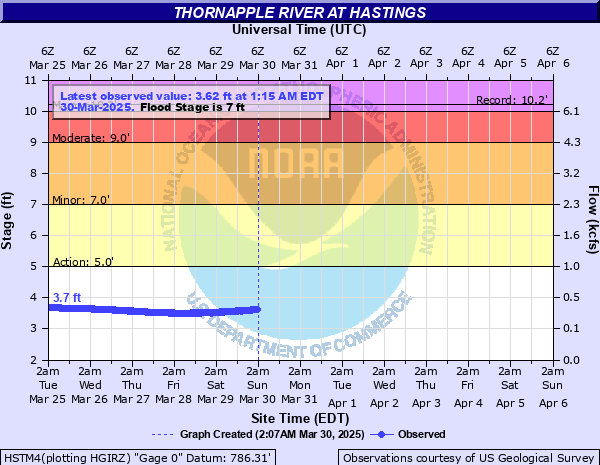
River Conditions
|
Current Conditions Links go to USGS 30 Day plot showing a comparison with climatology |
|
| Pere Marquette River at Scottville | White River above Whitehall |
|
Current Conditions
|
Current Conditions
|
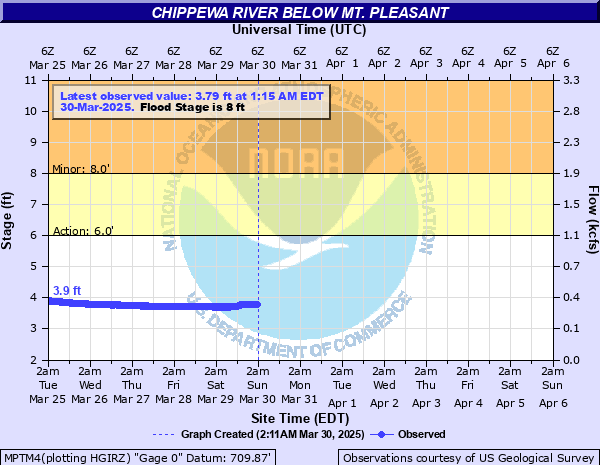
| Muskegon River at Evart | Chippewa River at Mt. Pleasant |
 |
 |
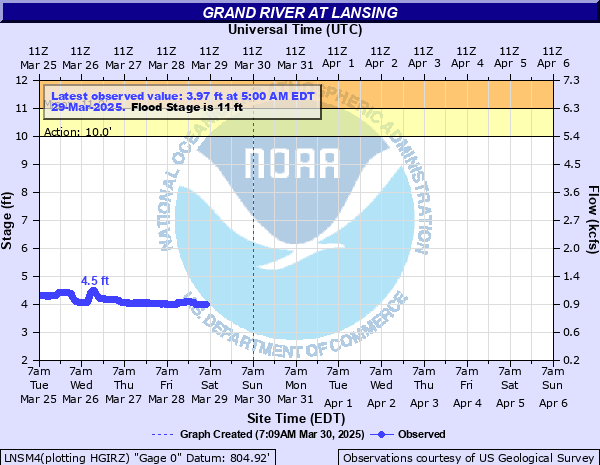
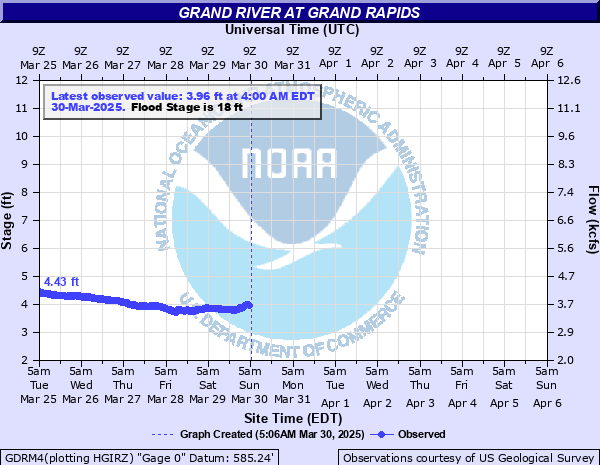
| Grand River at Lansing | Grand River at Grand Rapids | ||||
 |
 |
||||
|
|
|||||
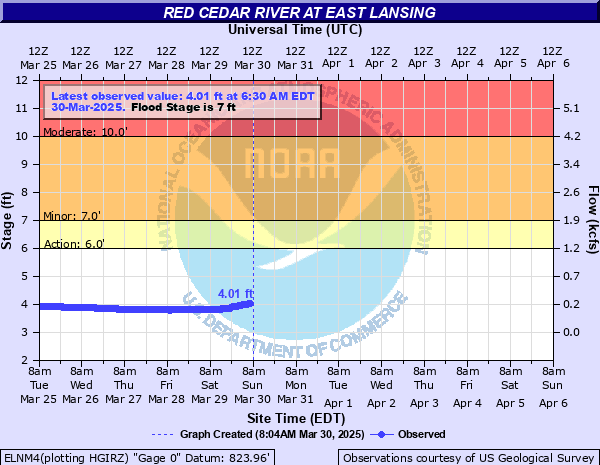
| Red Cedar at East Lansing | Thornapple River at Hastings | ||||
 |
 |
||||
|
|||||
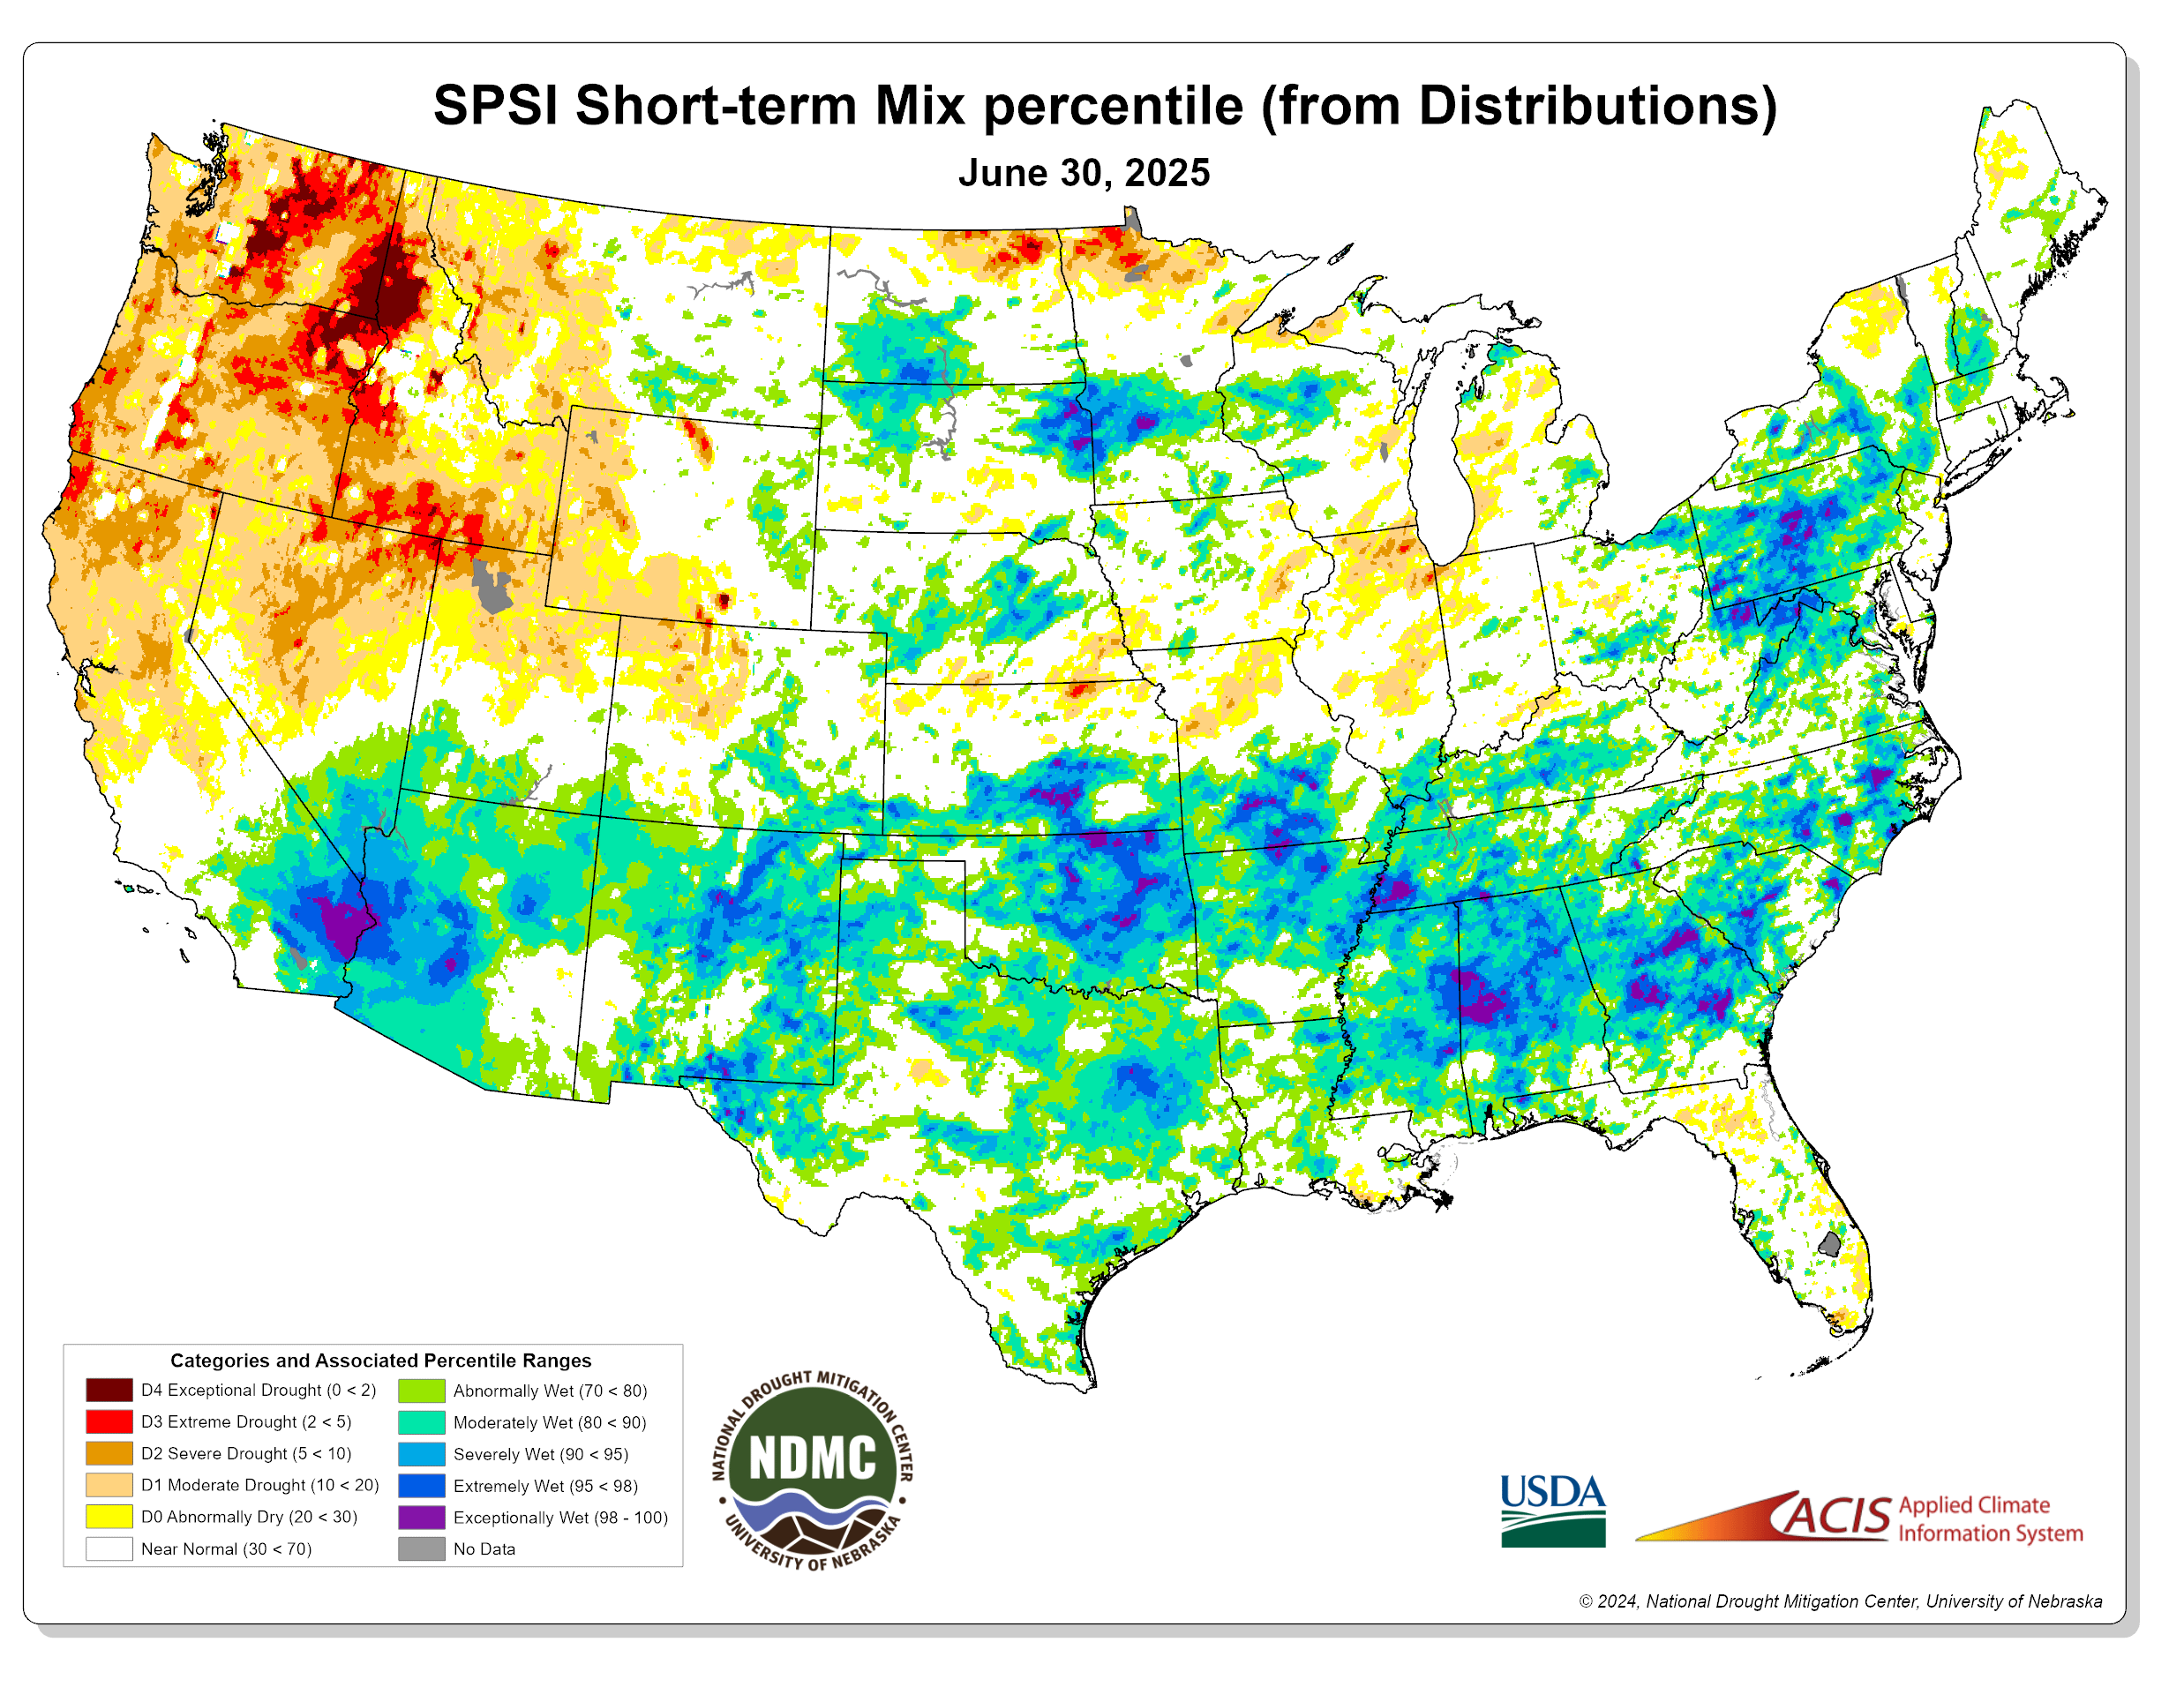
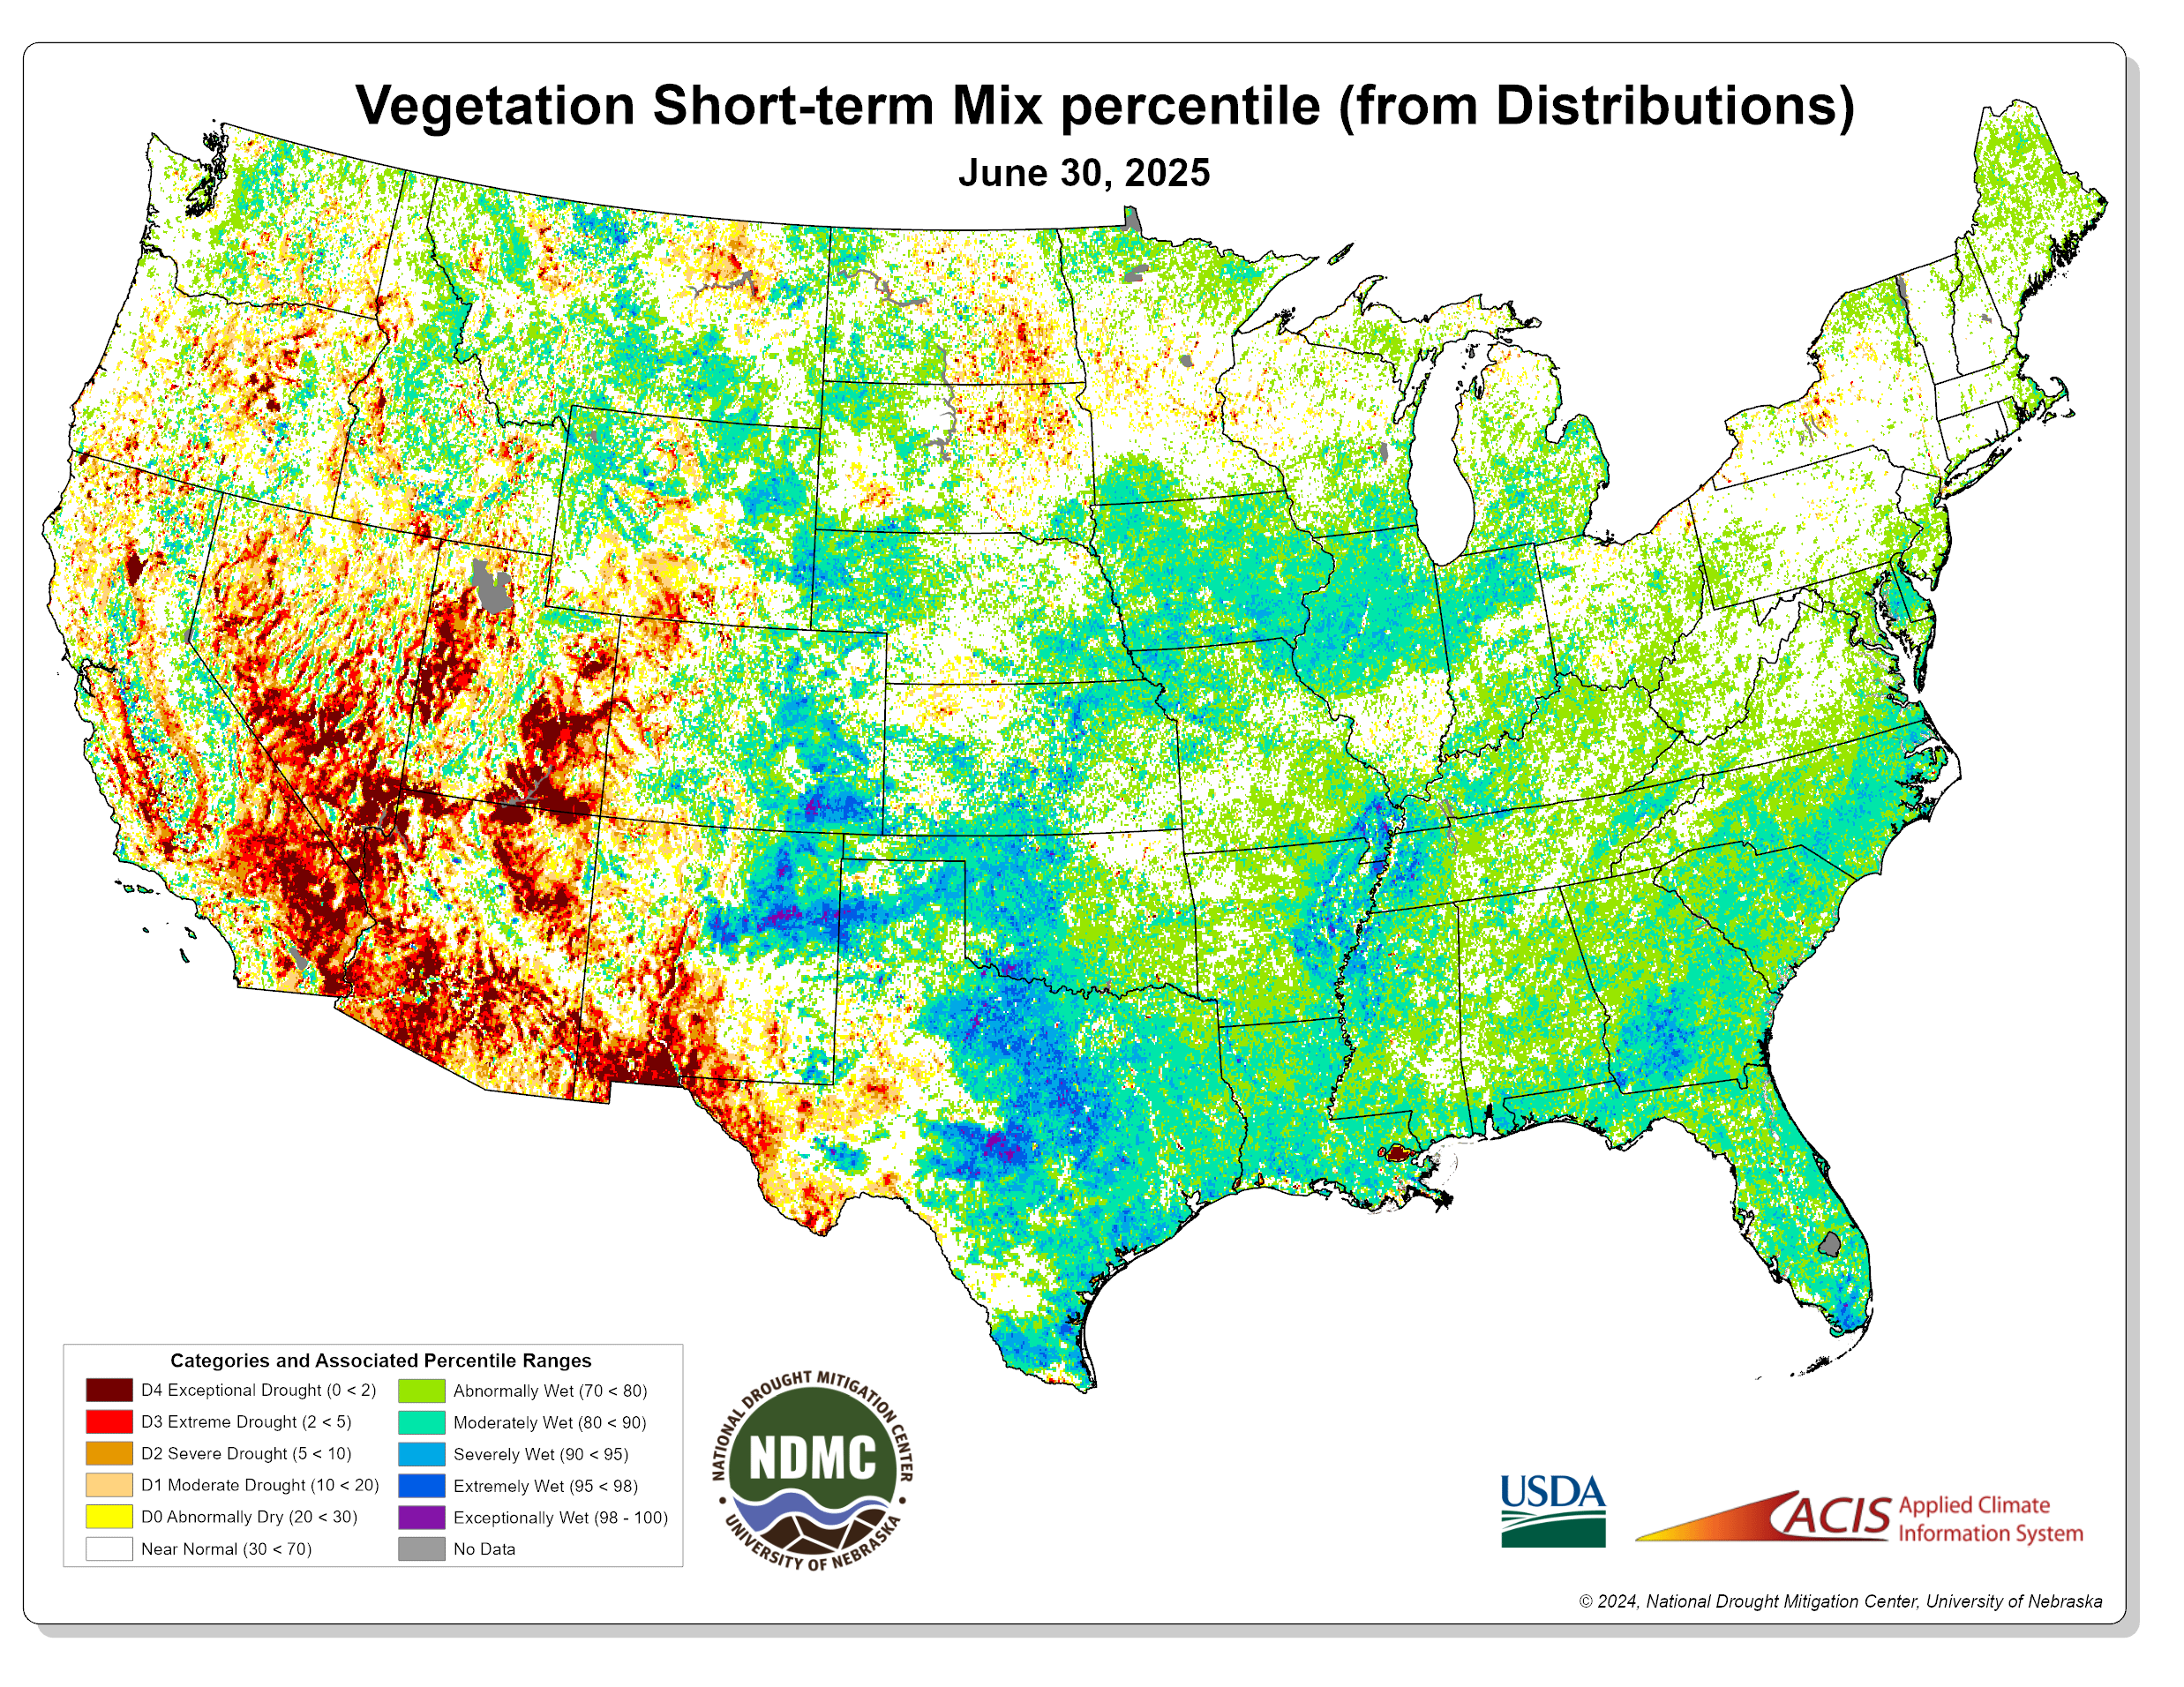
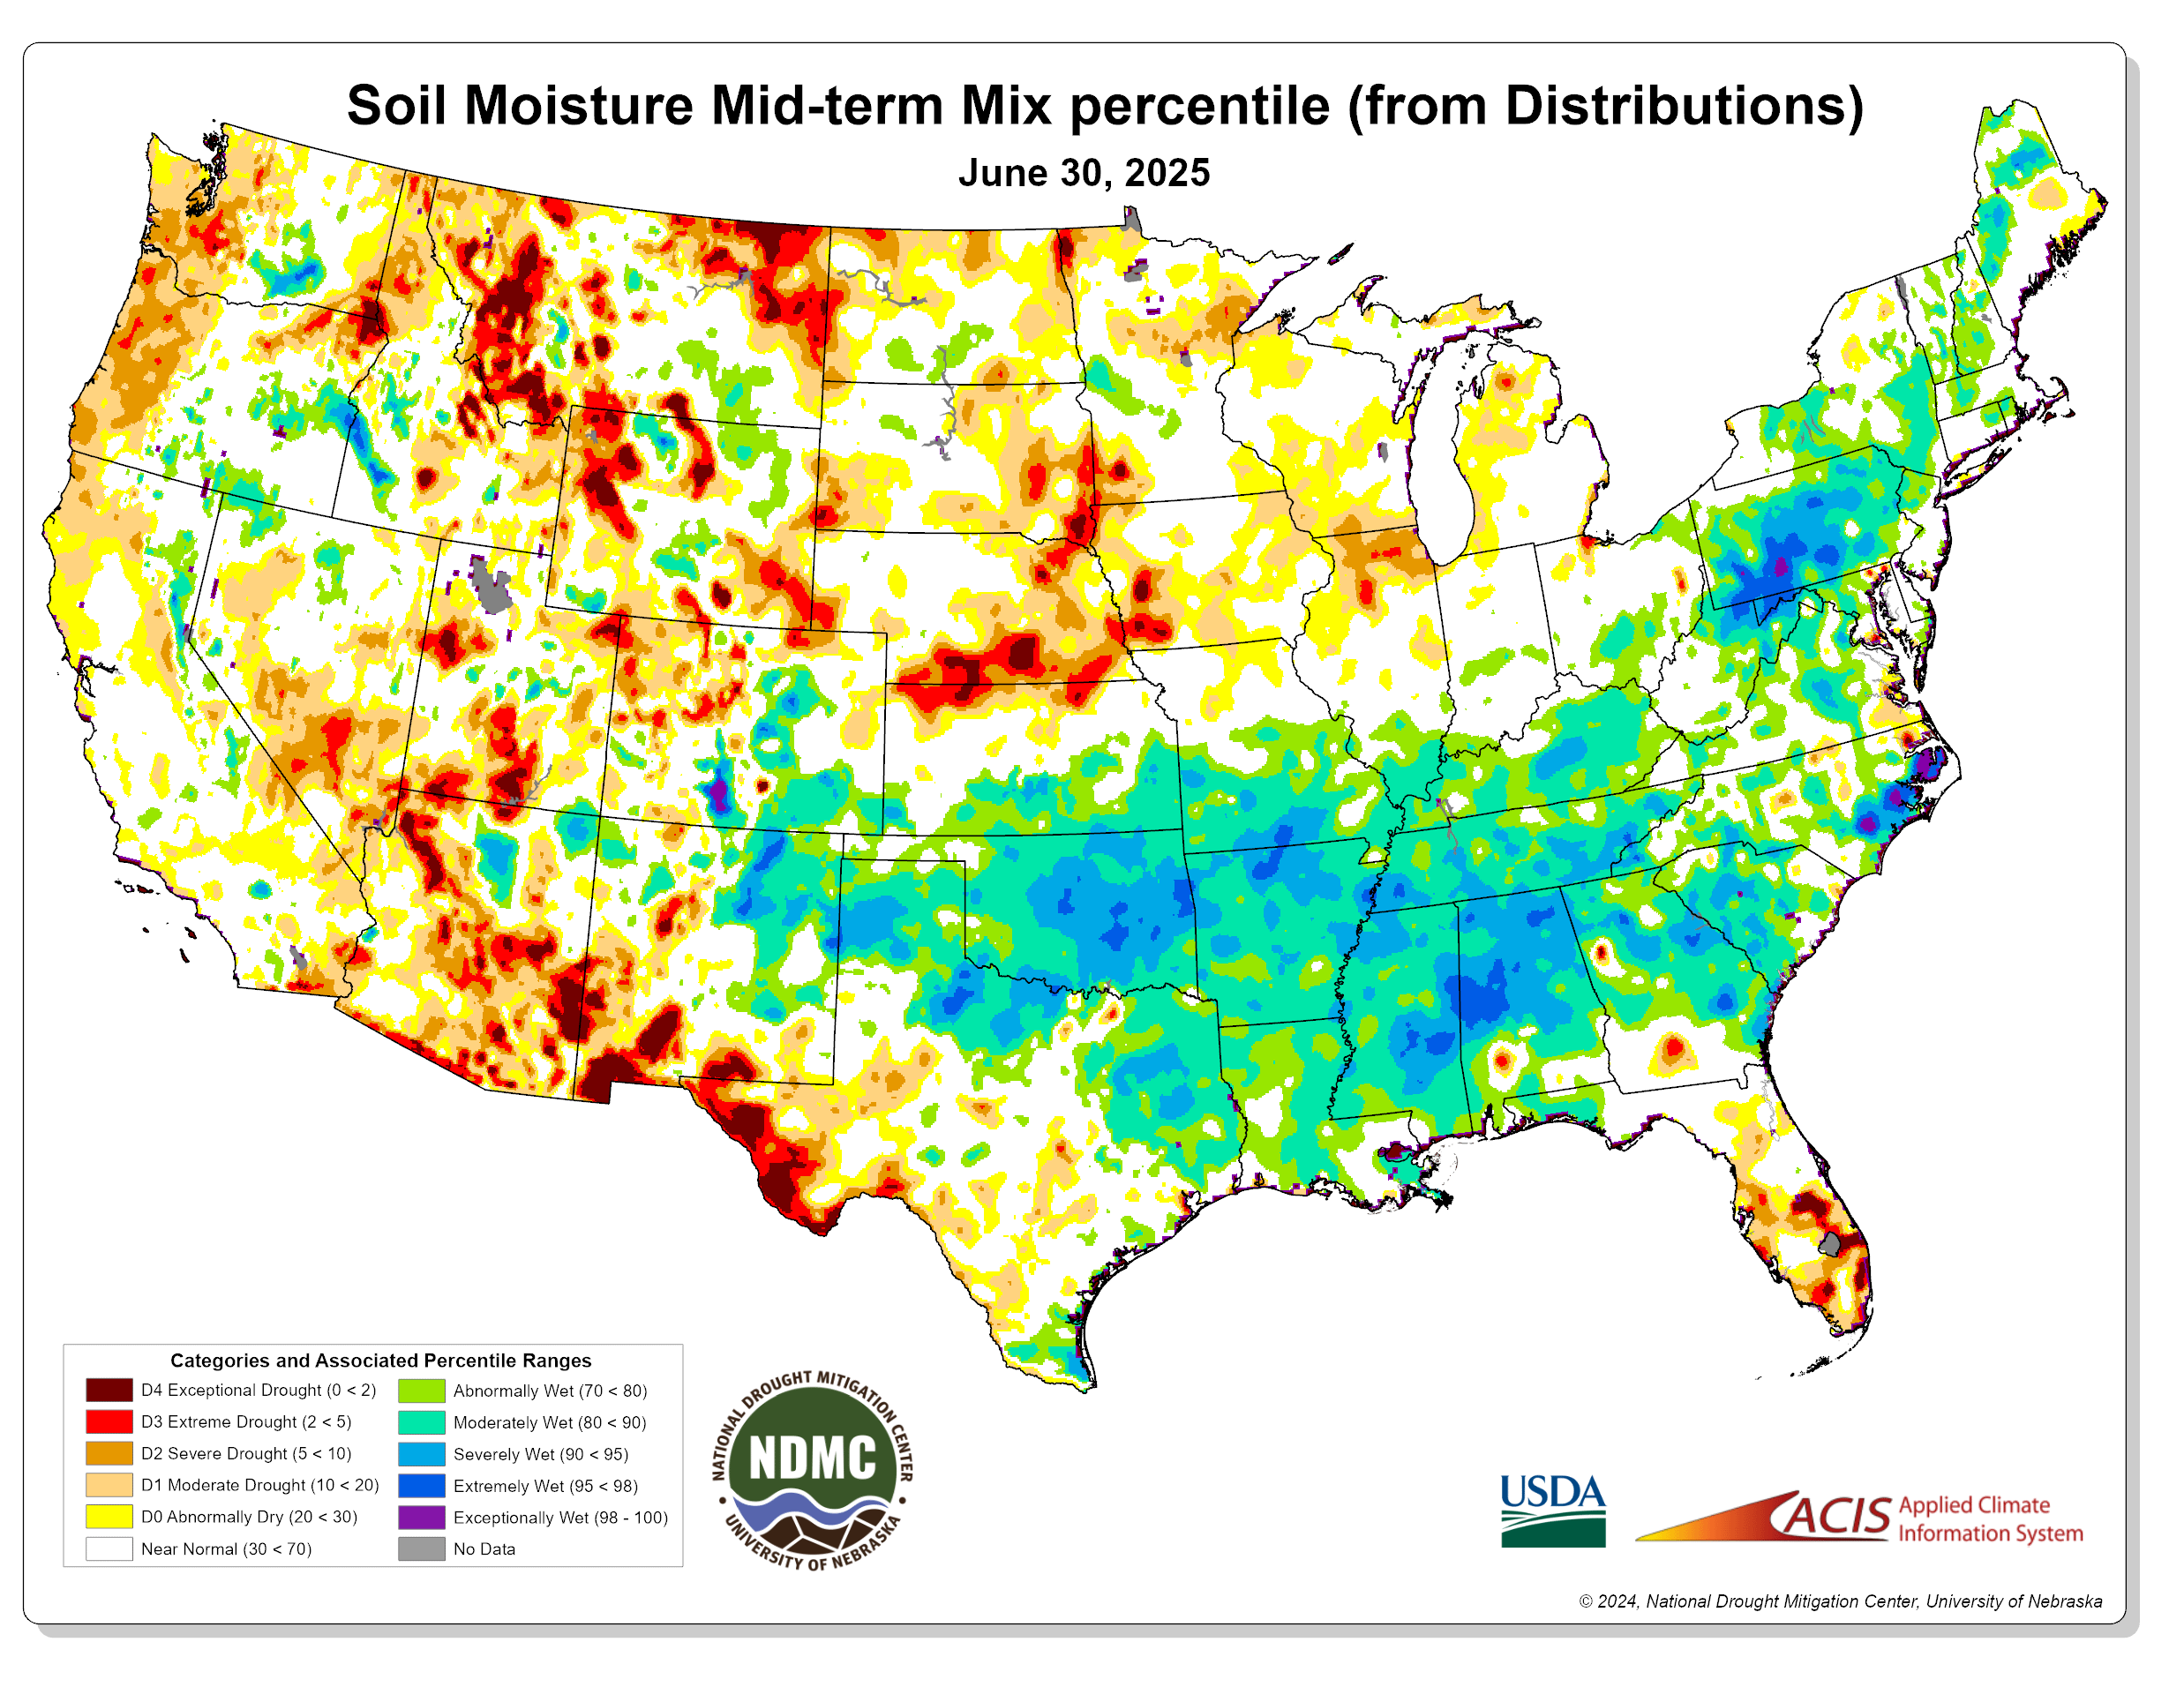
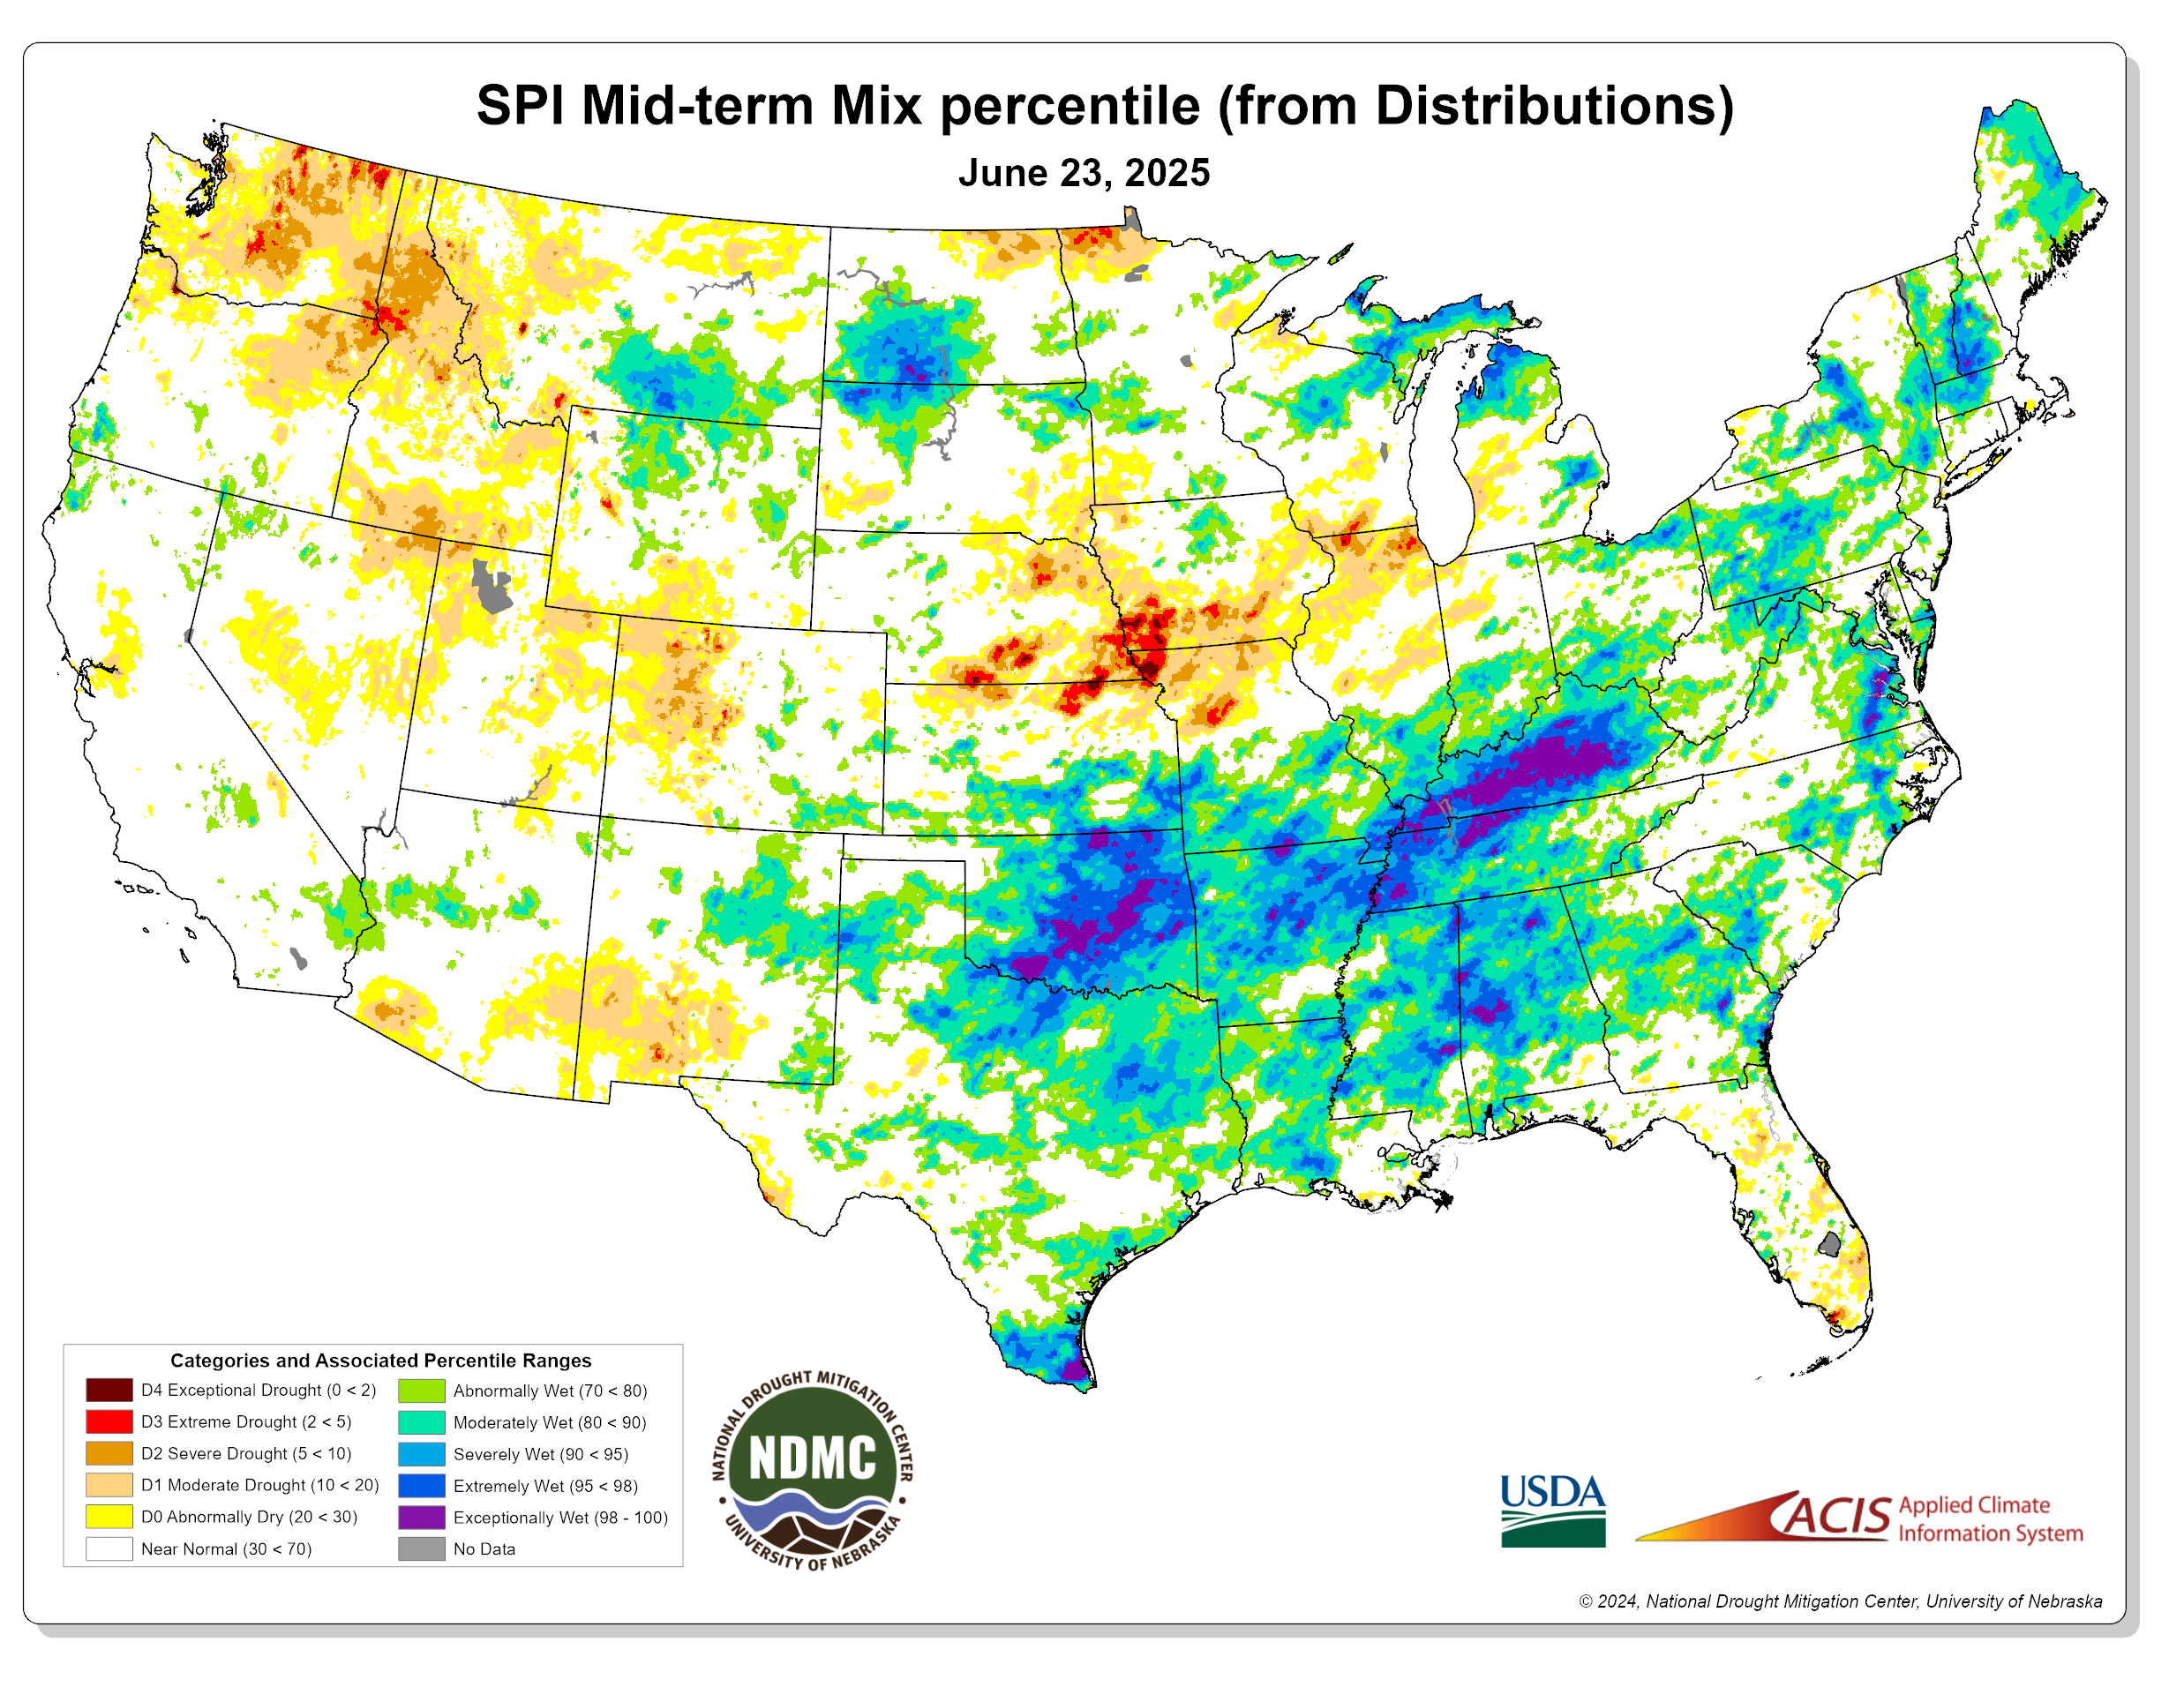
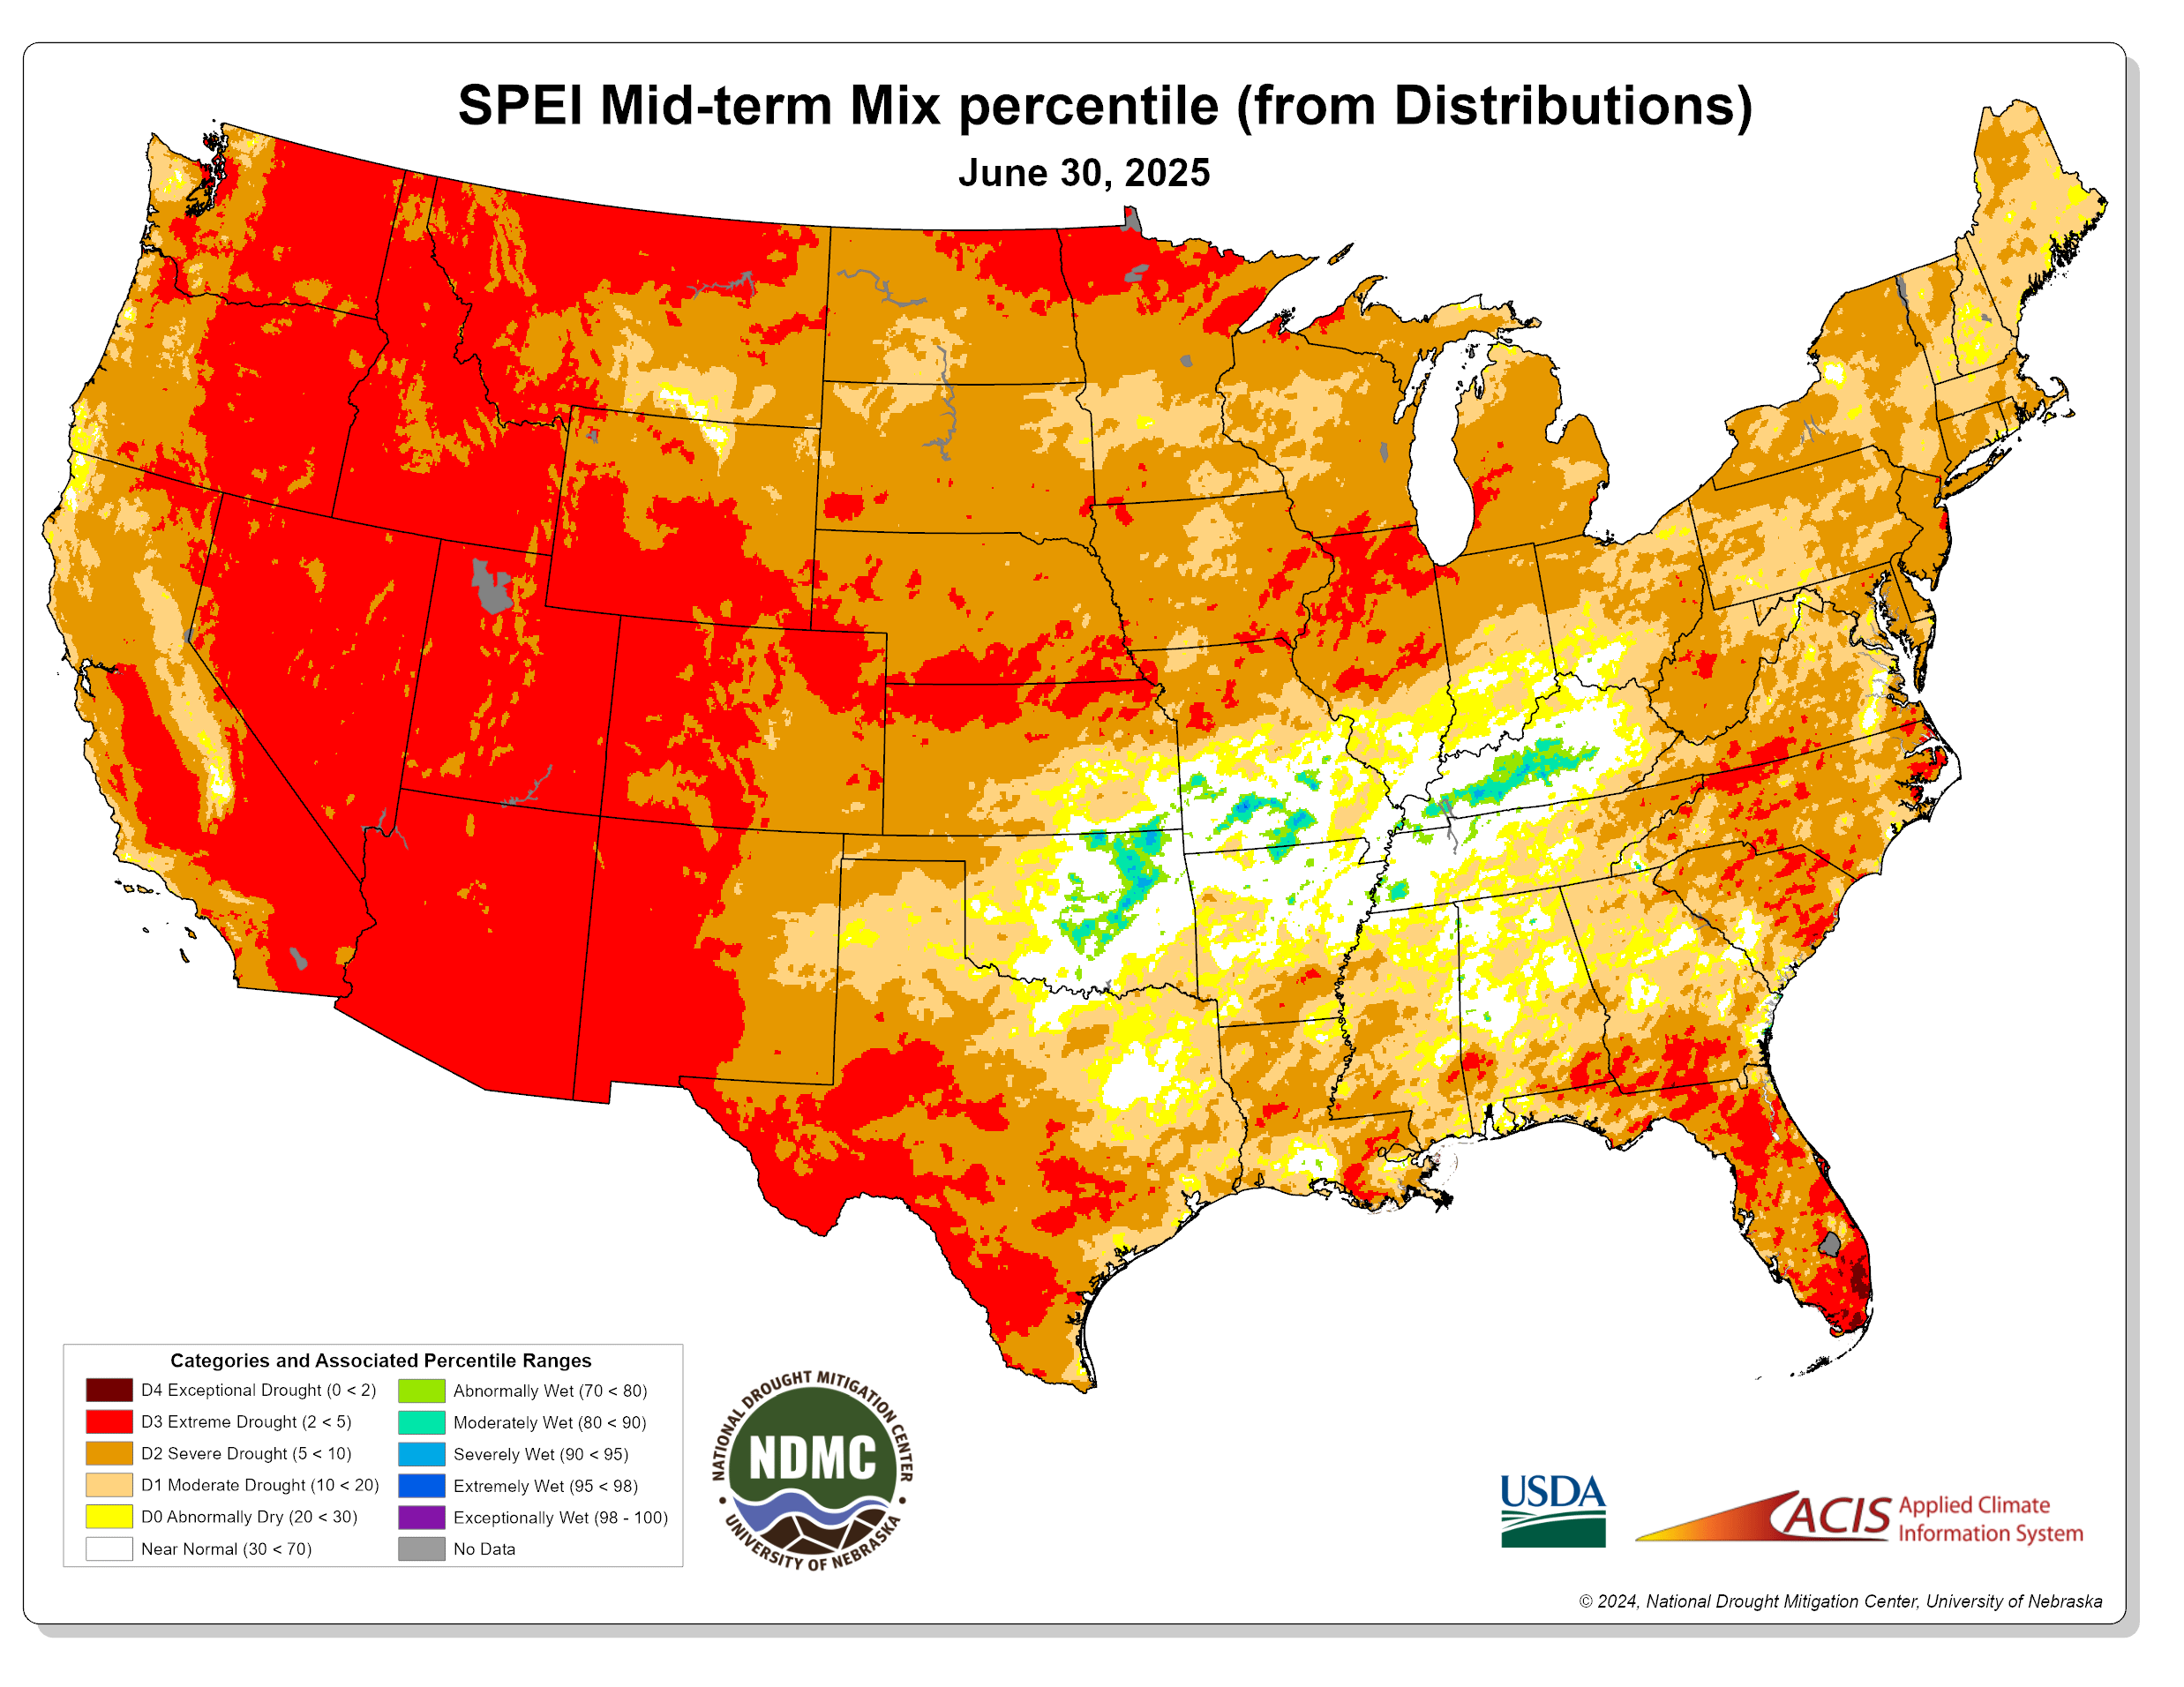
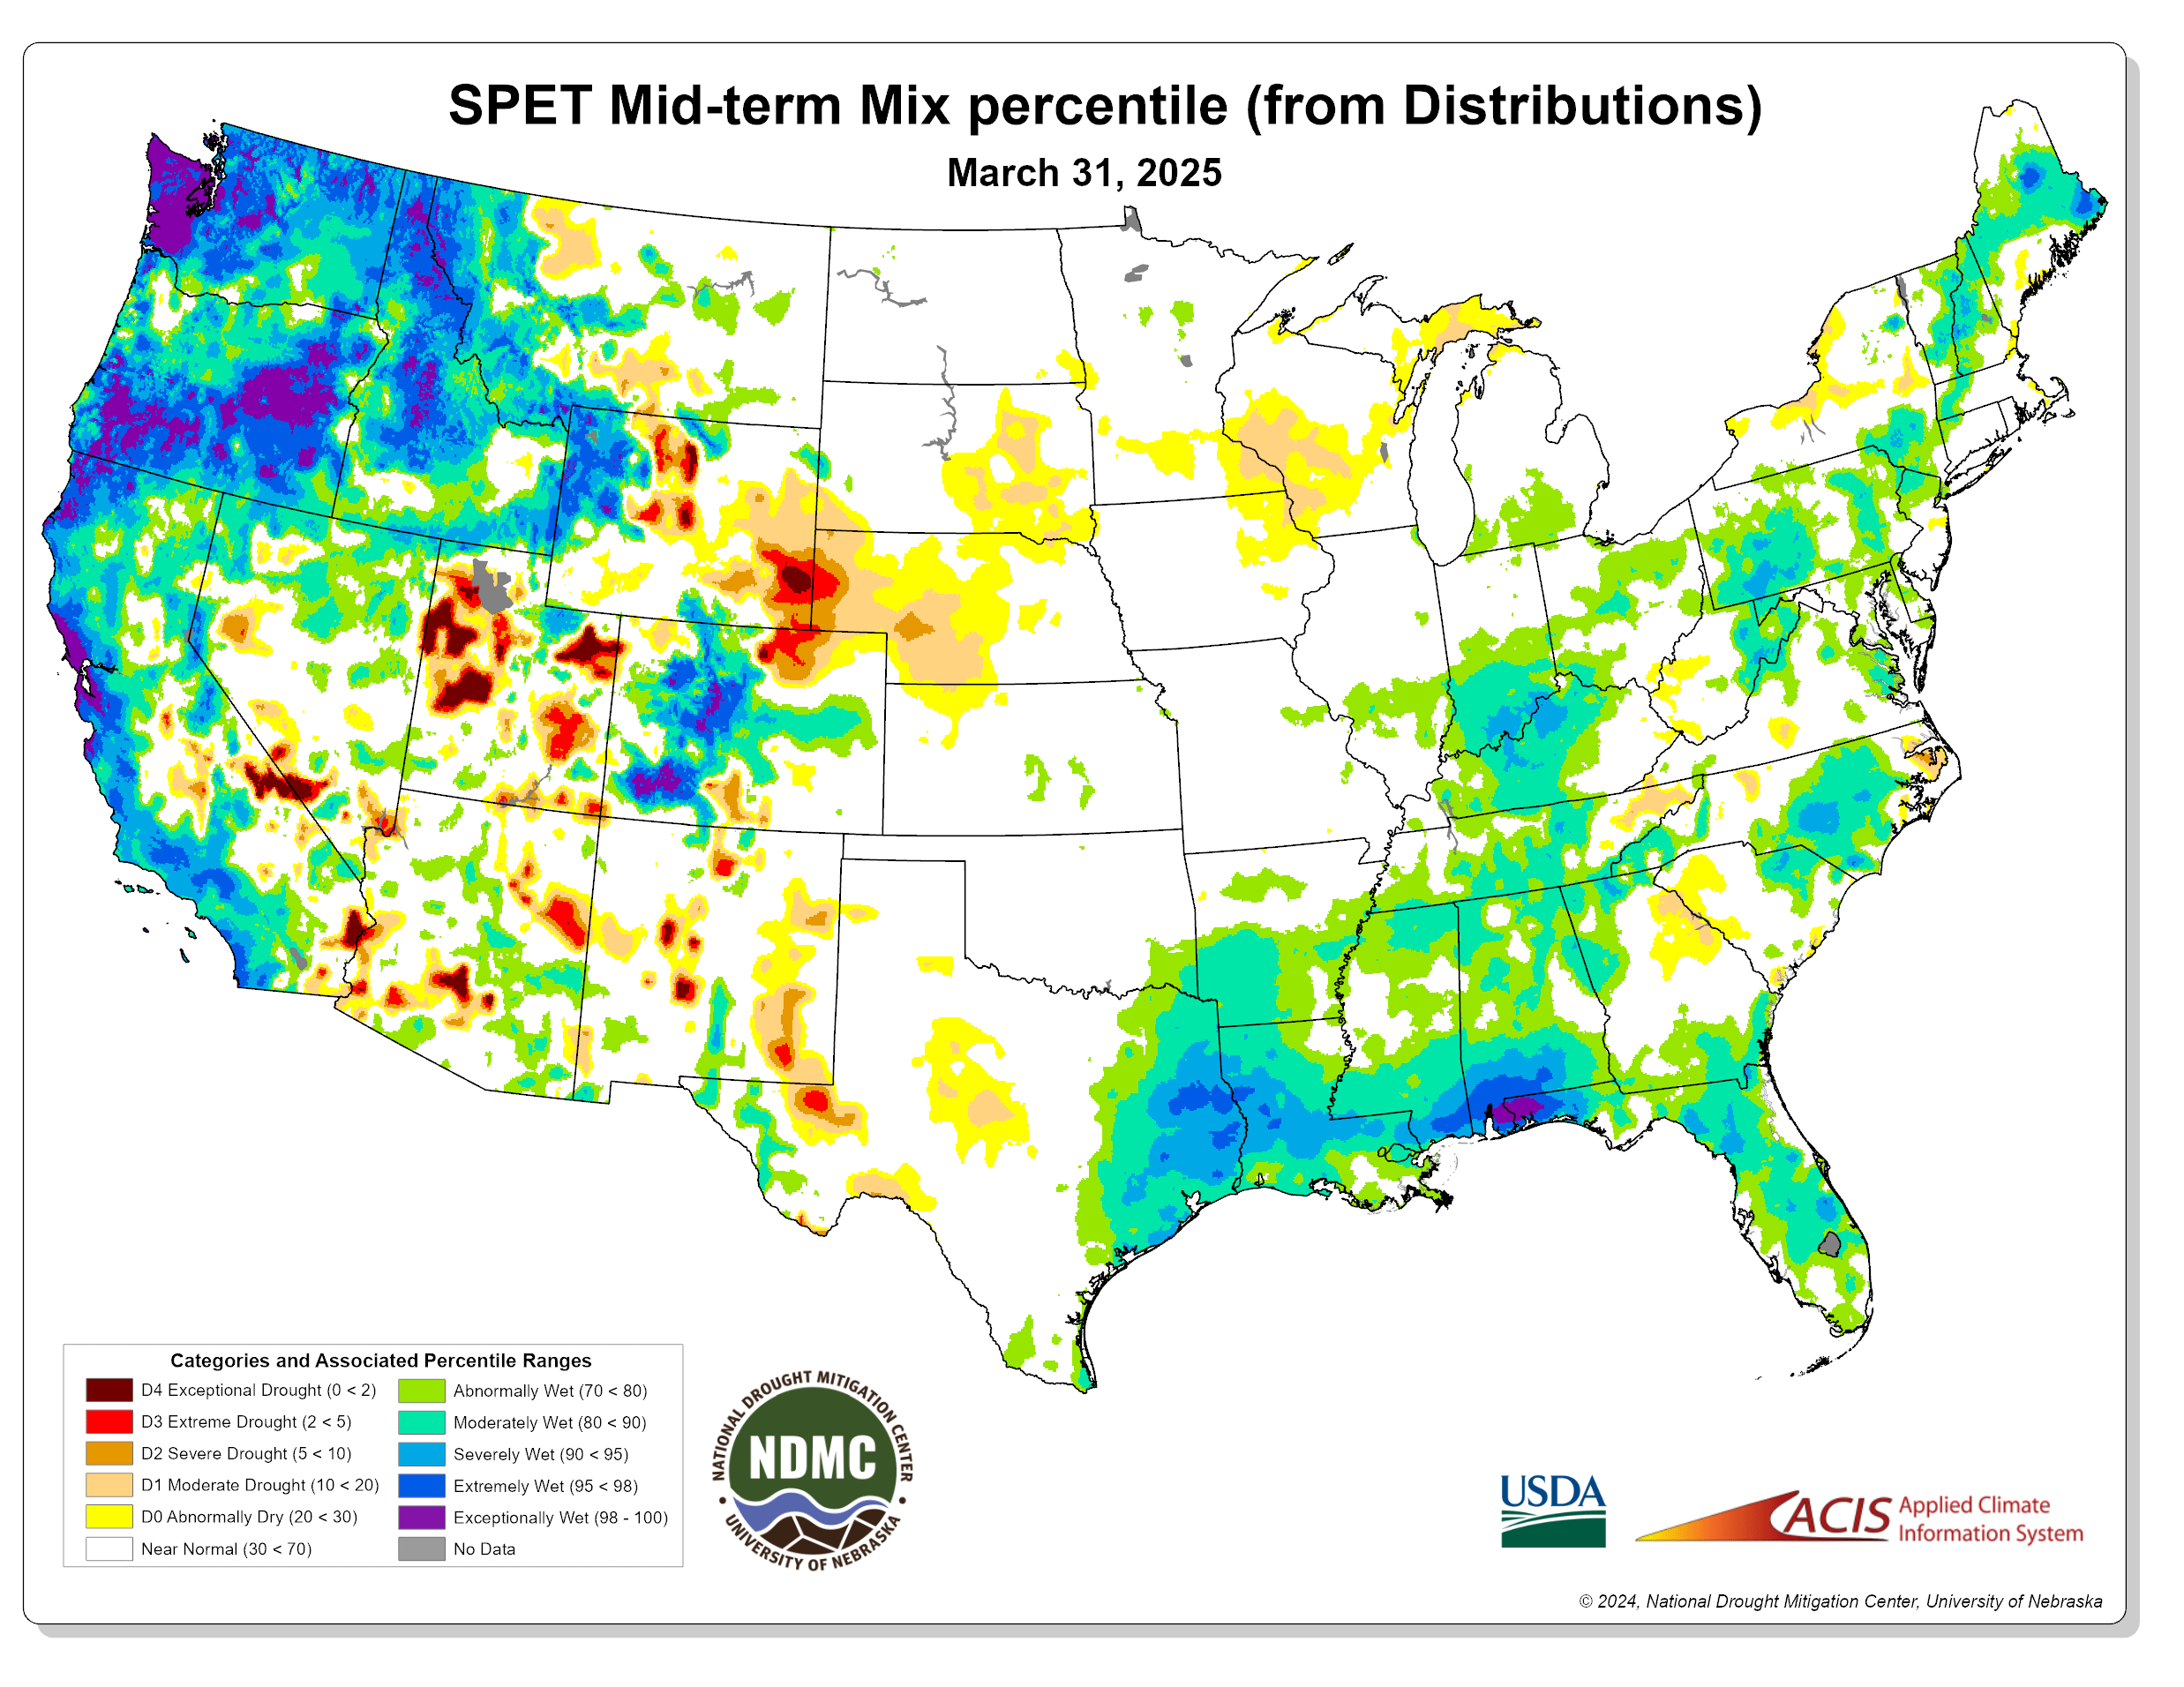
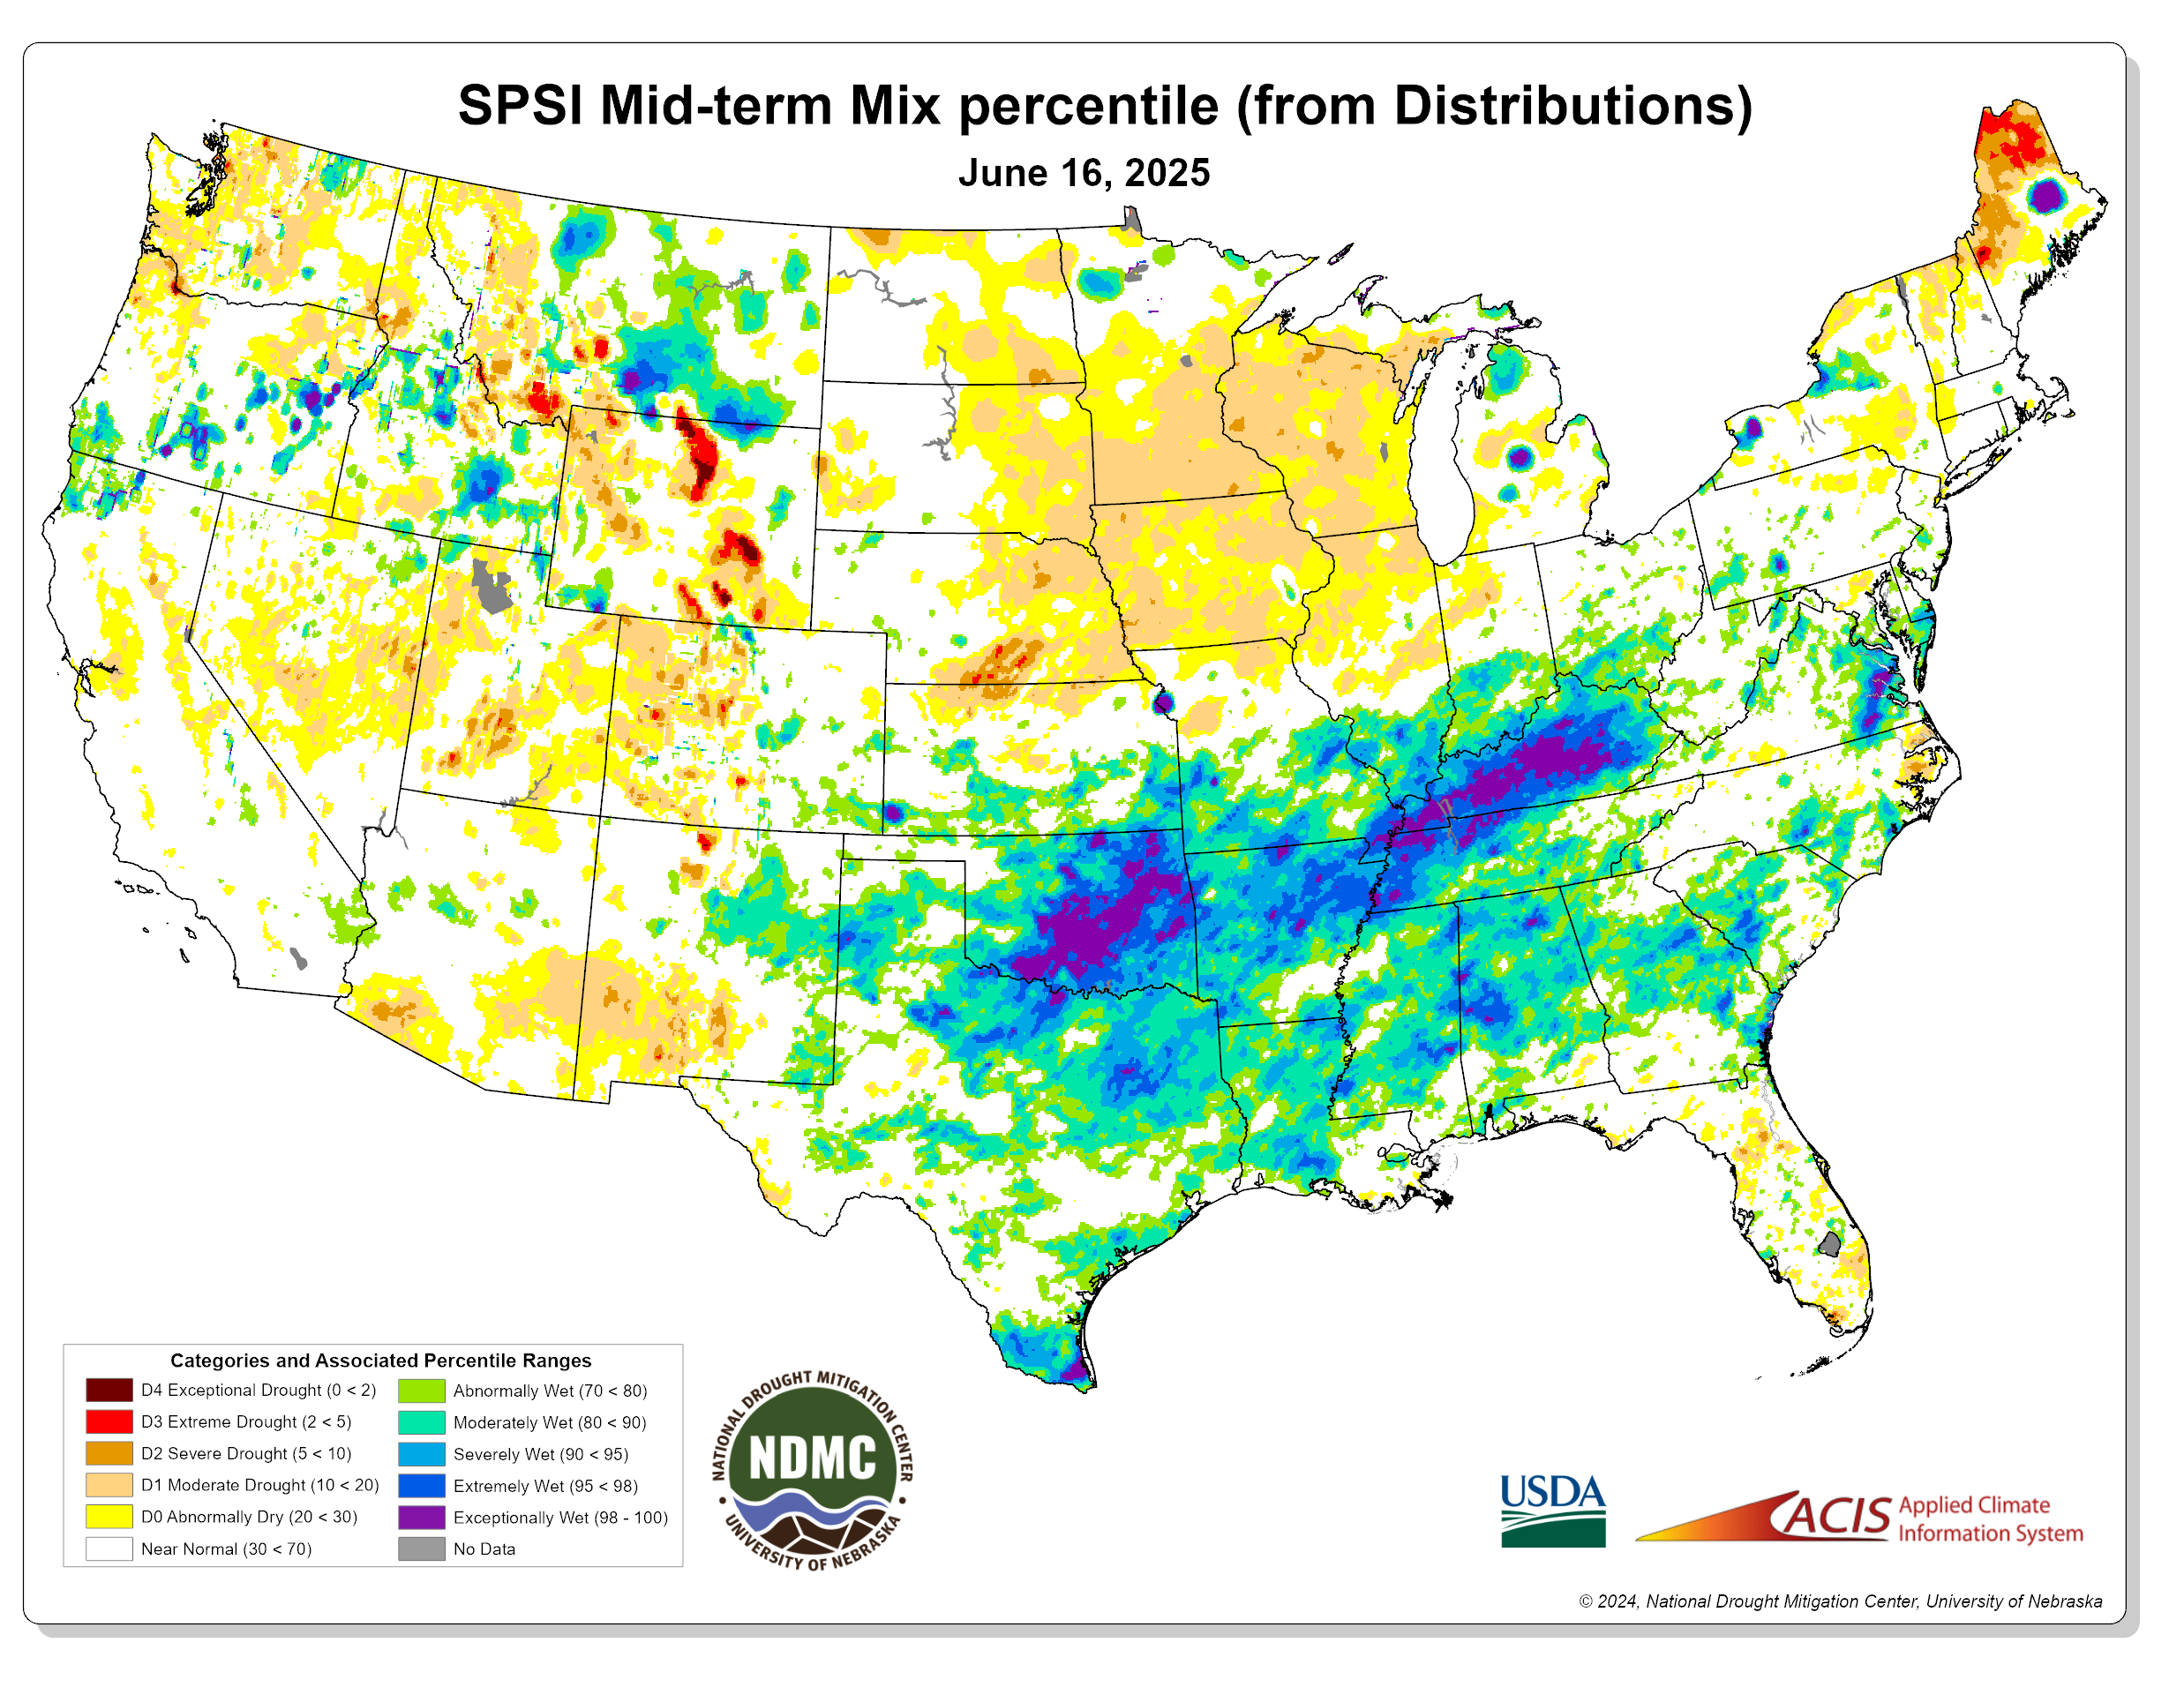
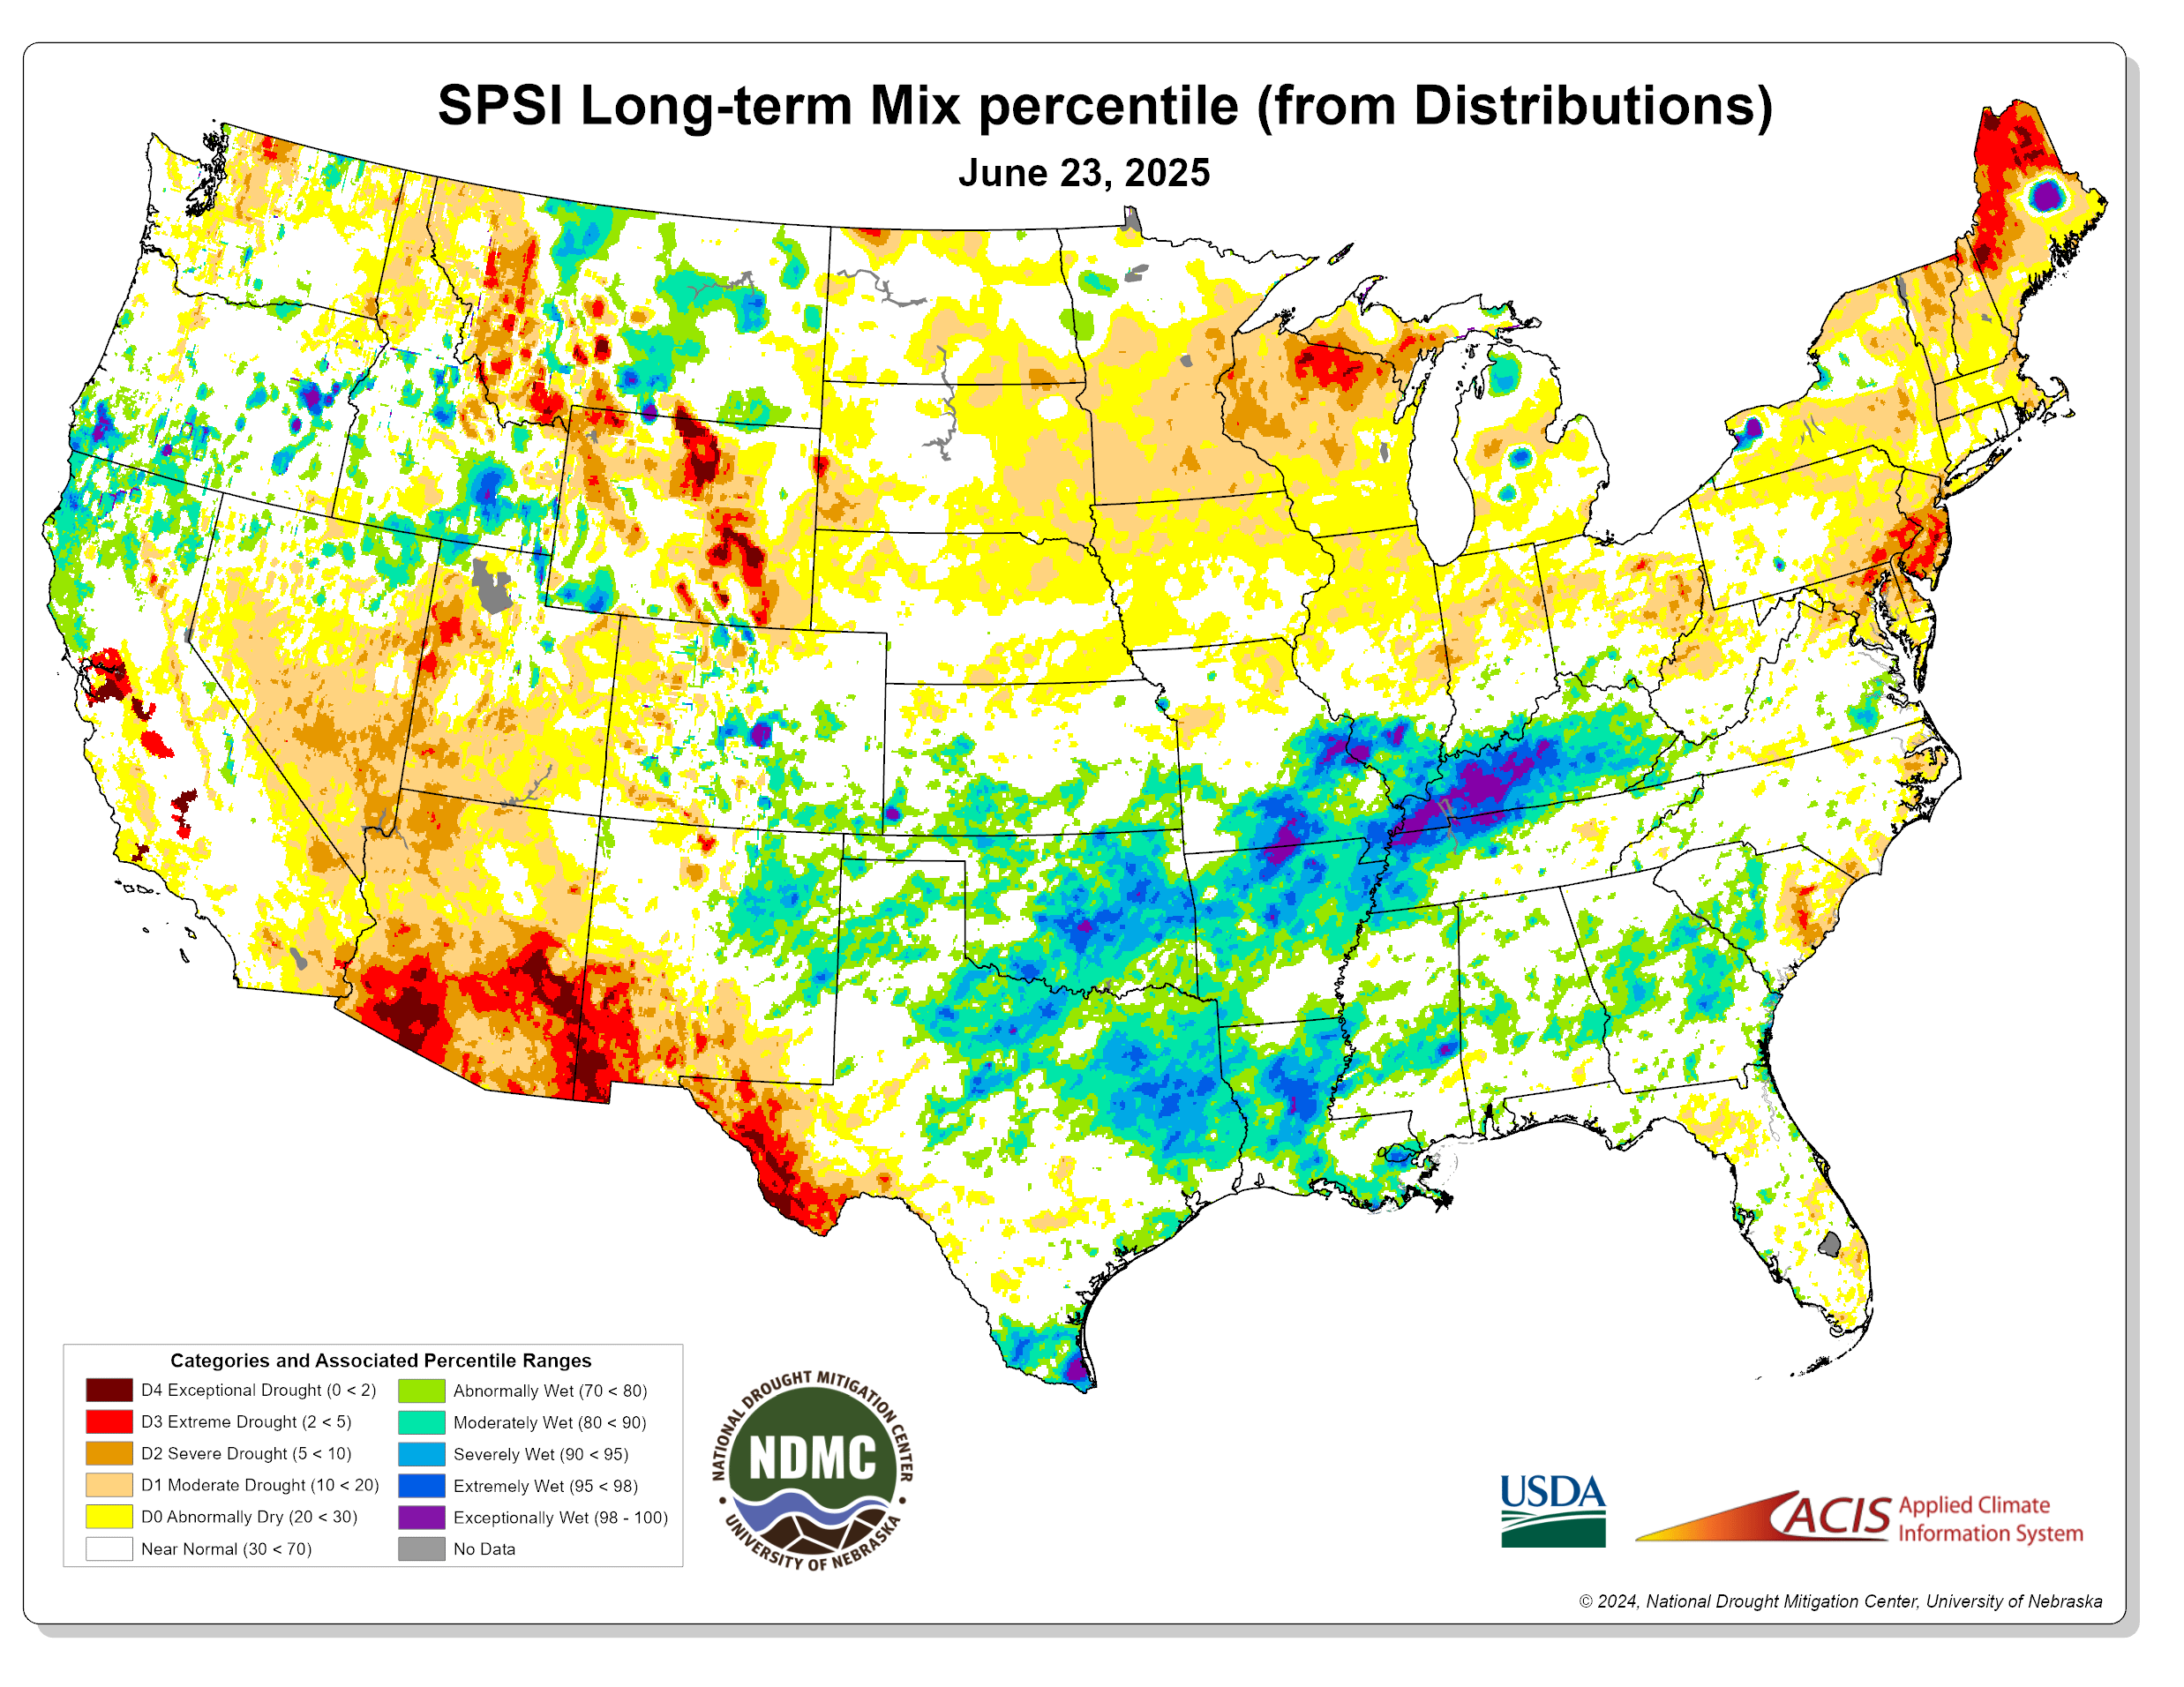
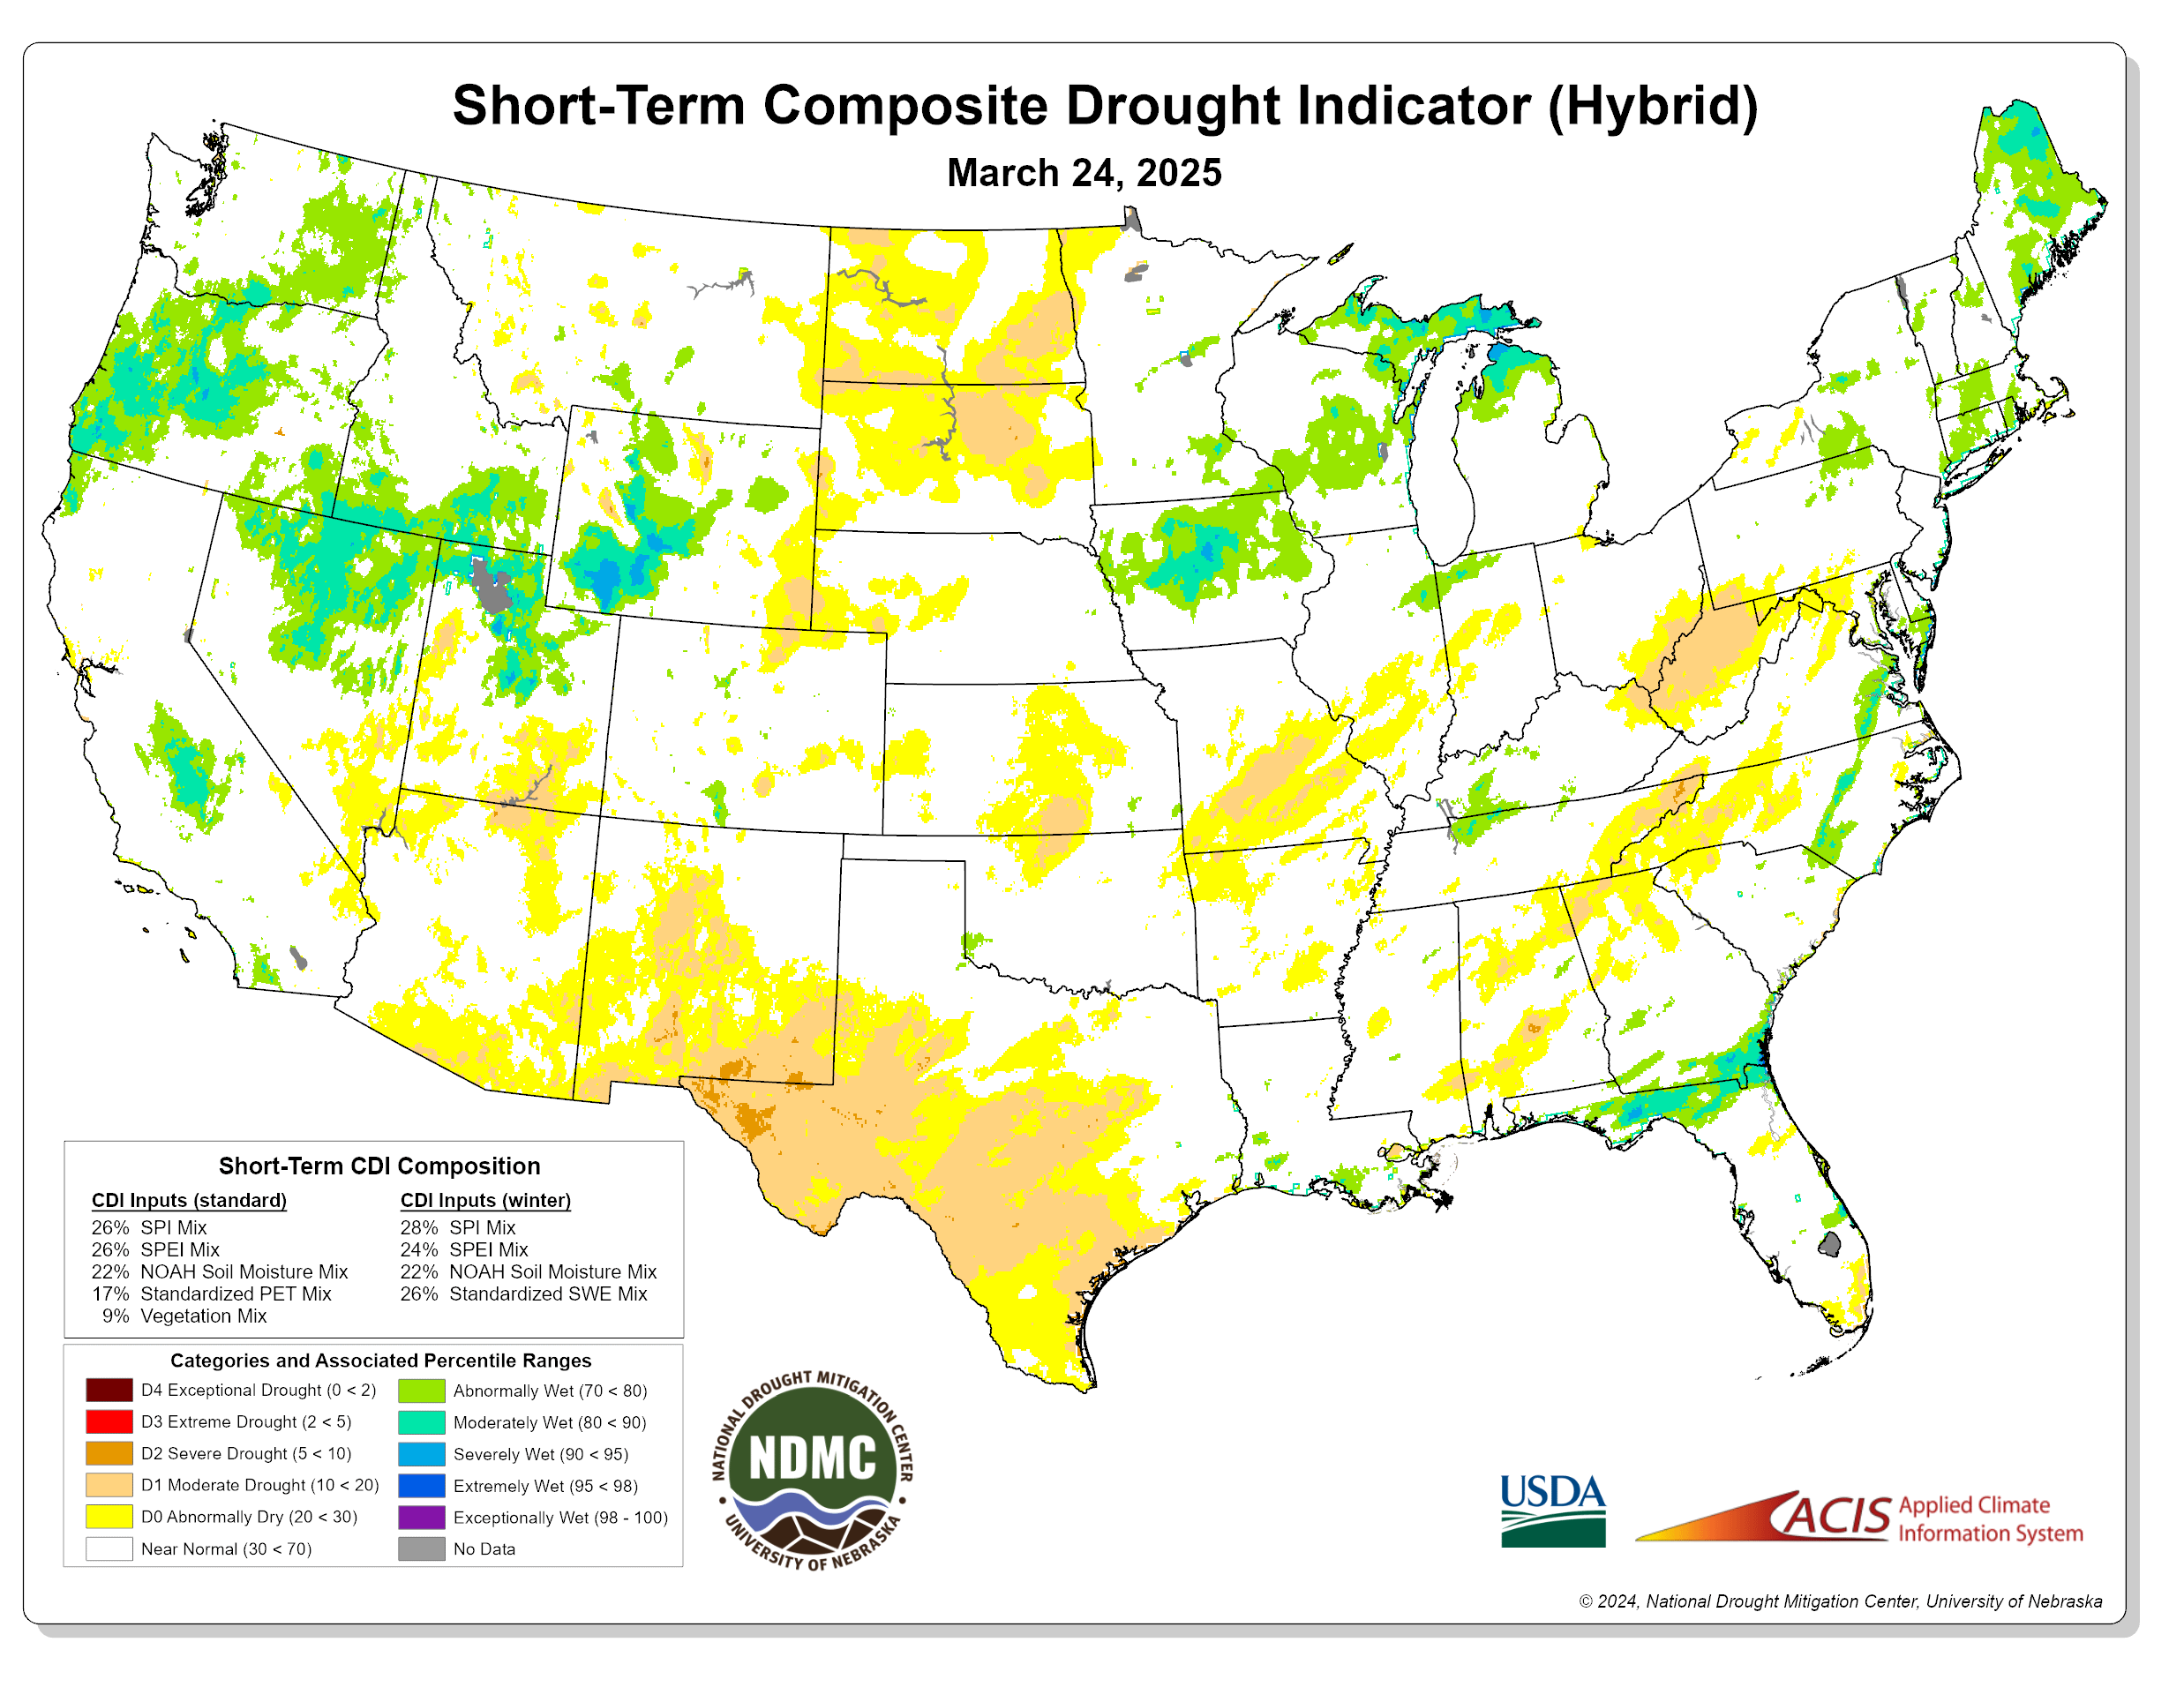
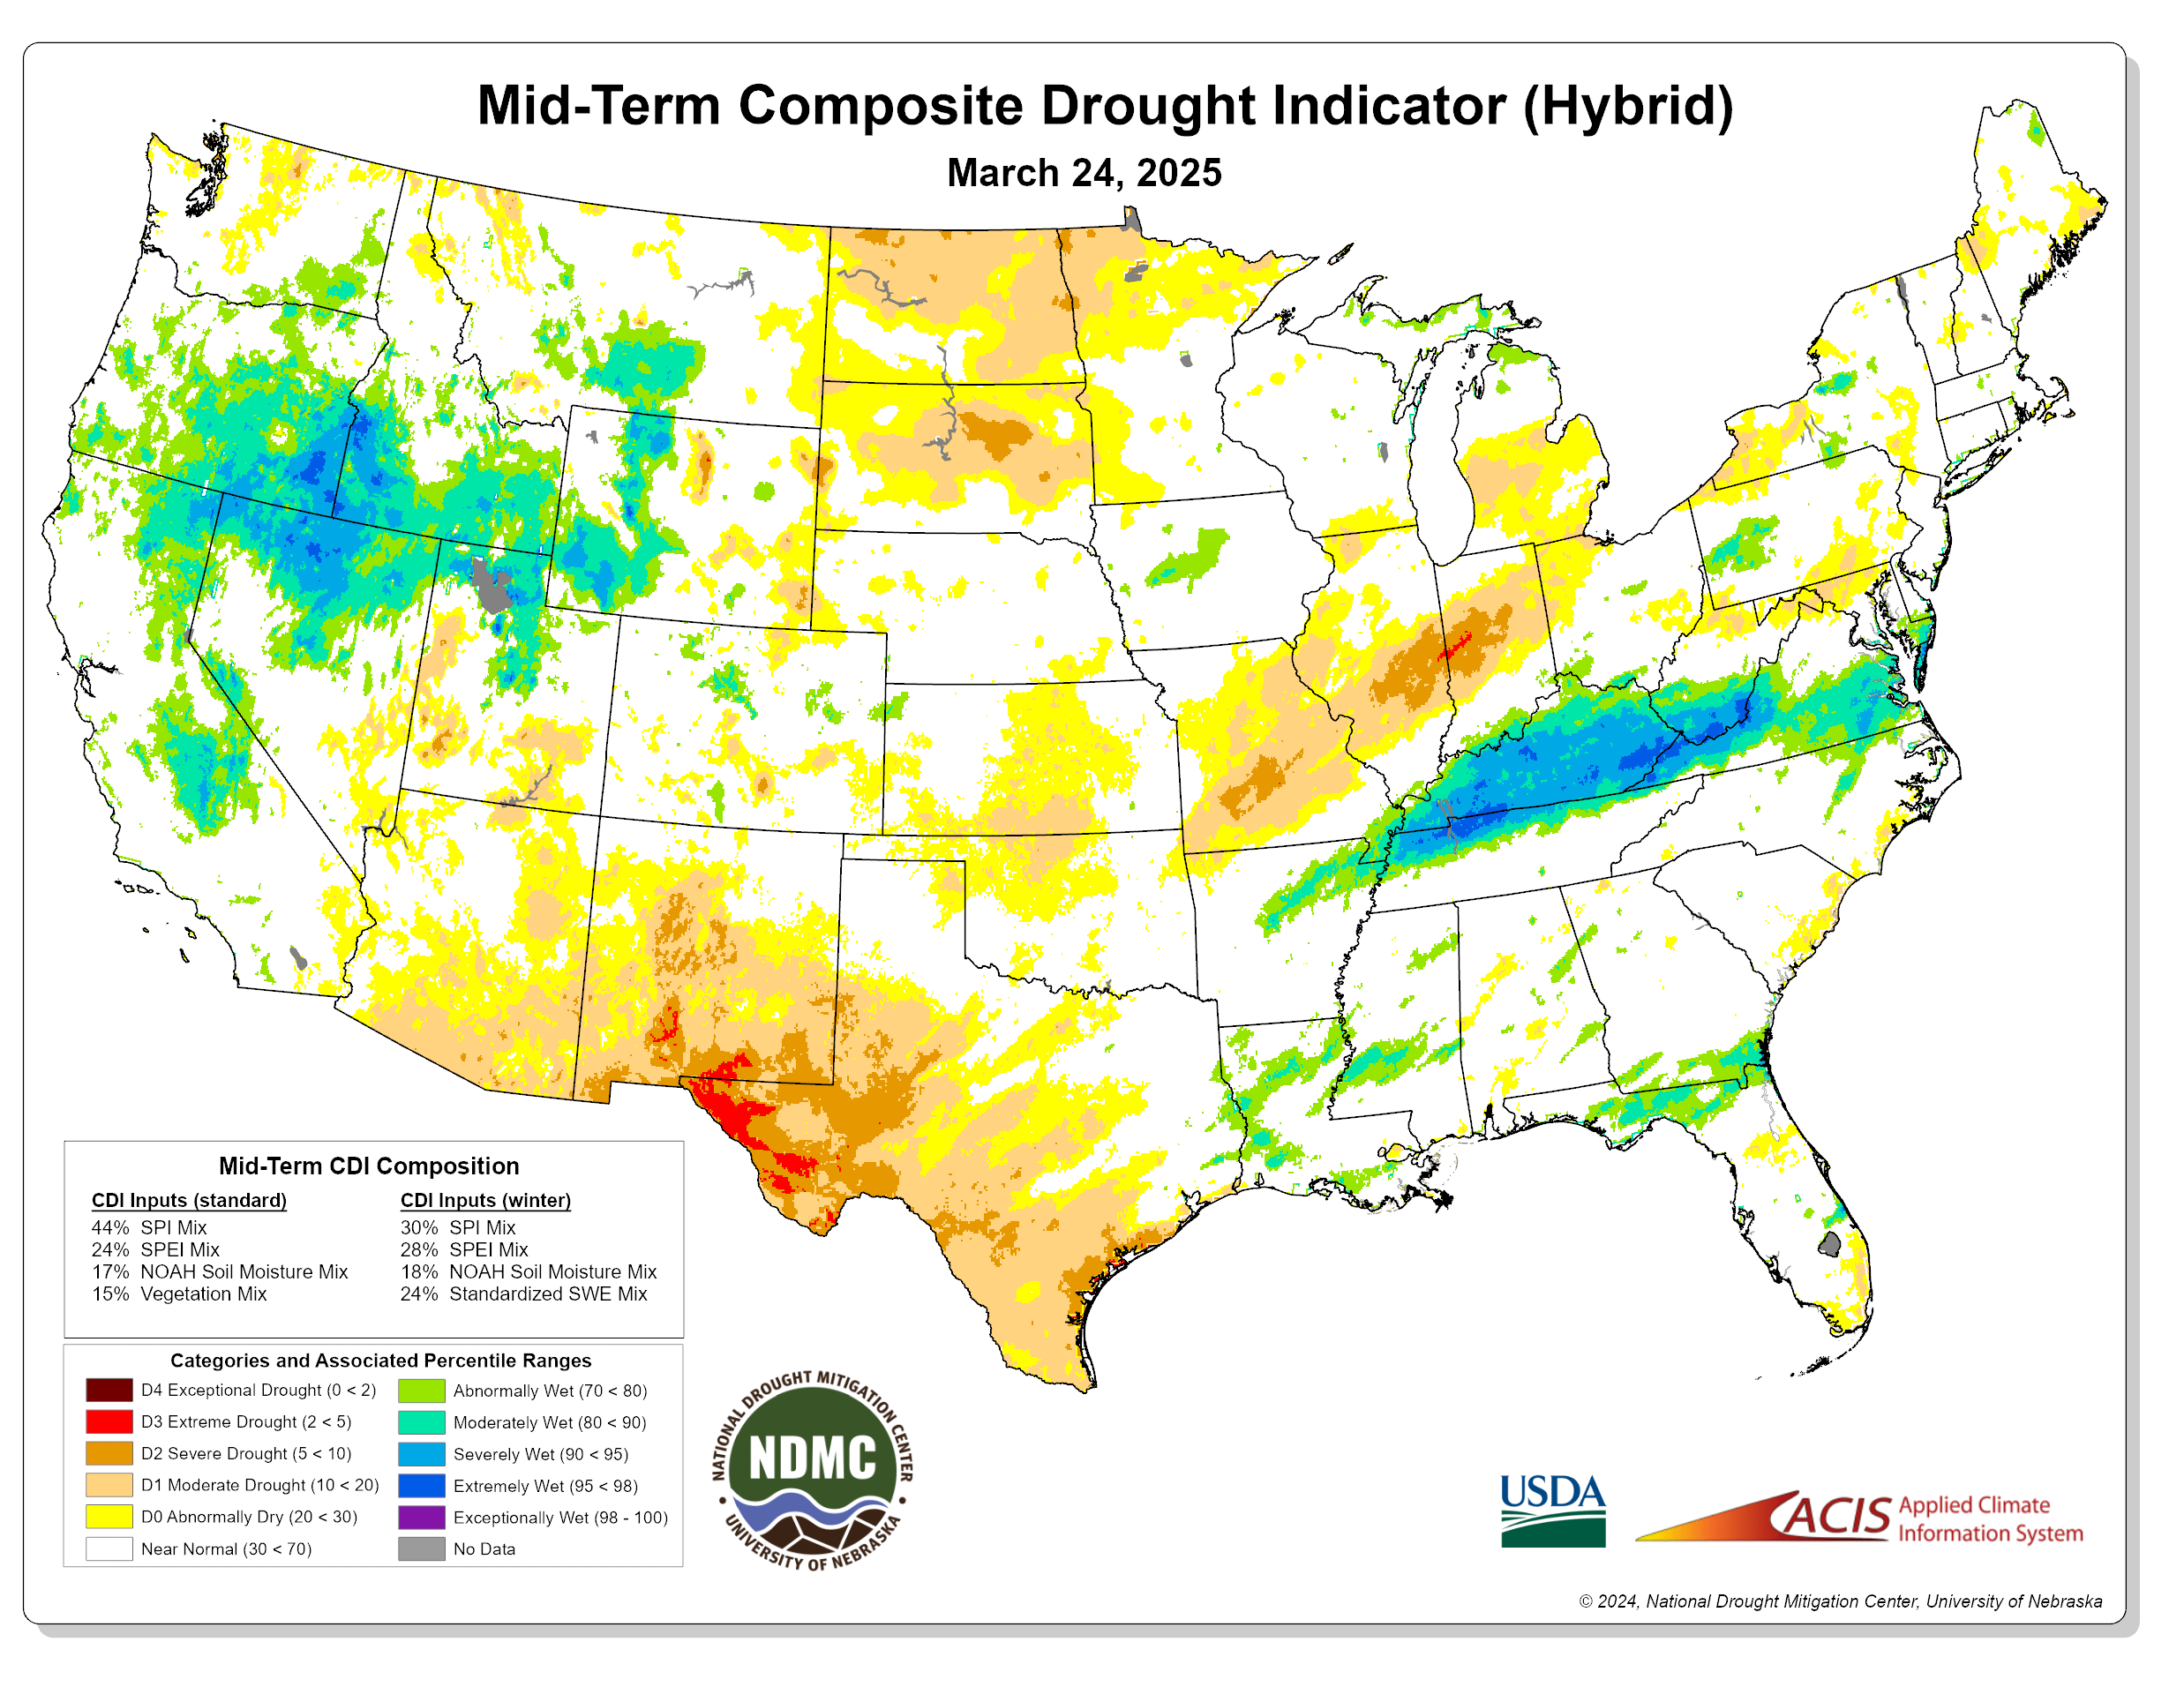
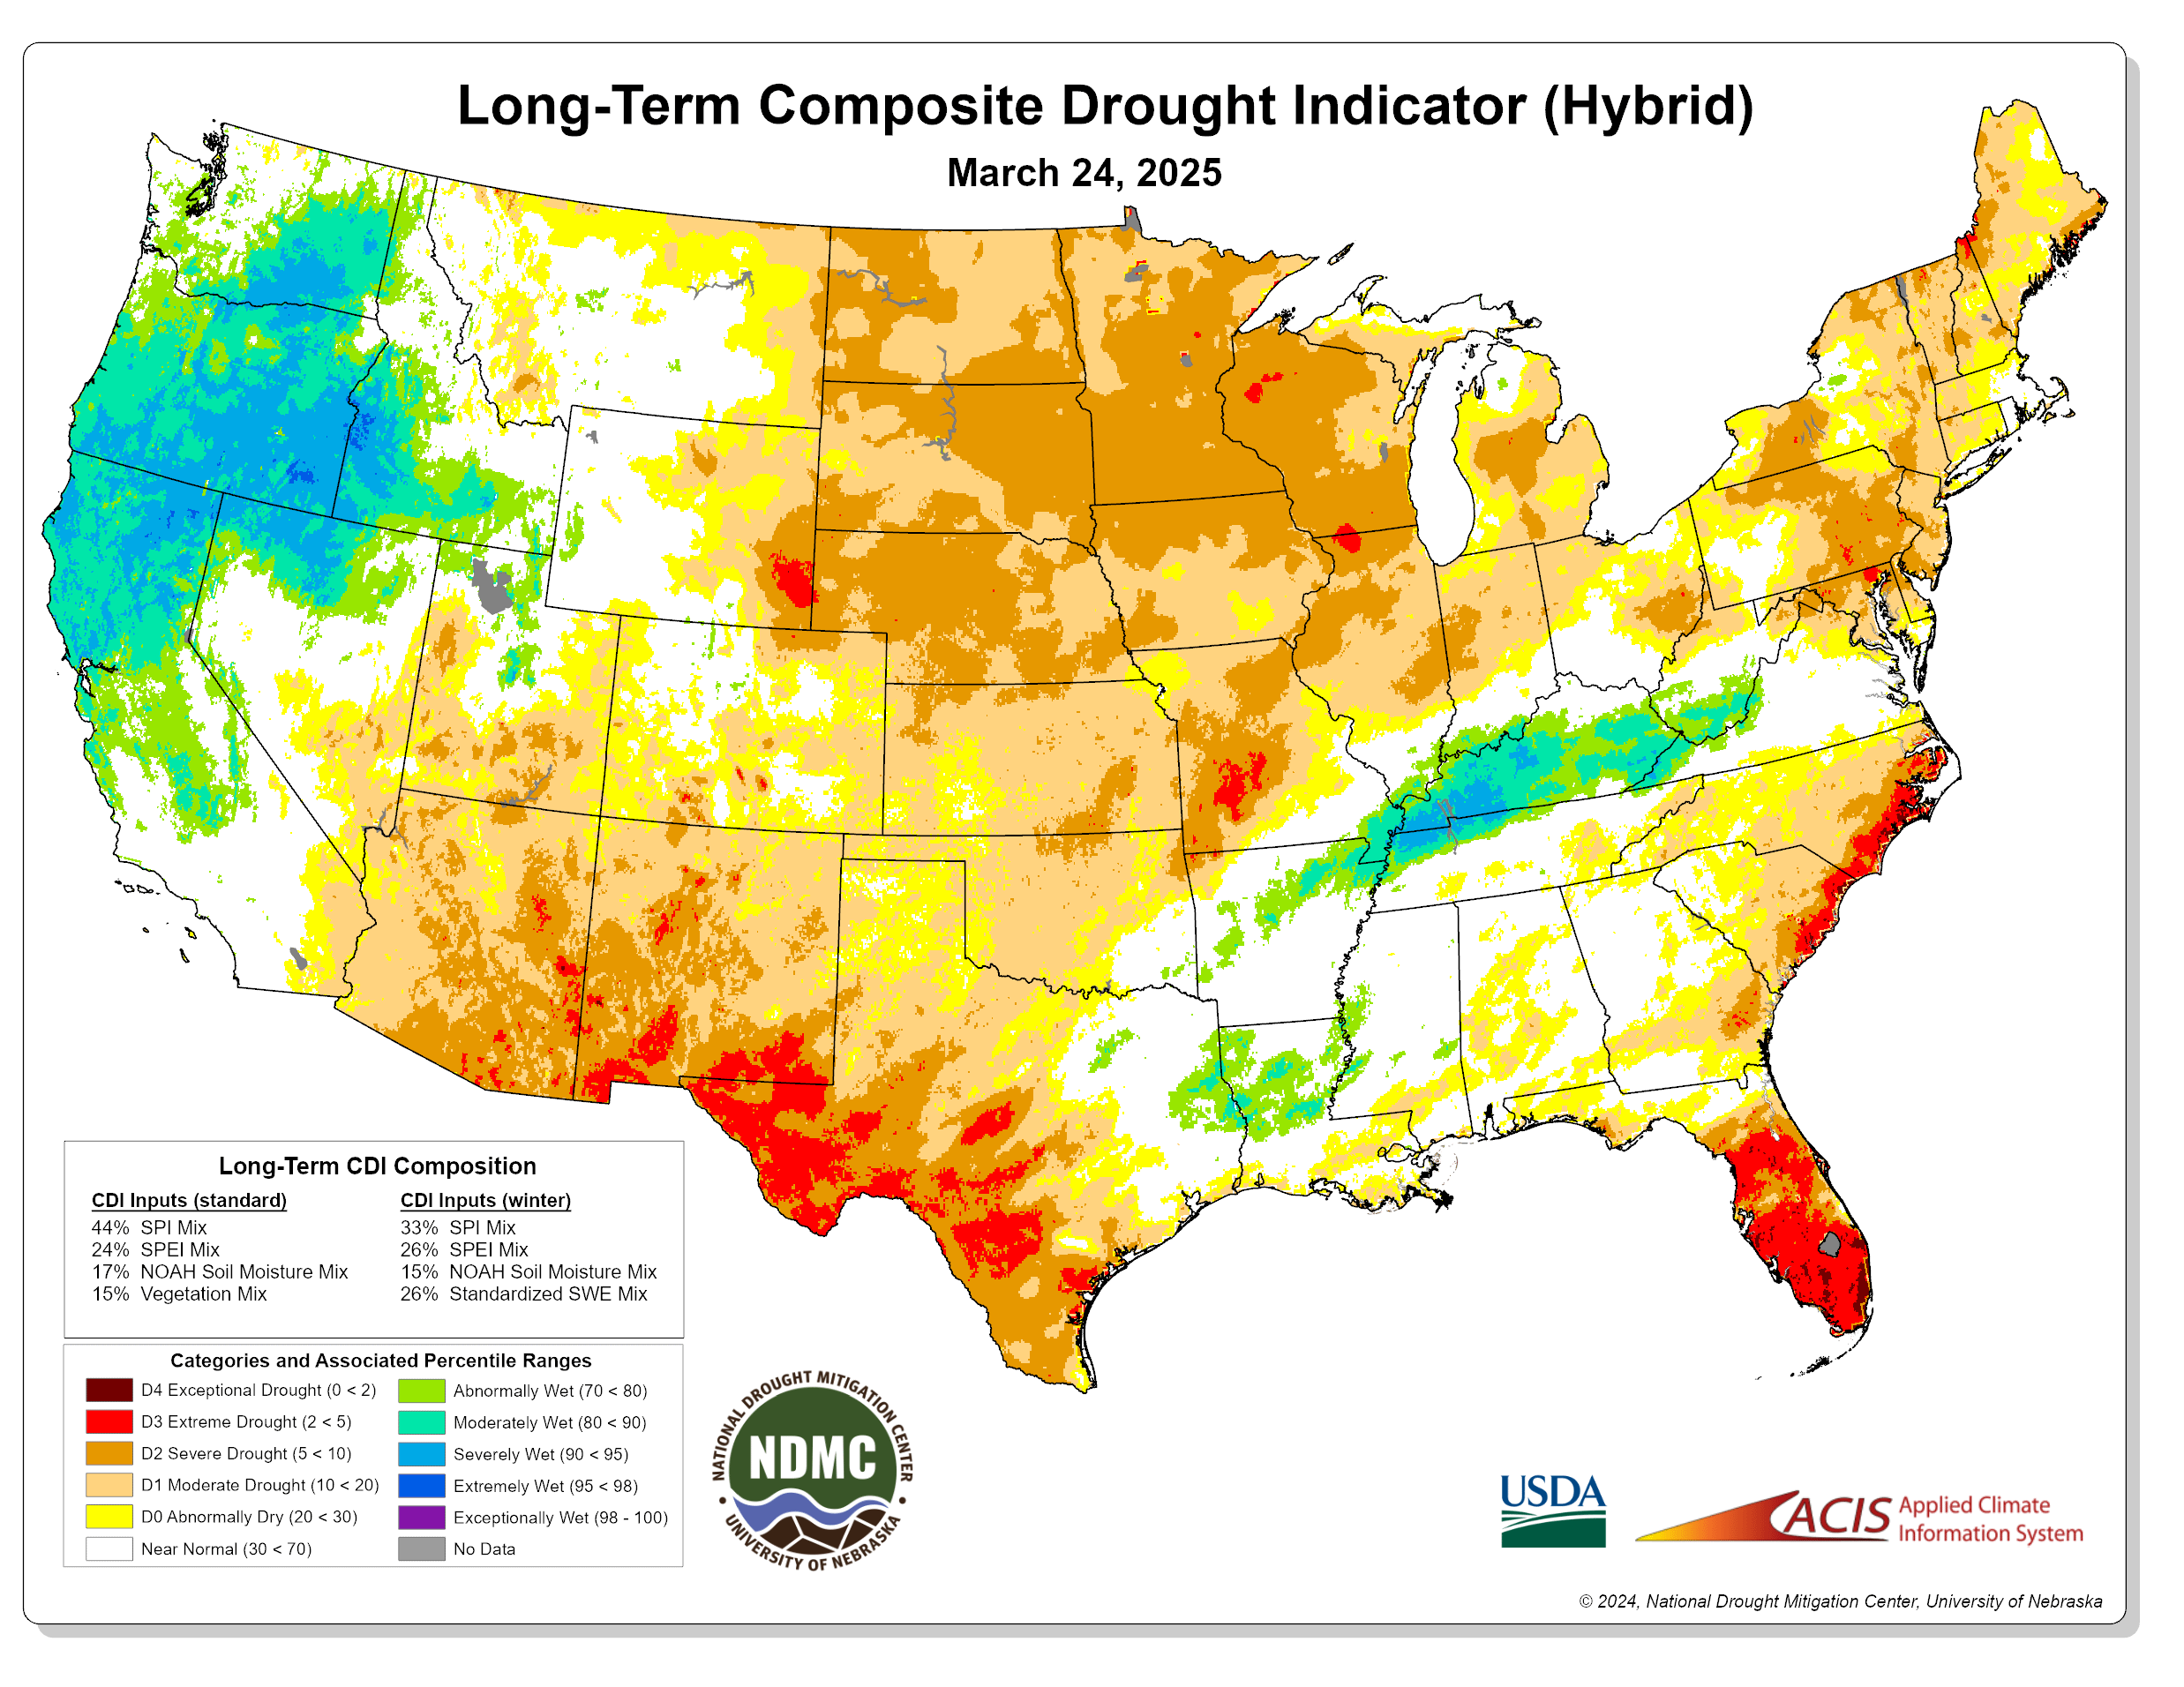
Latest Drought Conditions
|
NDMC Composite Drought Indicator
|
||||||||||||||||||||||||||||||||||||||
| Short-Term | Mid-Term | Long-Term | ||||||||||||||||||||||||||||||||||||
 |
 |
 |
||||||||||||||||||||||||||||||||||||
|
||||||||||||||||||||||||||||||||||||||
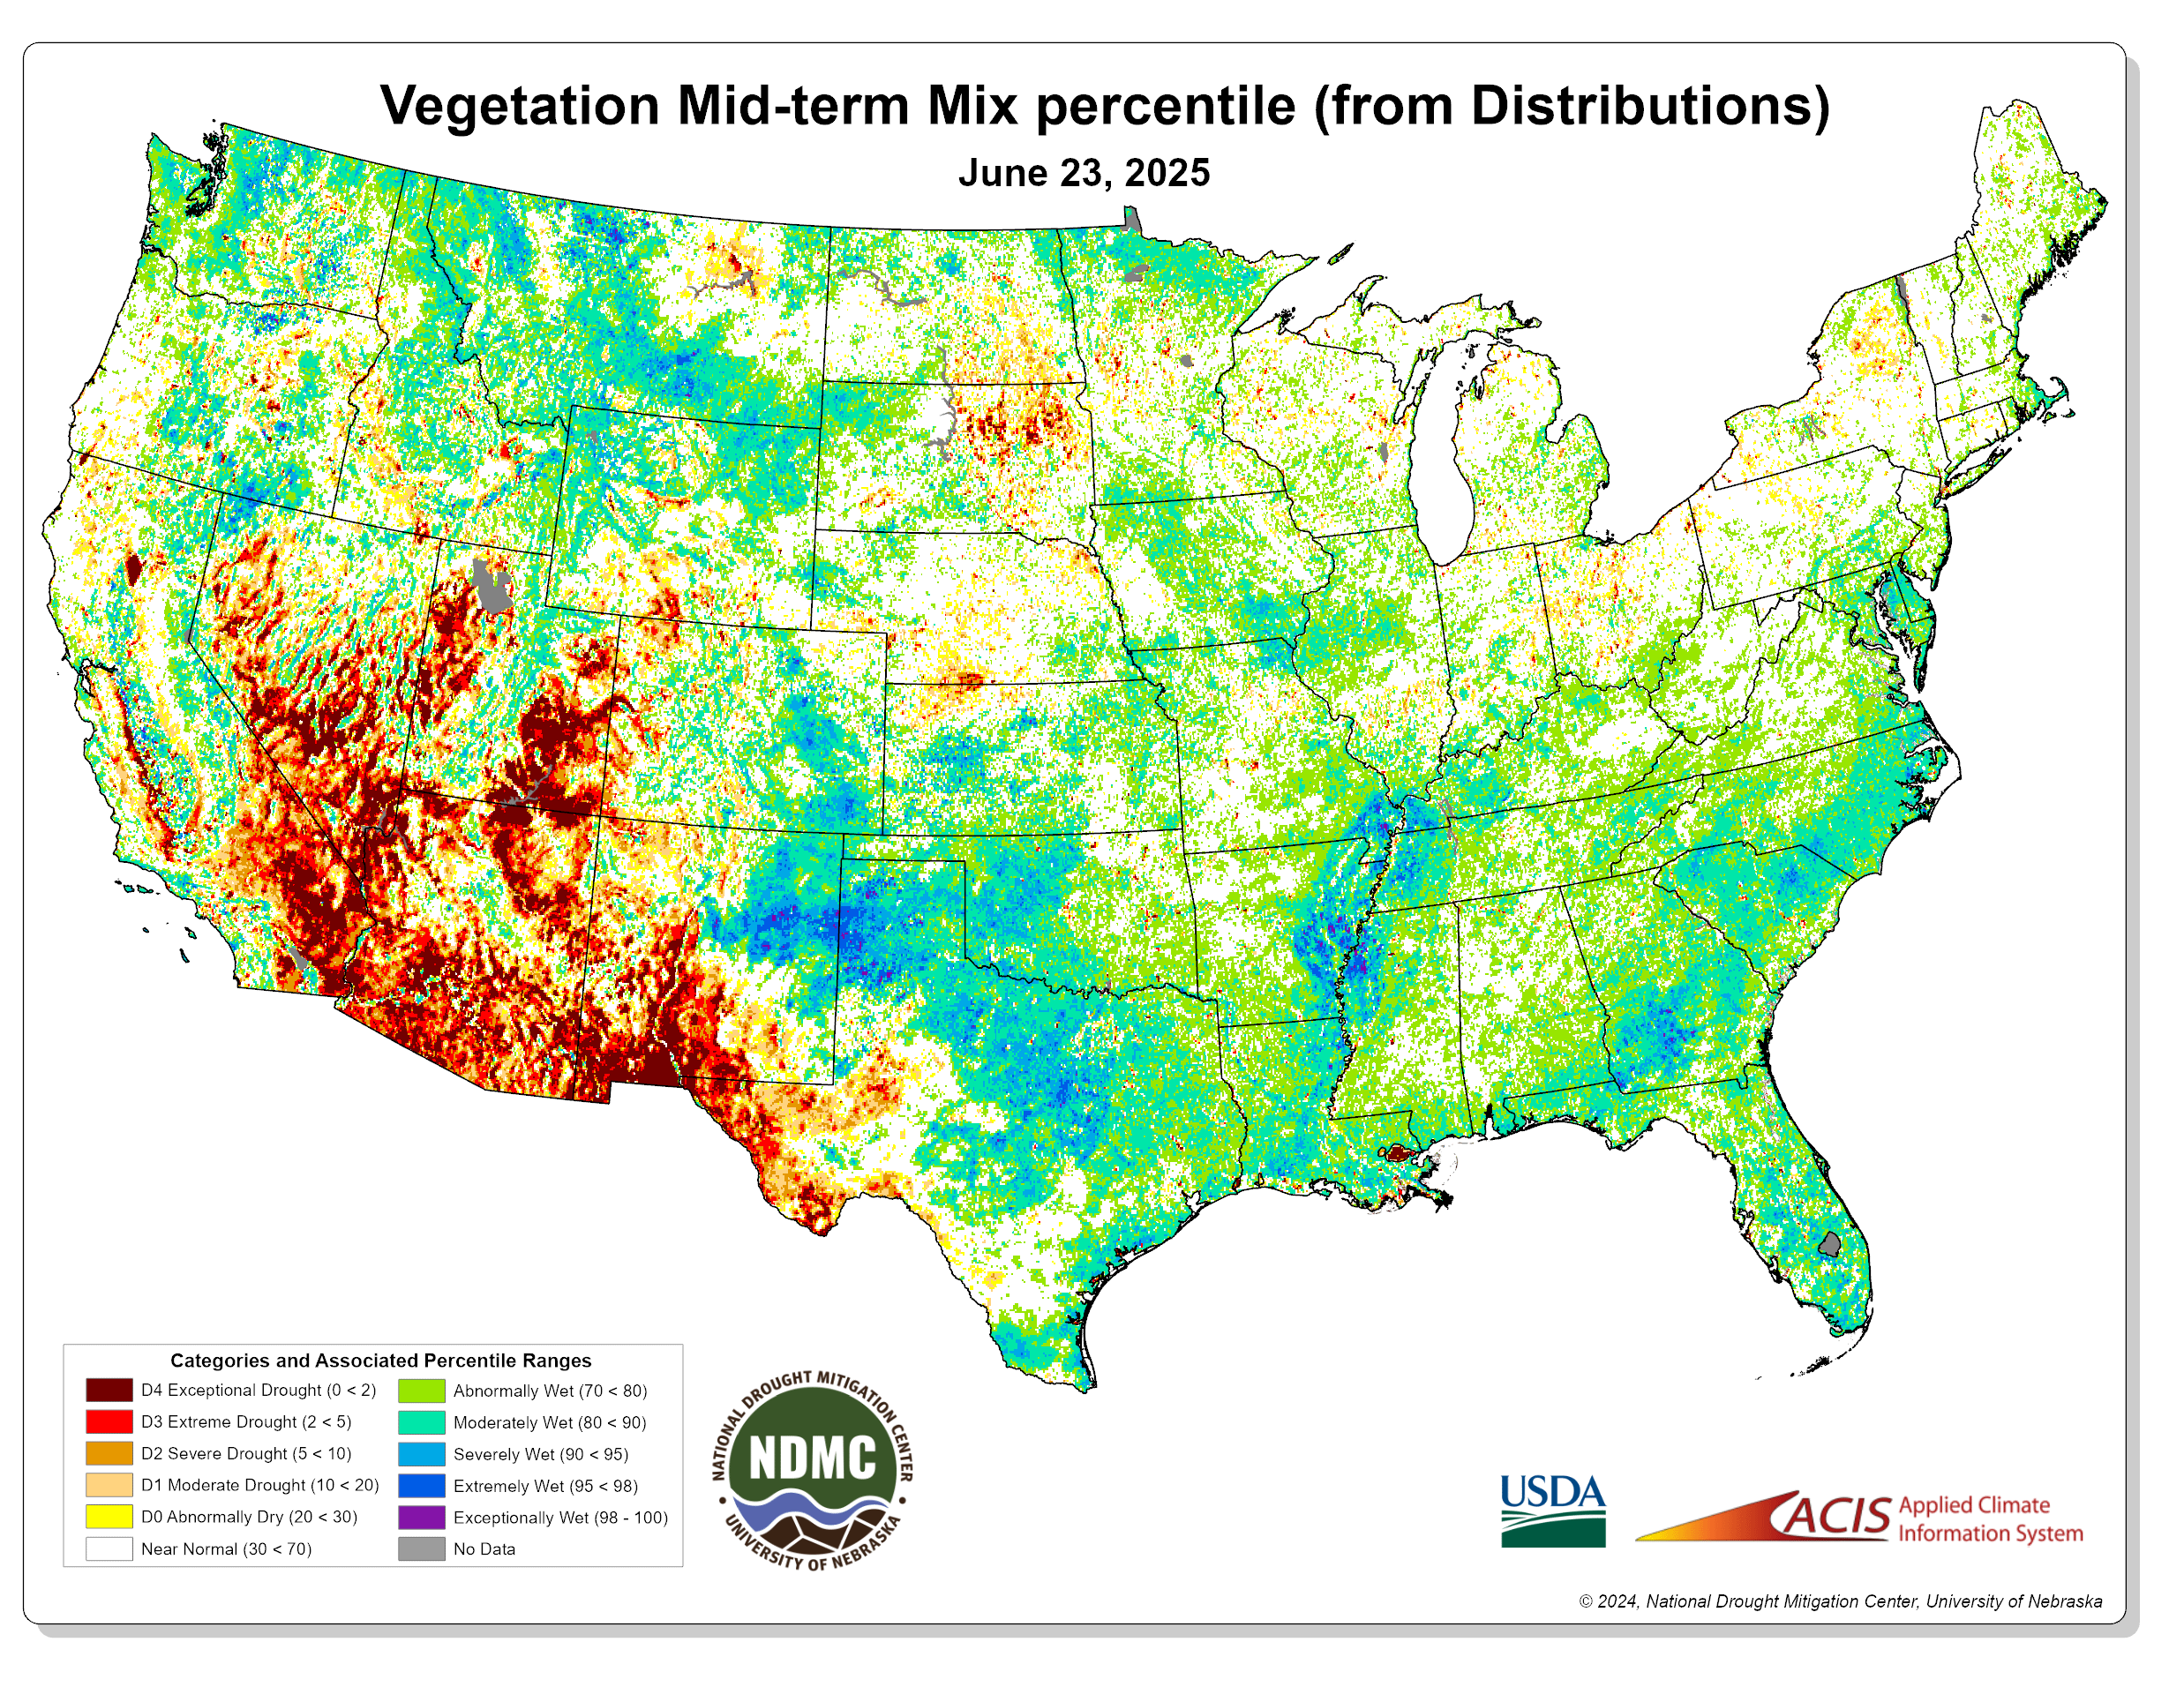
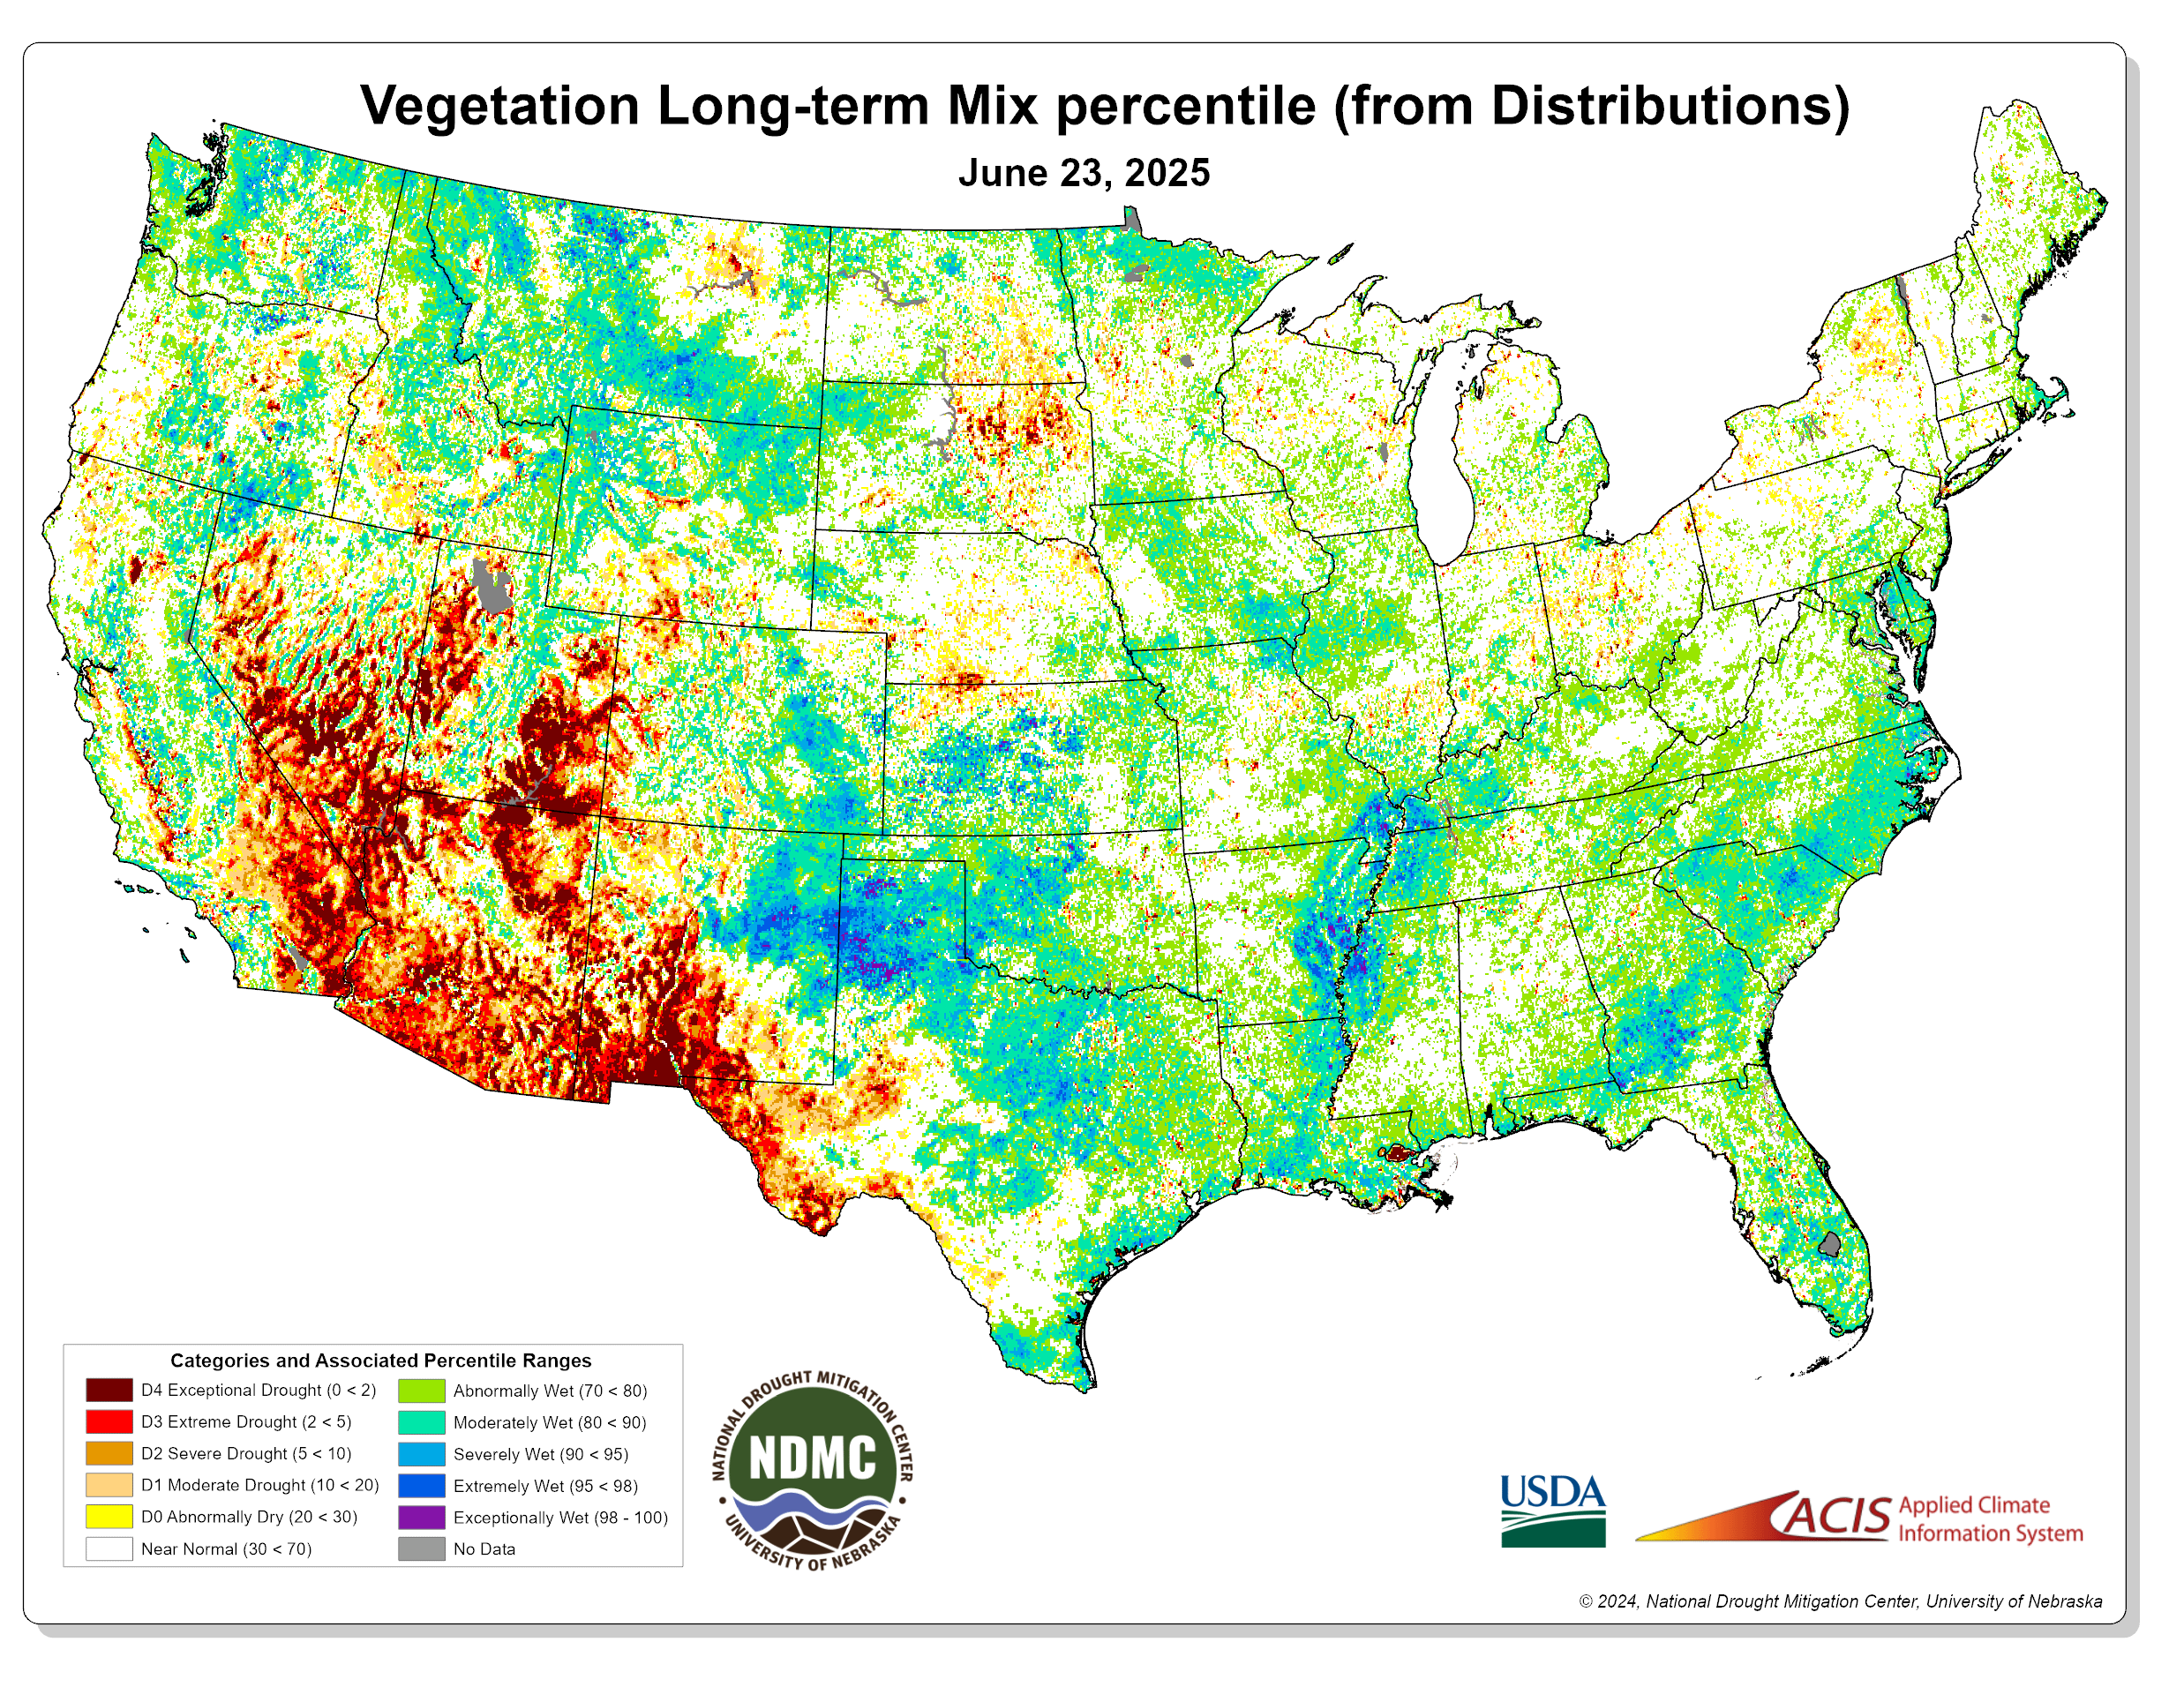
| Vegetation Drought Response Index (VegDRI) |
 |
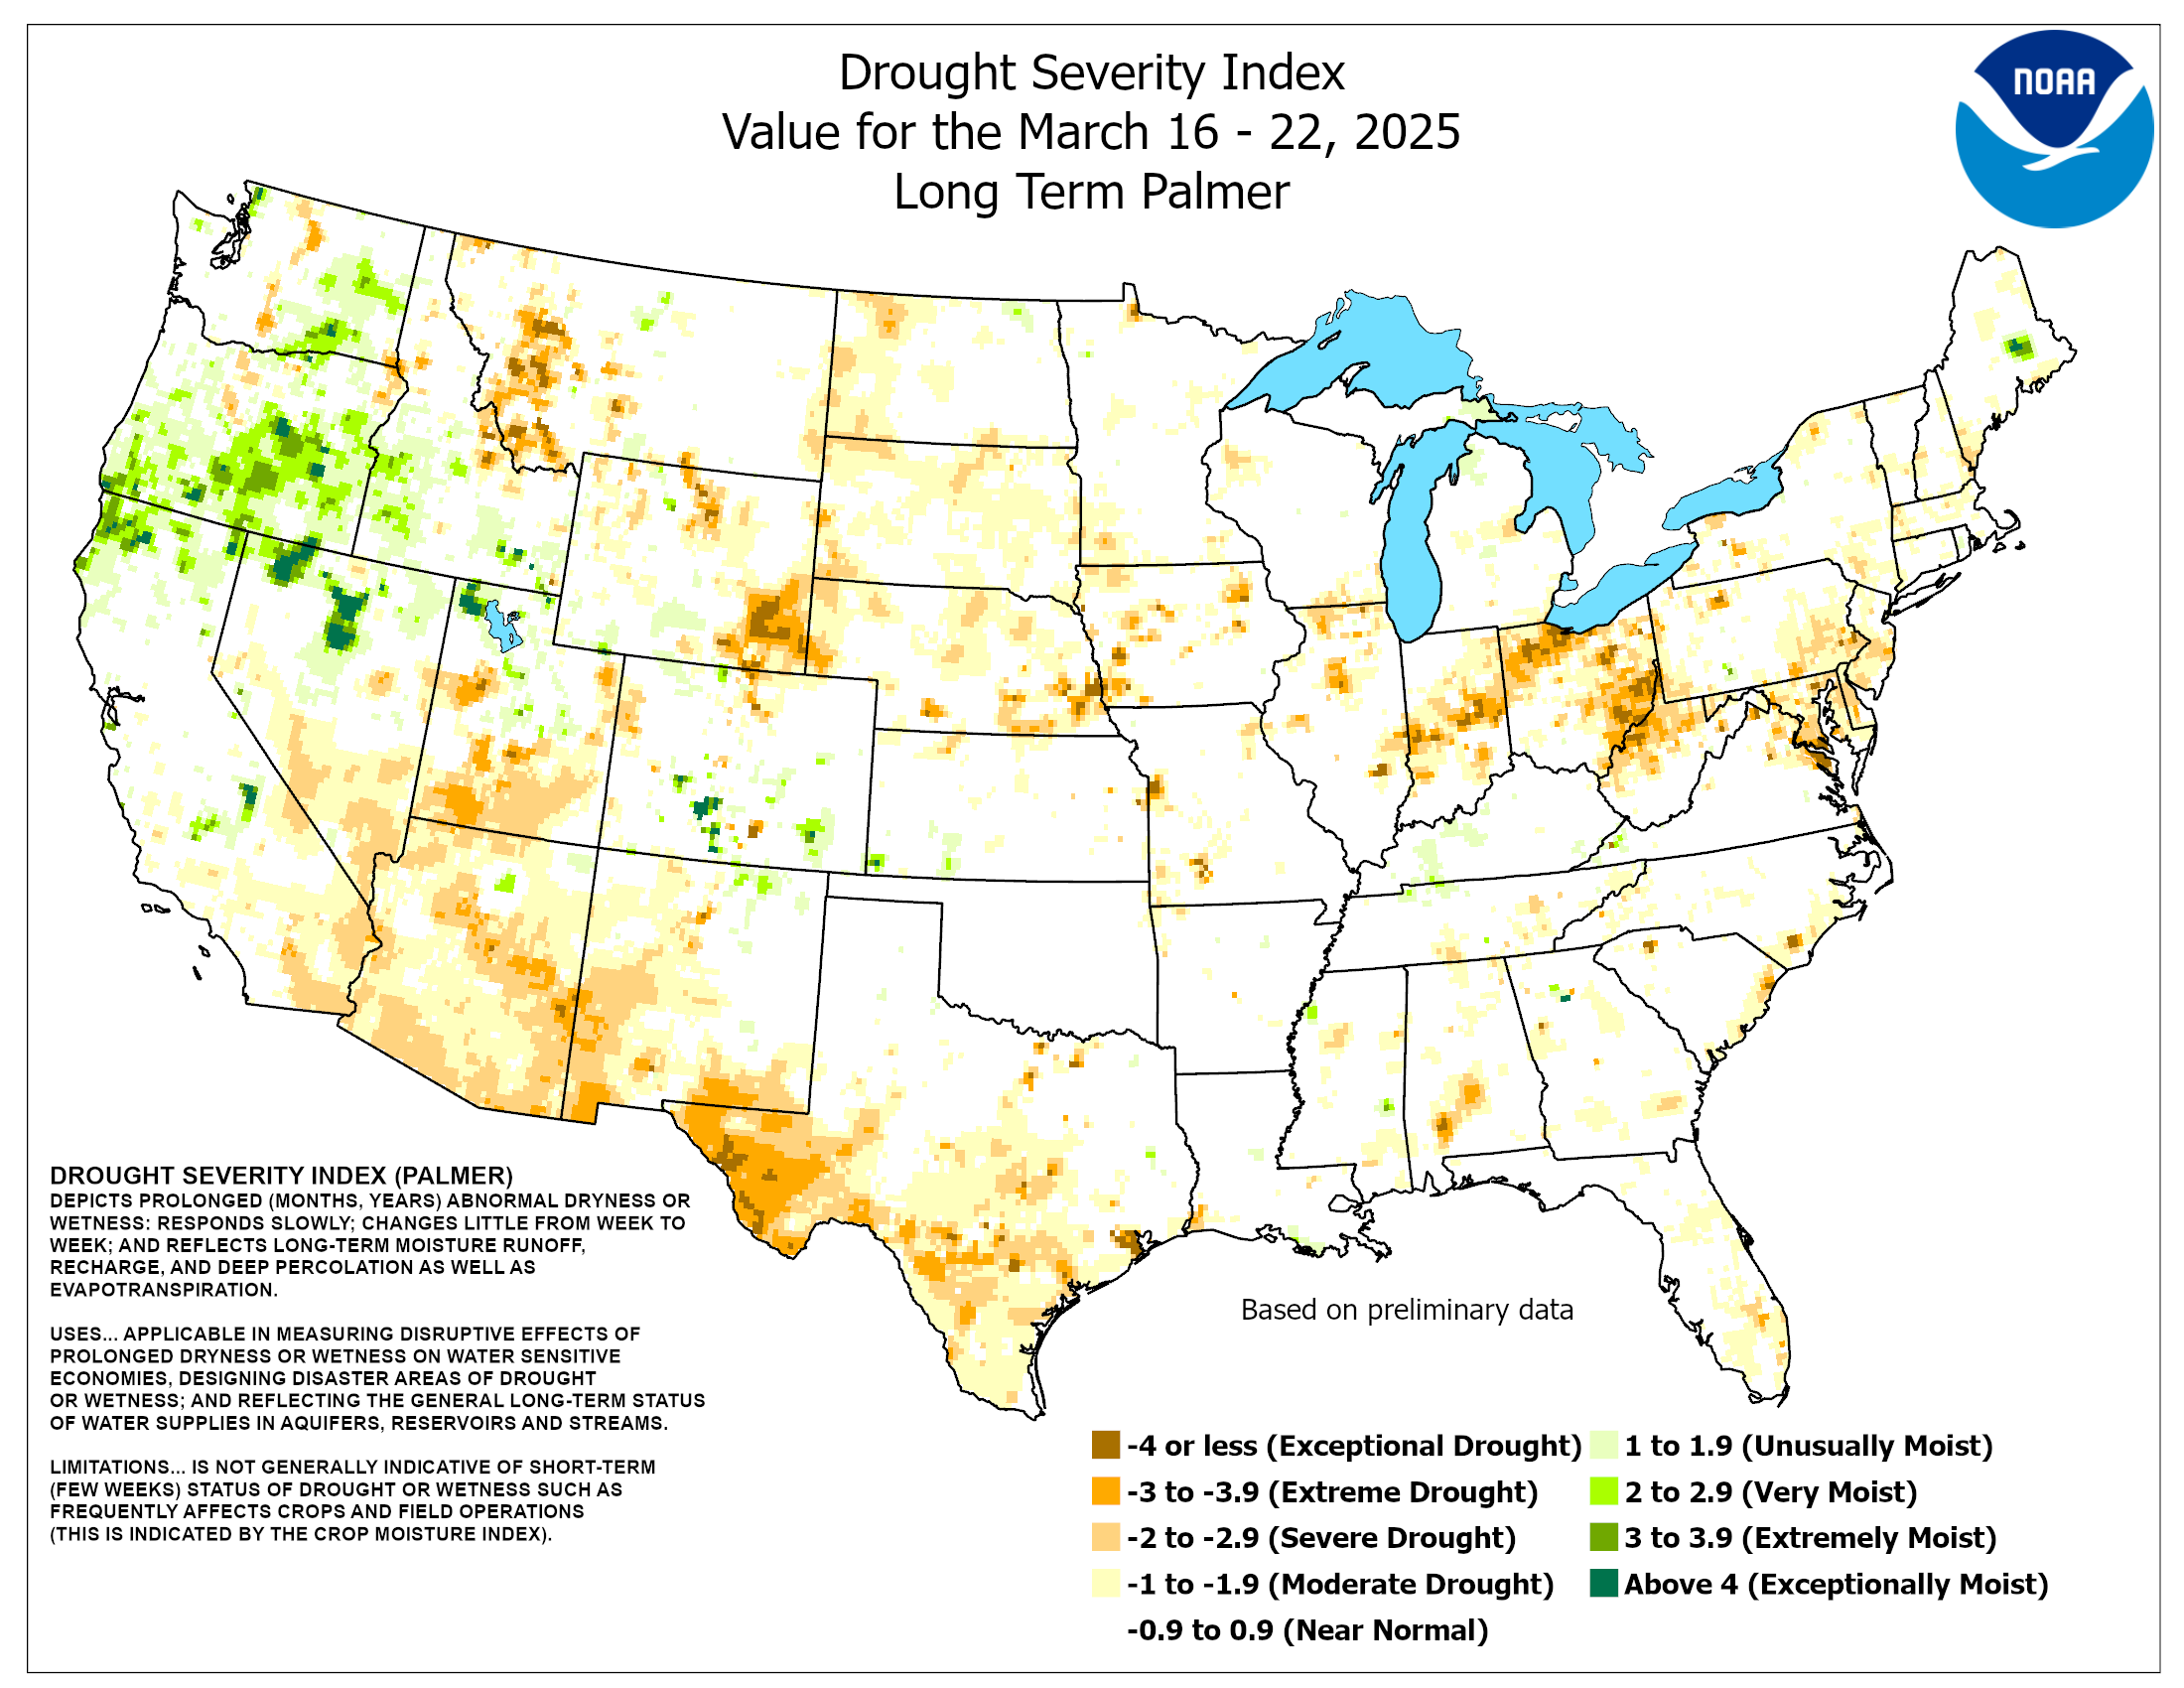
| Palmer Drought Severity Index Definition |
|
| Drought Severity Index (Long Term Palmer) |
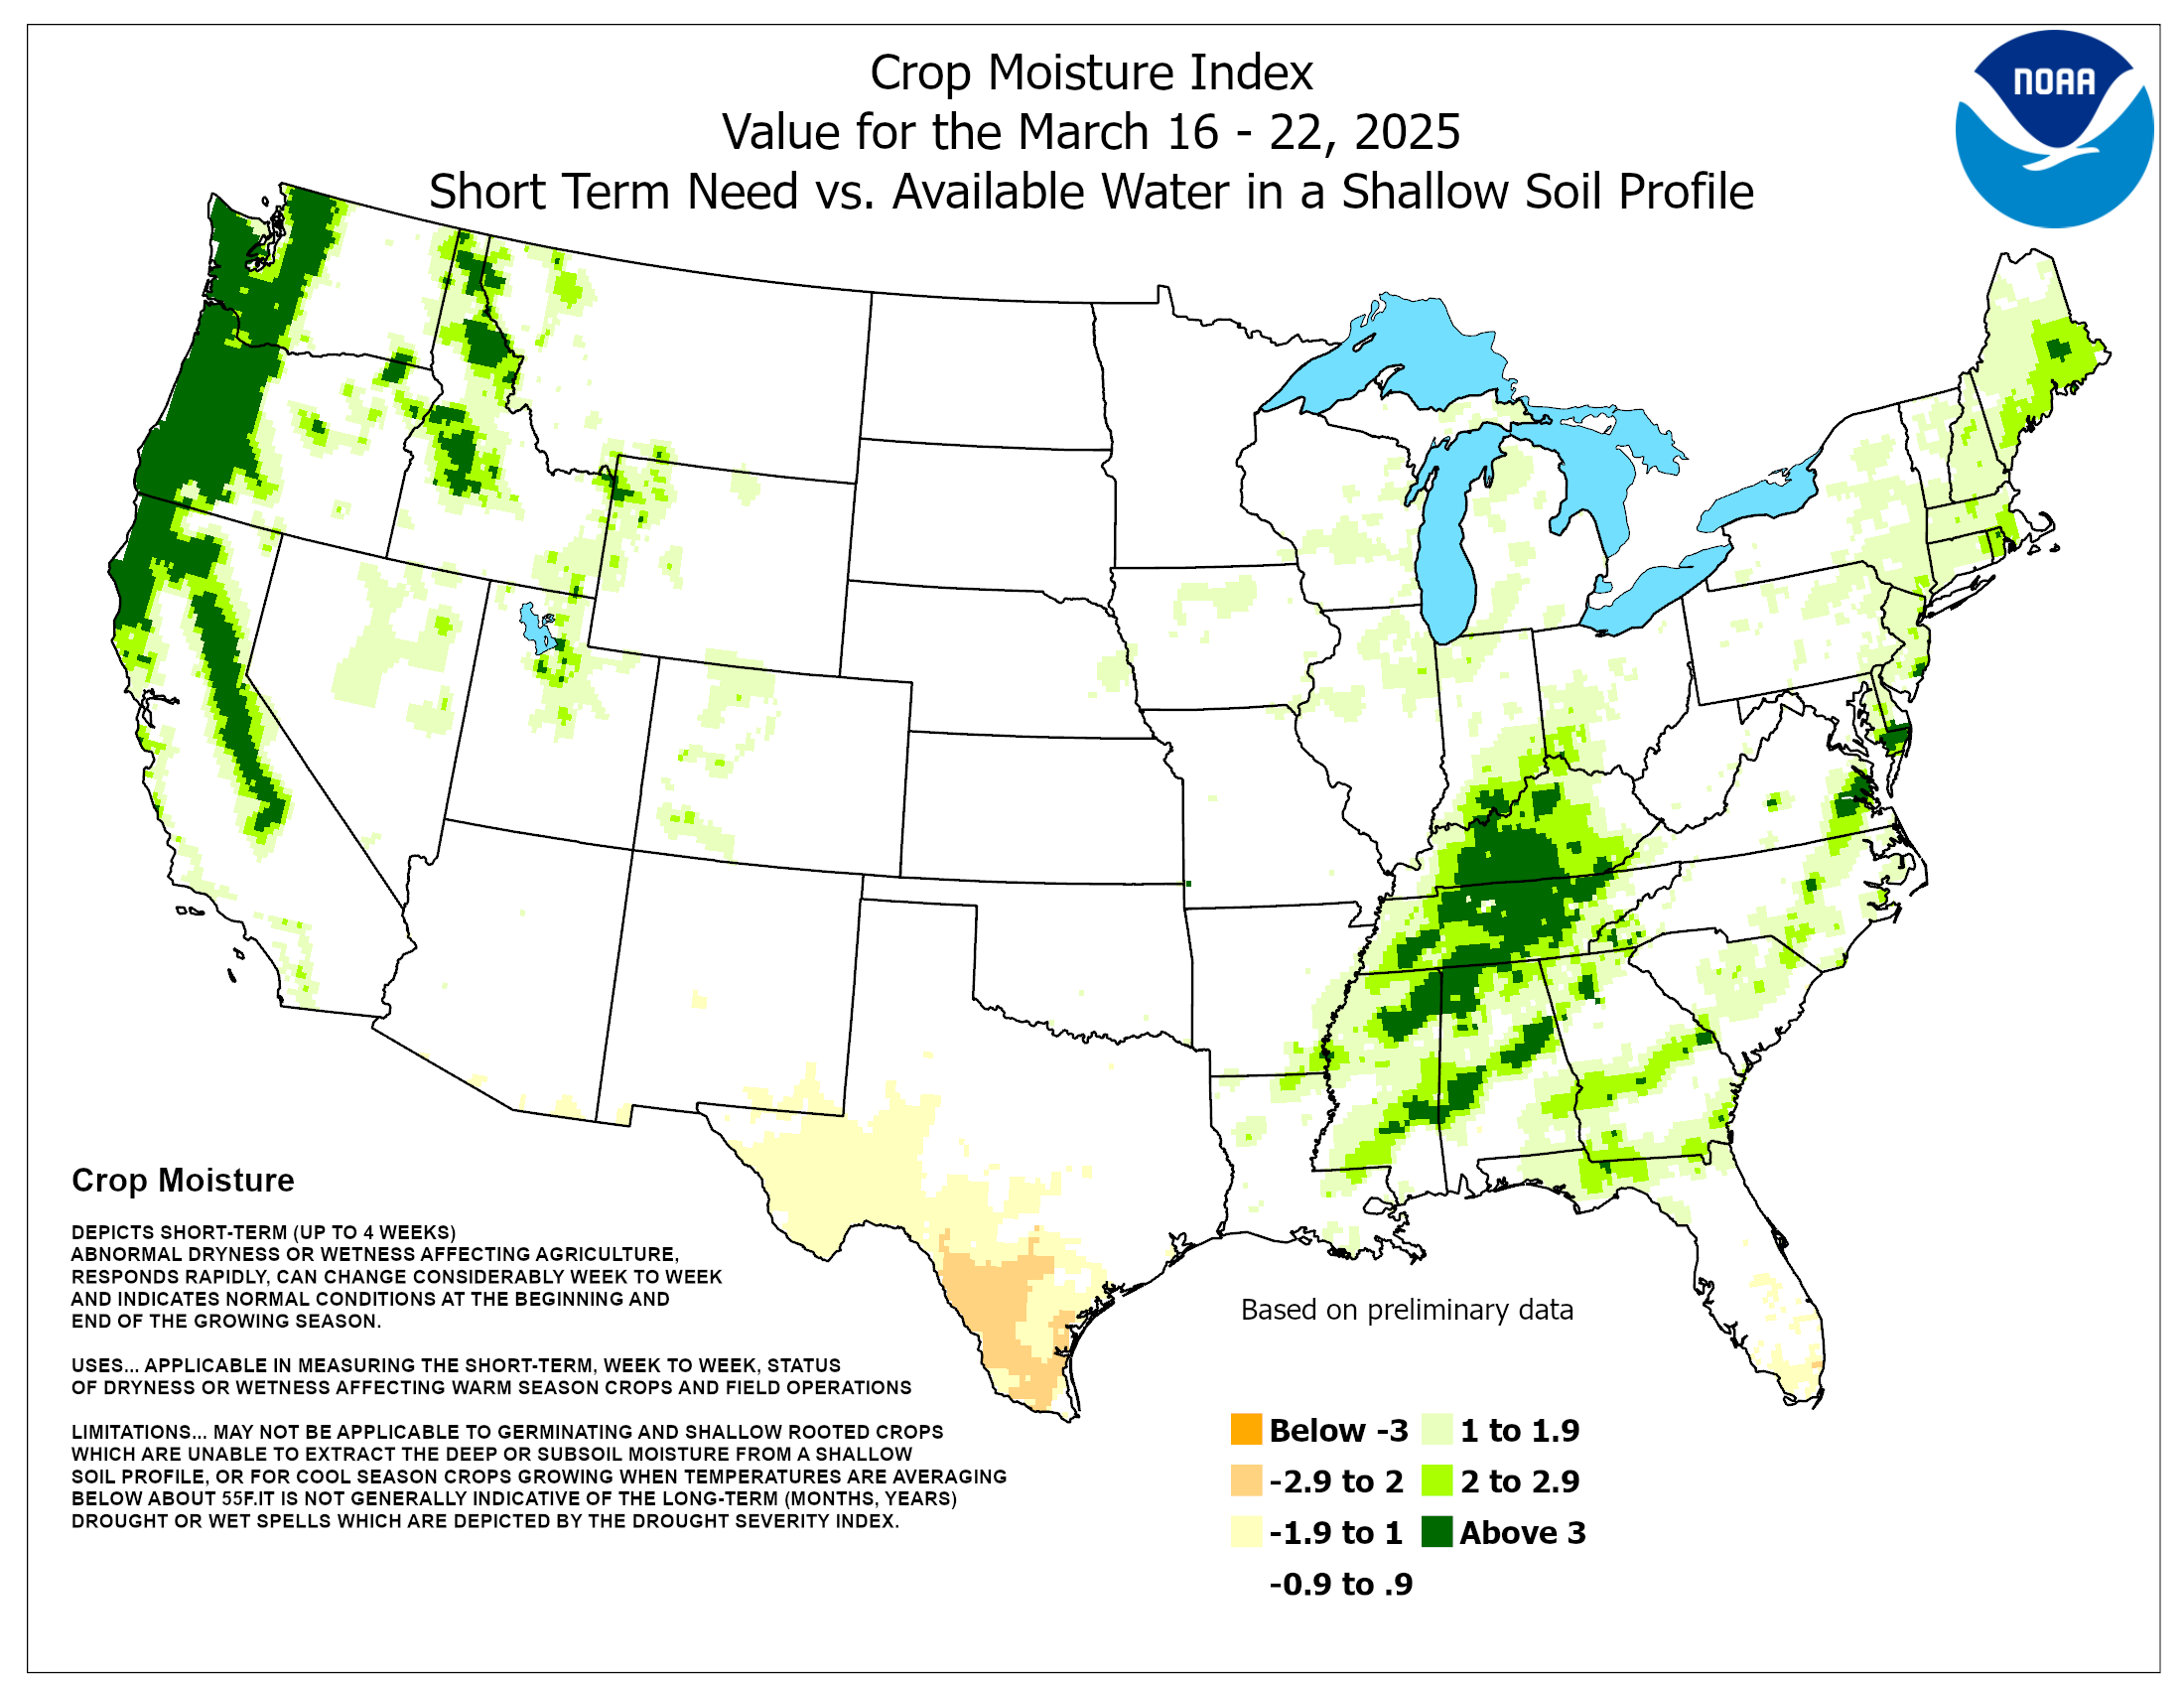
Crop Moisture Index |
 |
 |
Resources
Water Resources
| Maps of Monthly streamflow compared to historical Stream flow for the month of the year for Michigan | |
| Map | HUC Map |
 |
|
 |
|
Resources
Snow
| NOHRSC Regional Snow Analyses | ||
| Snow Water Equivalent | Snow Depth | Average Snowpack Temp |
 |
 |
 |
|
|
||
| SWE Change | Snow Precipitation | Snow Melt |
 |
 |
 |
|
|
||
| Blowing Snow Sublimation | Surface Sublimation | Non-Snow Precipitation |
 |
 |
 |
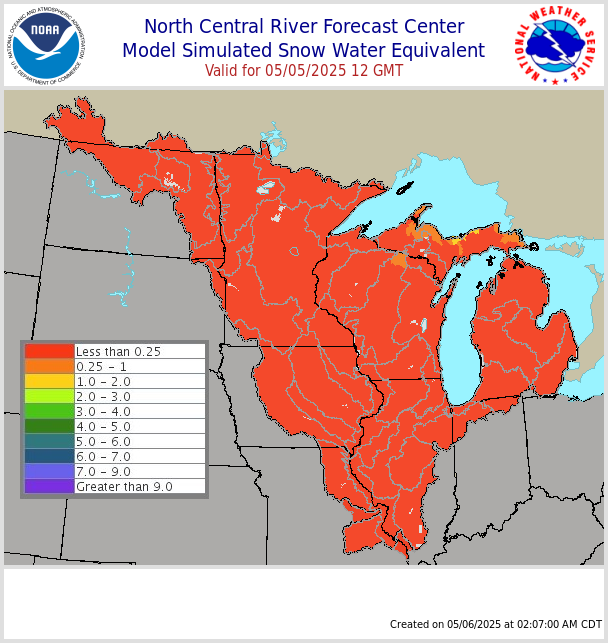
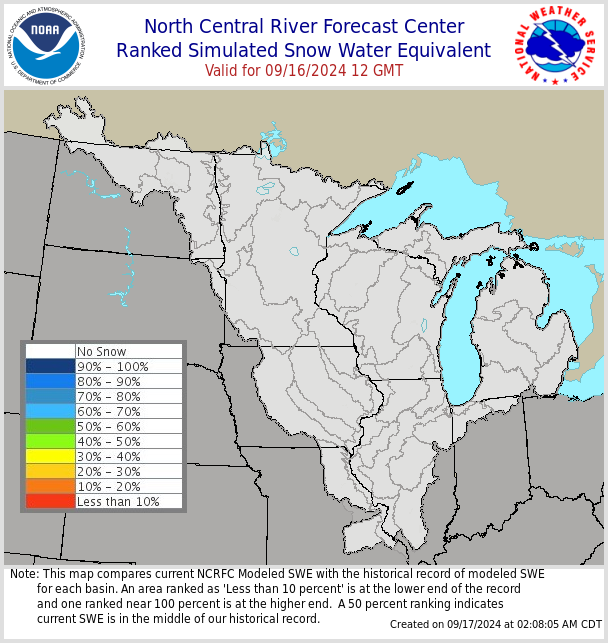
| NWS North Central River Forecast Center Modeled Snow Water Equivalent | ||
| Simulated SWE | SWE Percentile | |
 |
 |
|
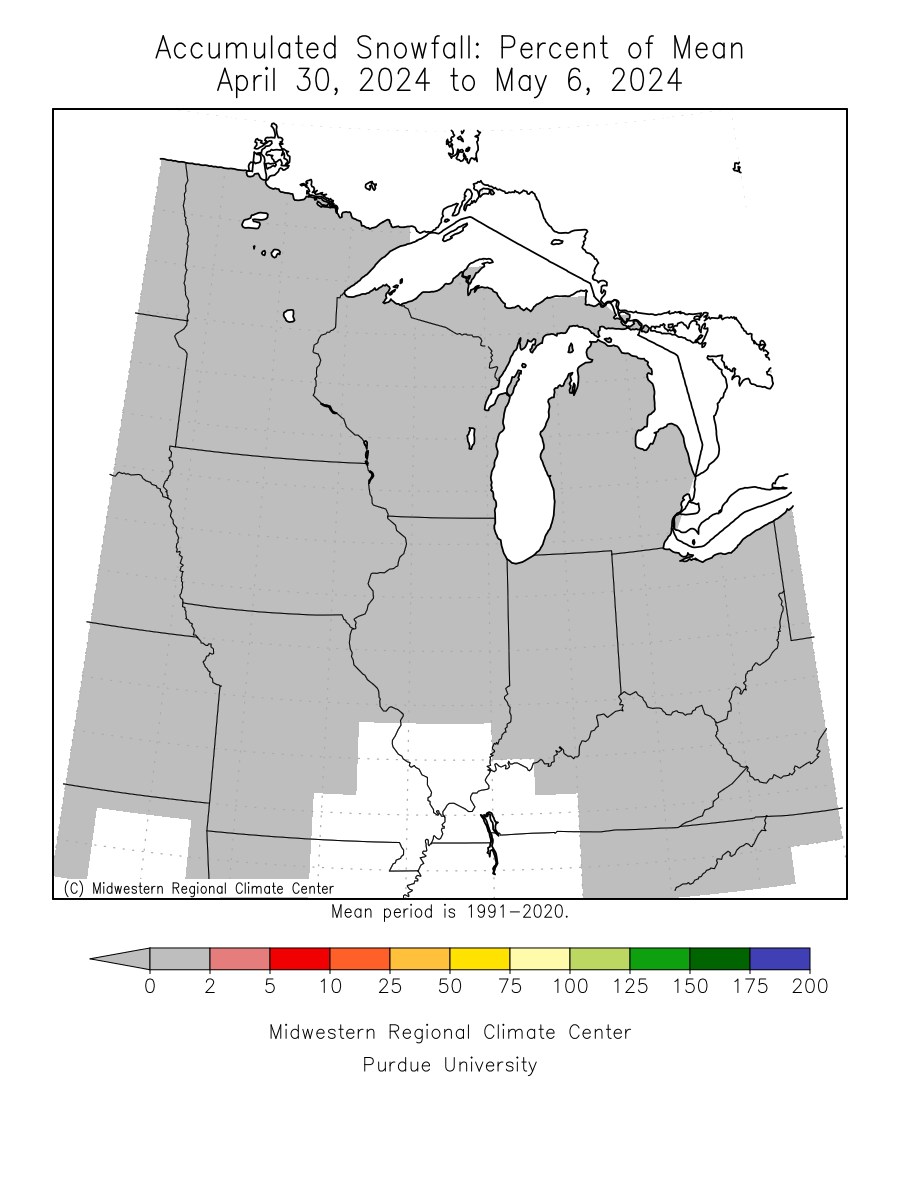
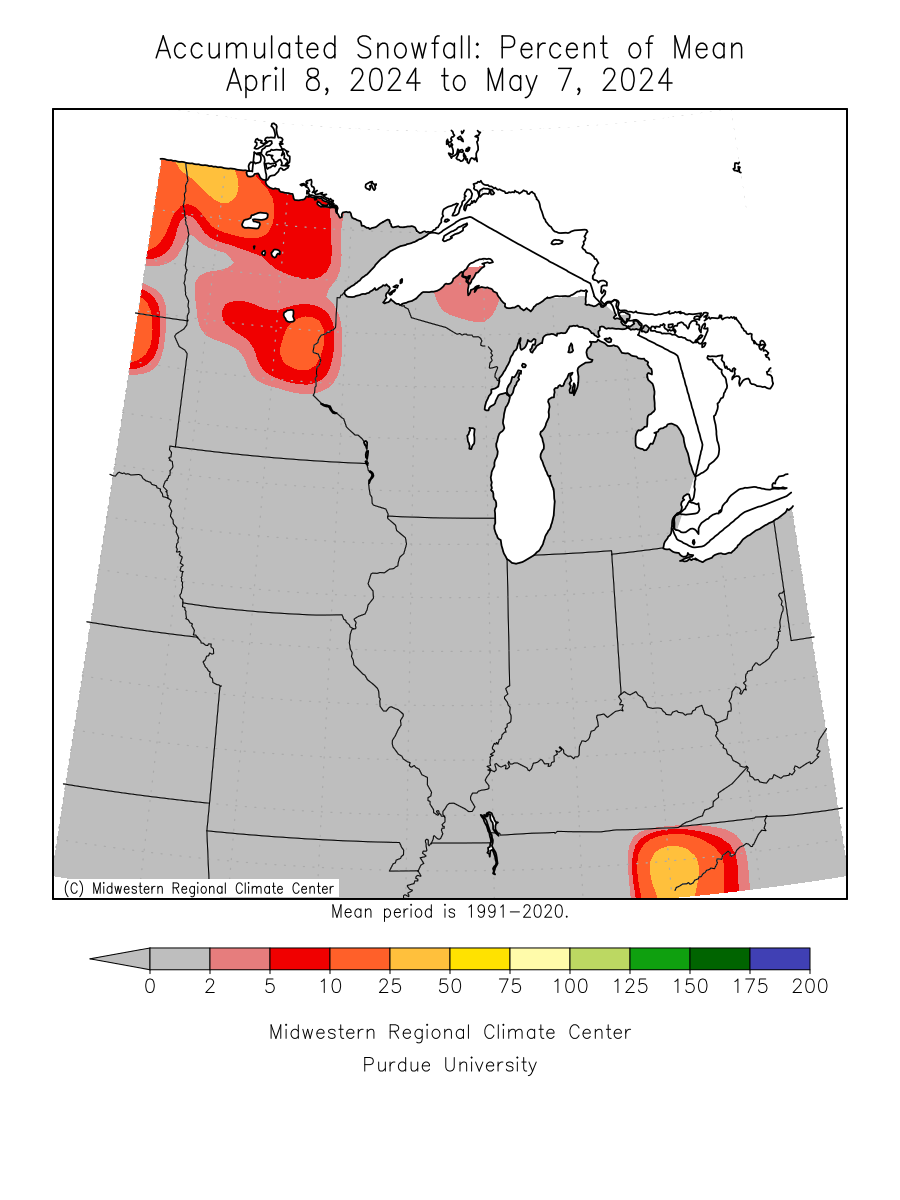
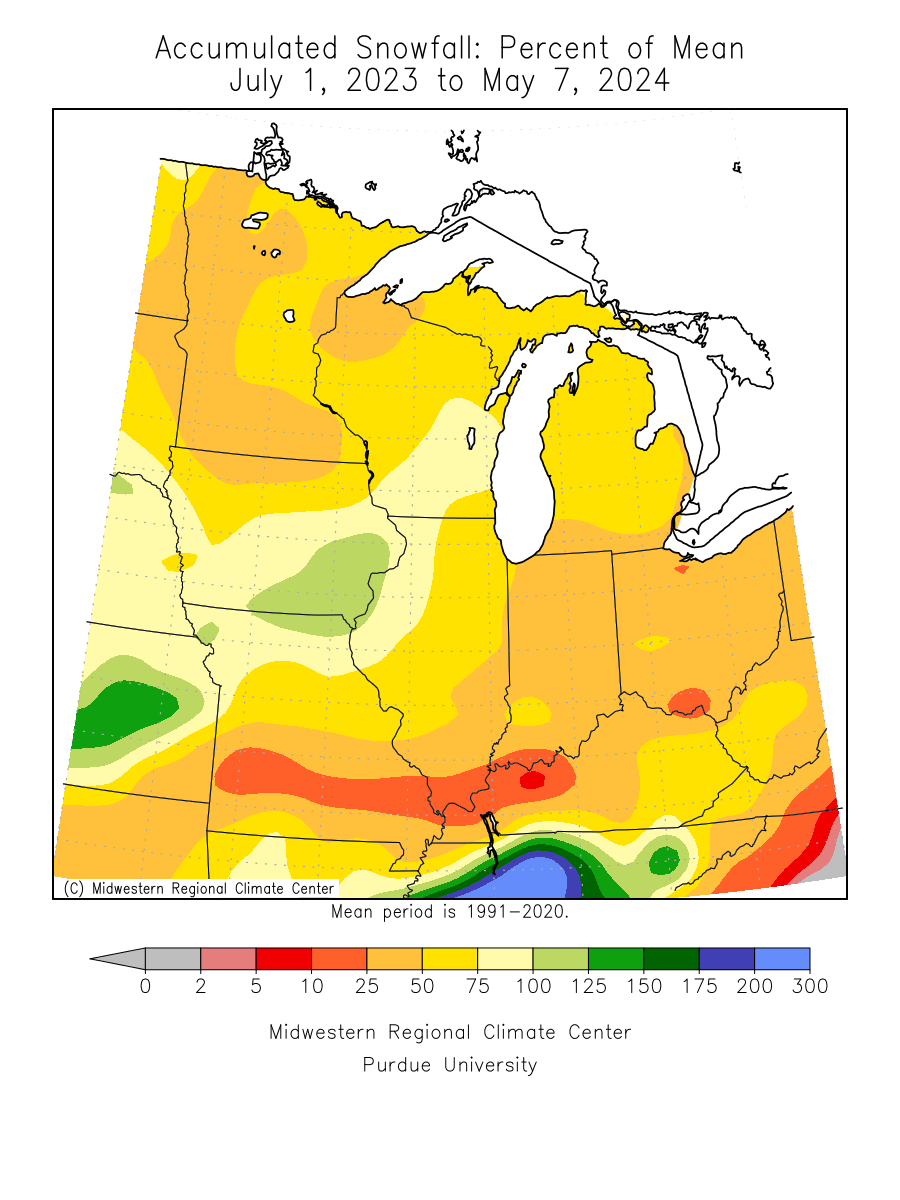
| MRCC Climate Watch Accumulated Snowfall Percent of Mean | ||
| 7 Day | 30 Day | Seasonal |
 |
 |
 |
Resources
Forecasts & Outlooks
| WPC 7-Day Quantitative Precipitation Forecast (QPF) | |
 |
|
|
|
|
| CPC 6-10 Day Outlooks | |
| Temperature | Precipitation |
 |
 |
|
|
|
| CPC 8-14 Day Outlooks | |
| Temperature | Precipitation |
 |
 |
|
|
|
| CPC Monthly Outlooks | |
| Temperature | Precipitation |
 |
 |
|
|
|
| CPC Seasonal Outlooks | |
| Temperature | Precipitation |
 |
 |
|
|
|
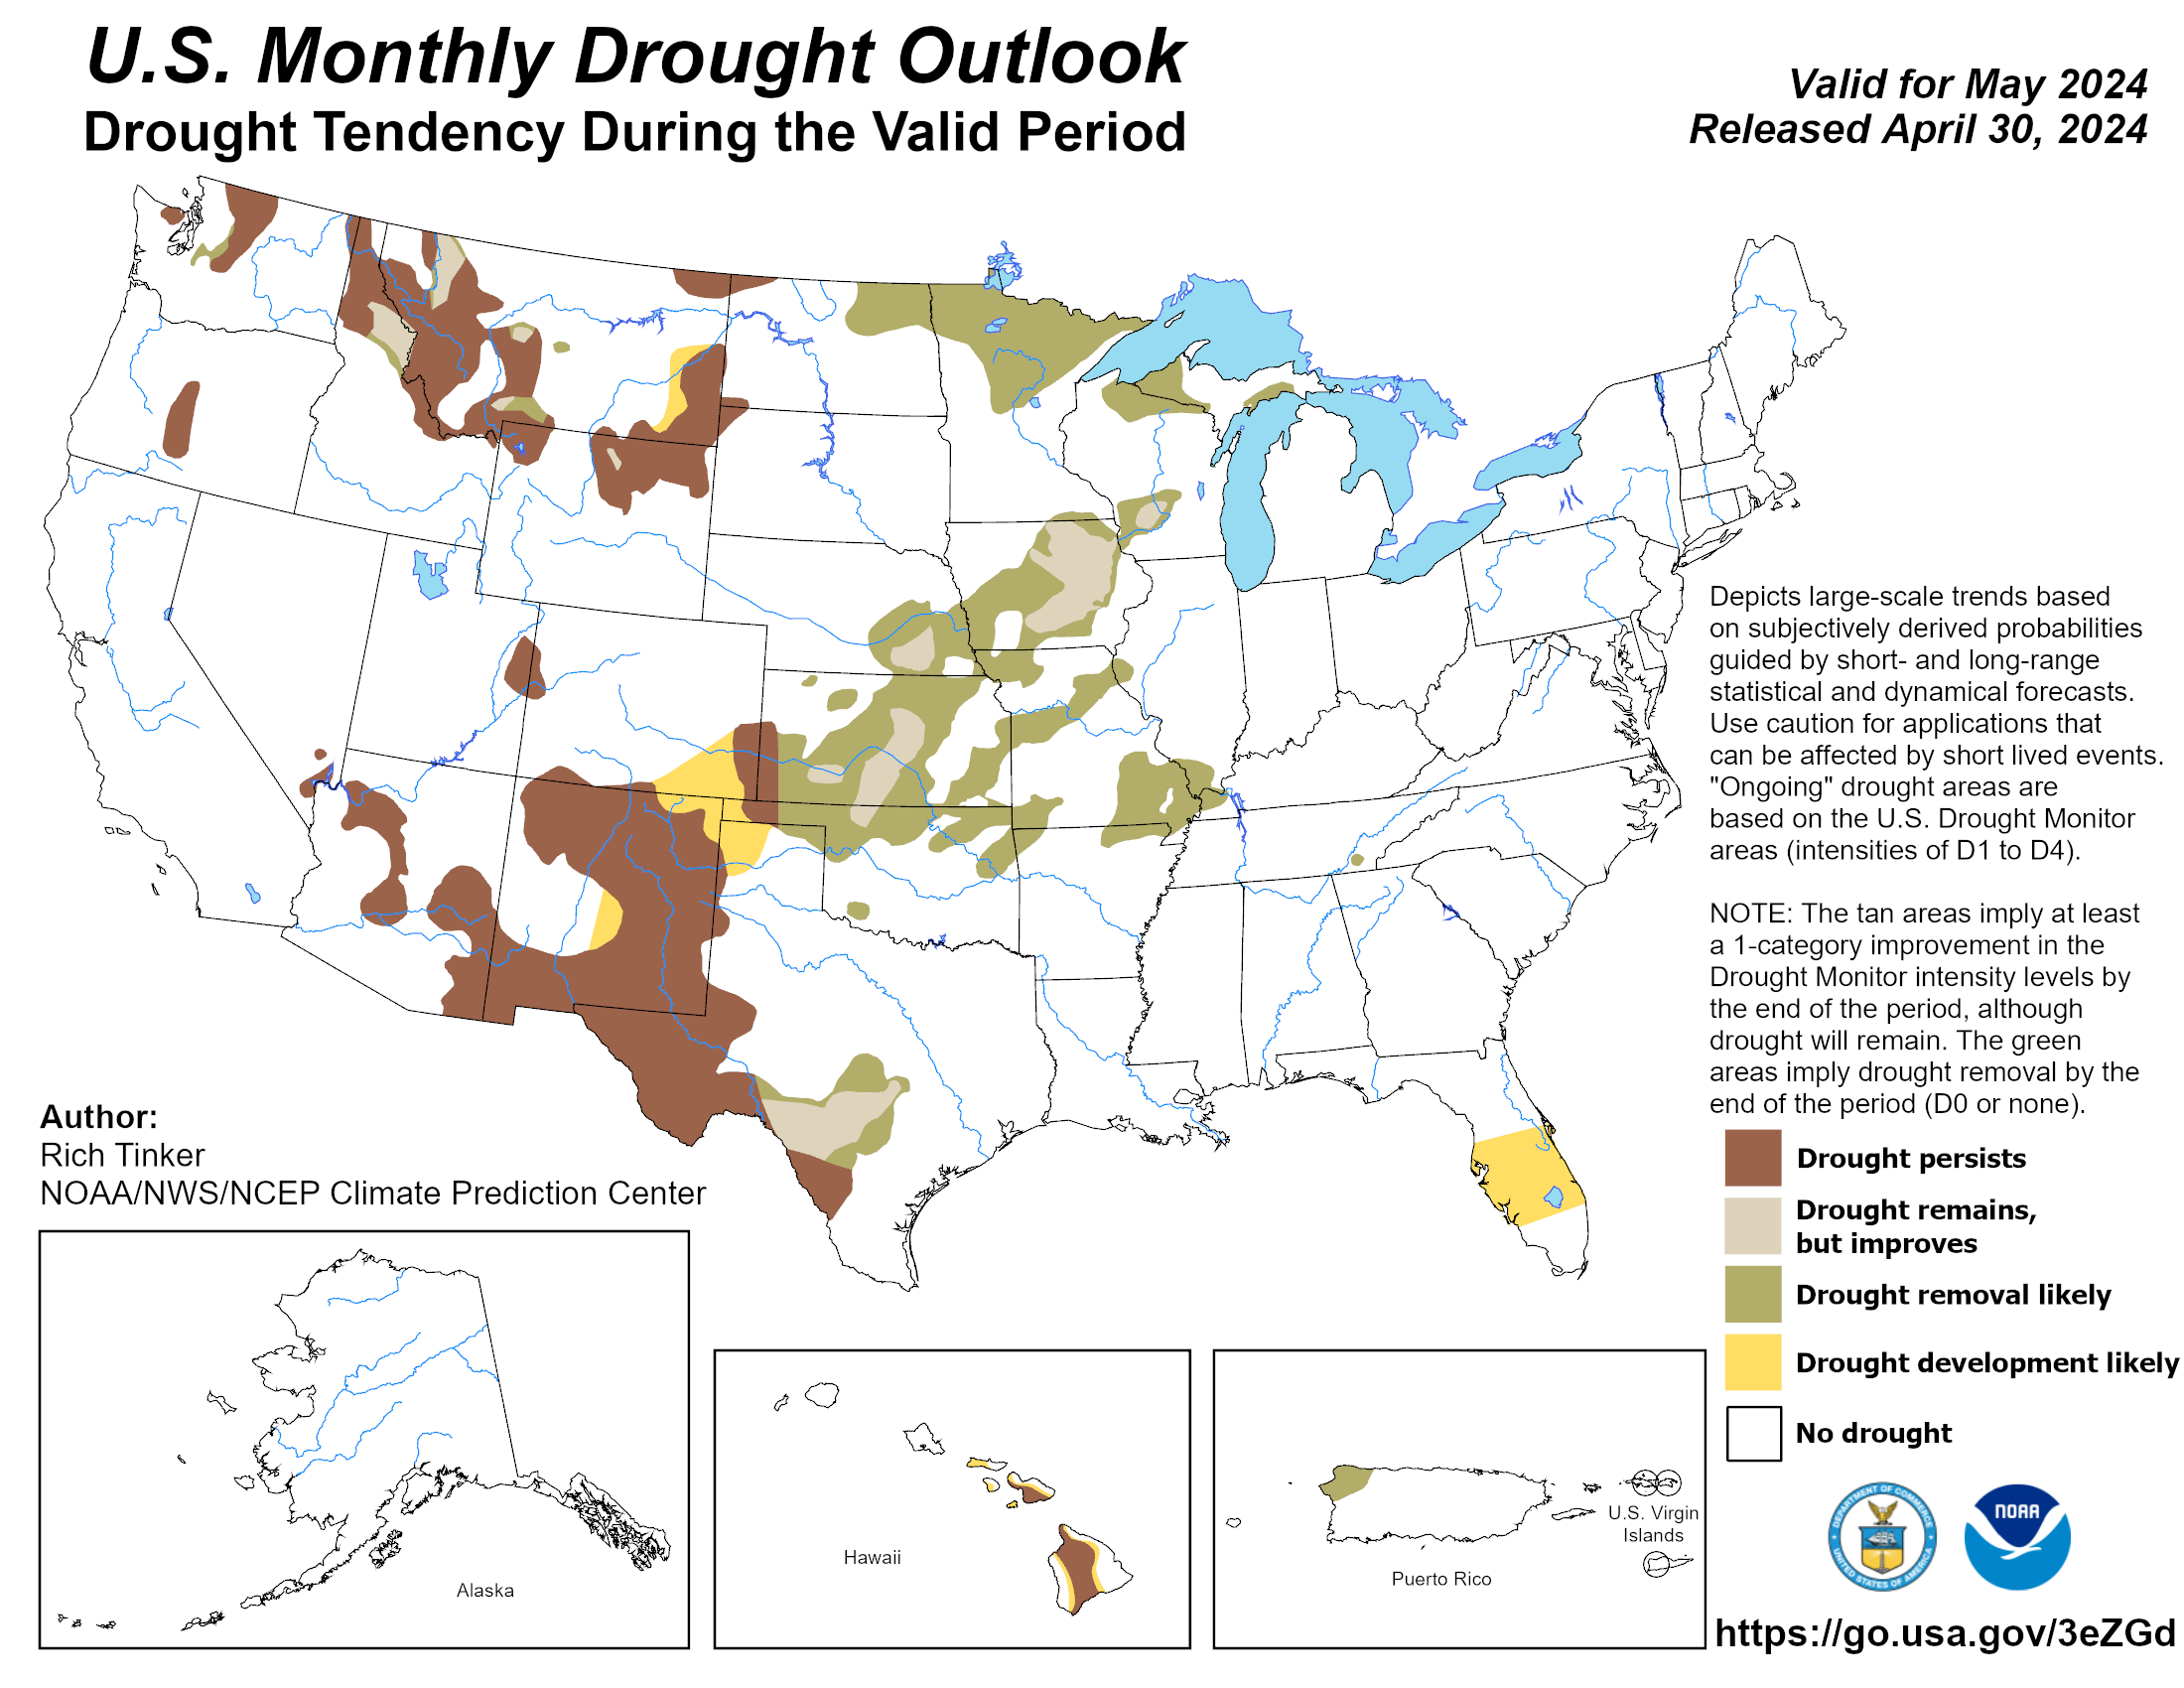
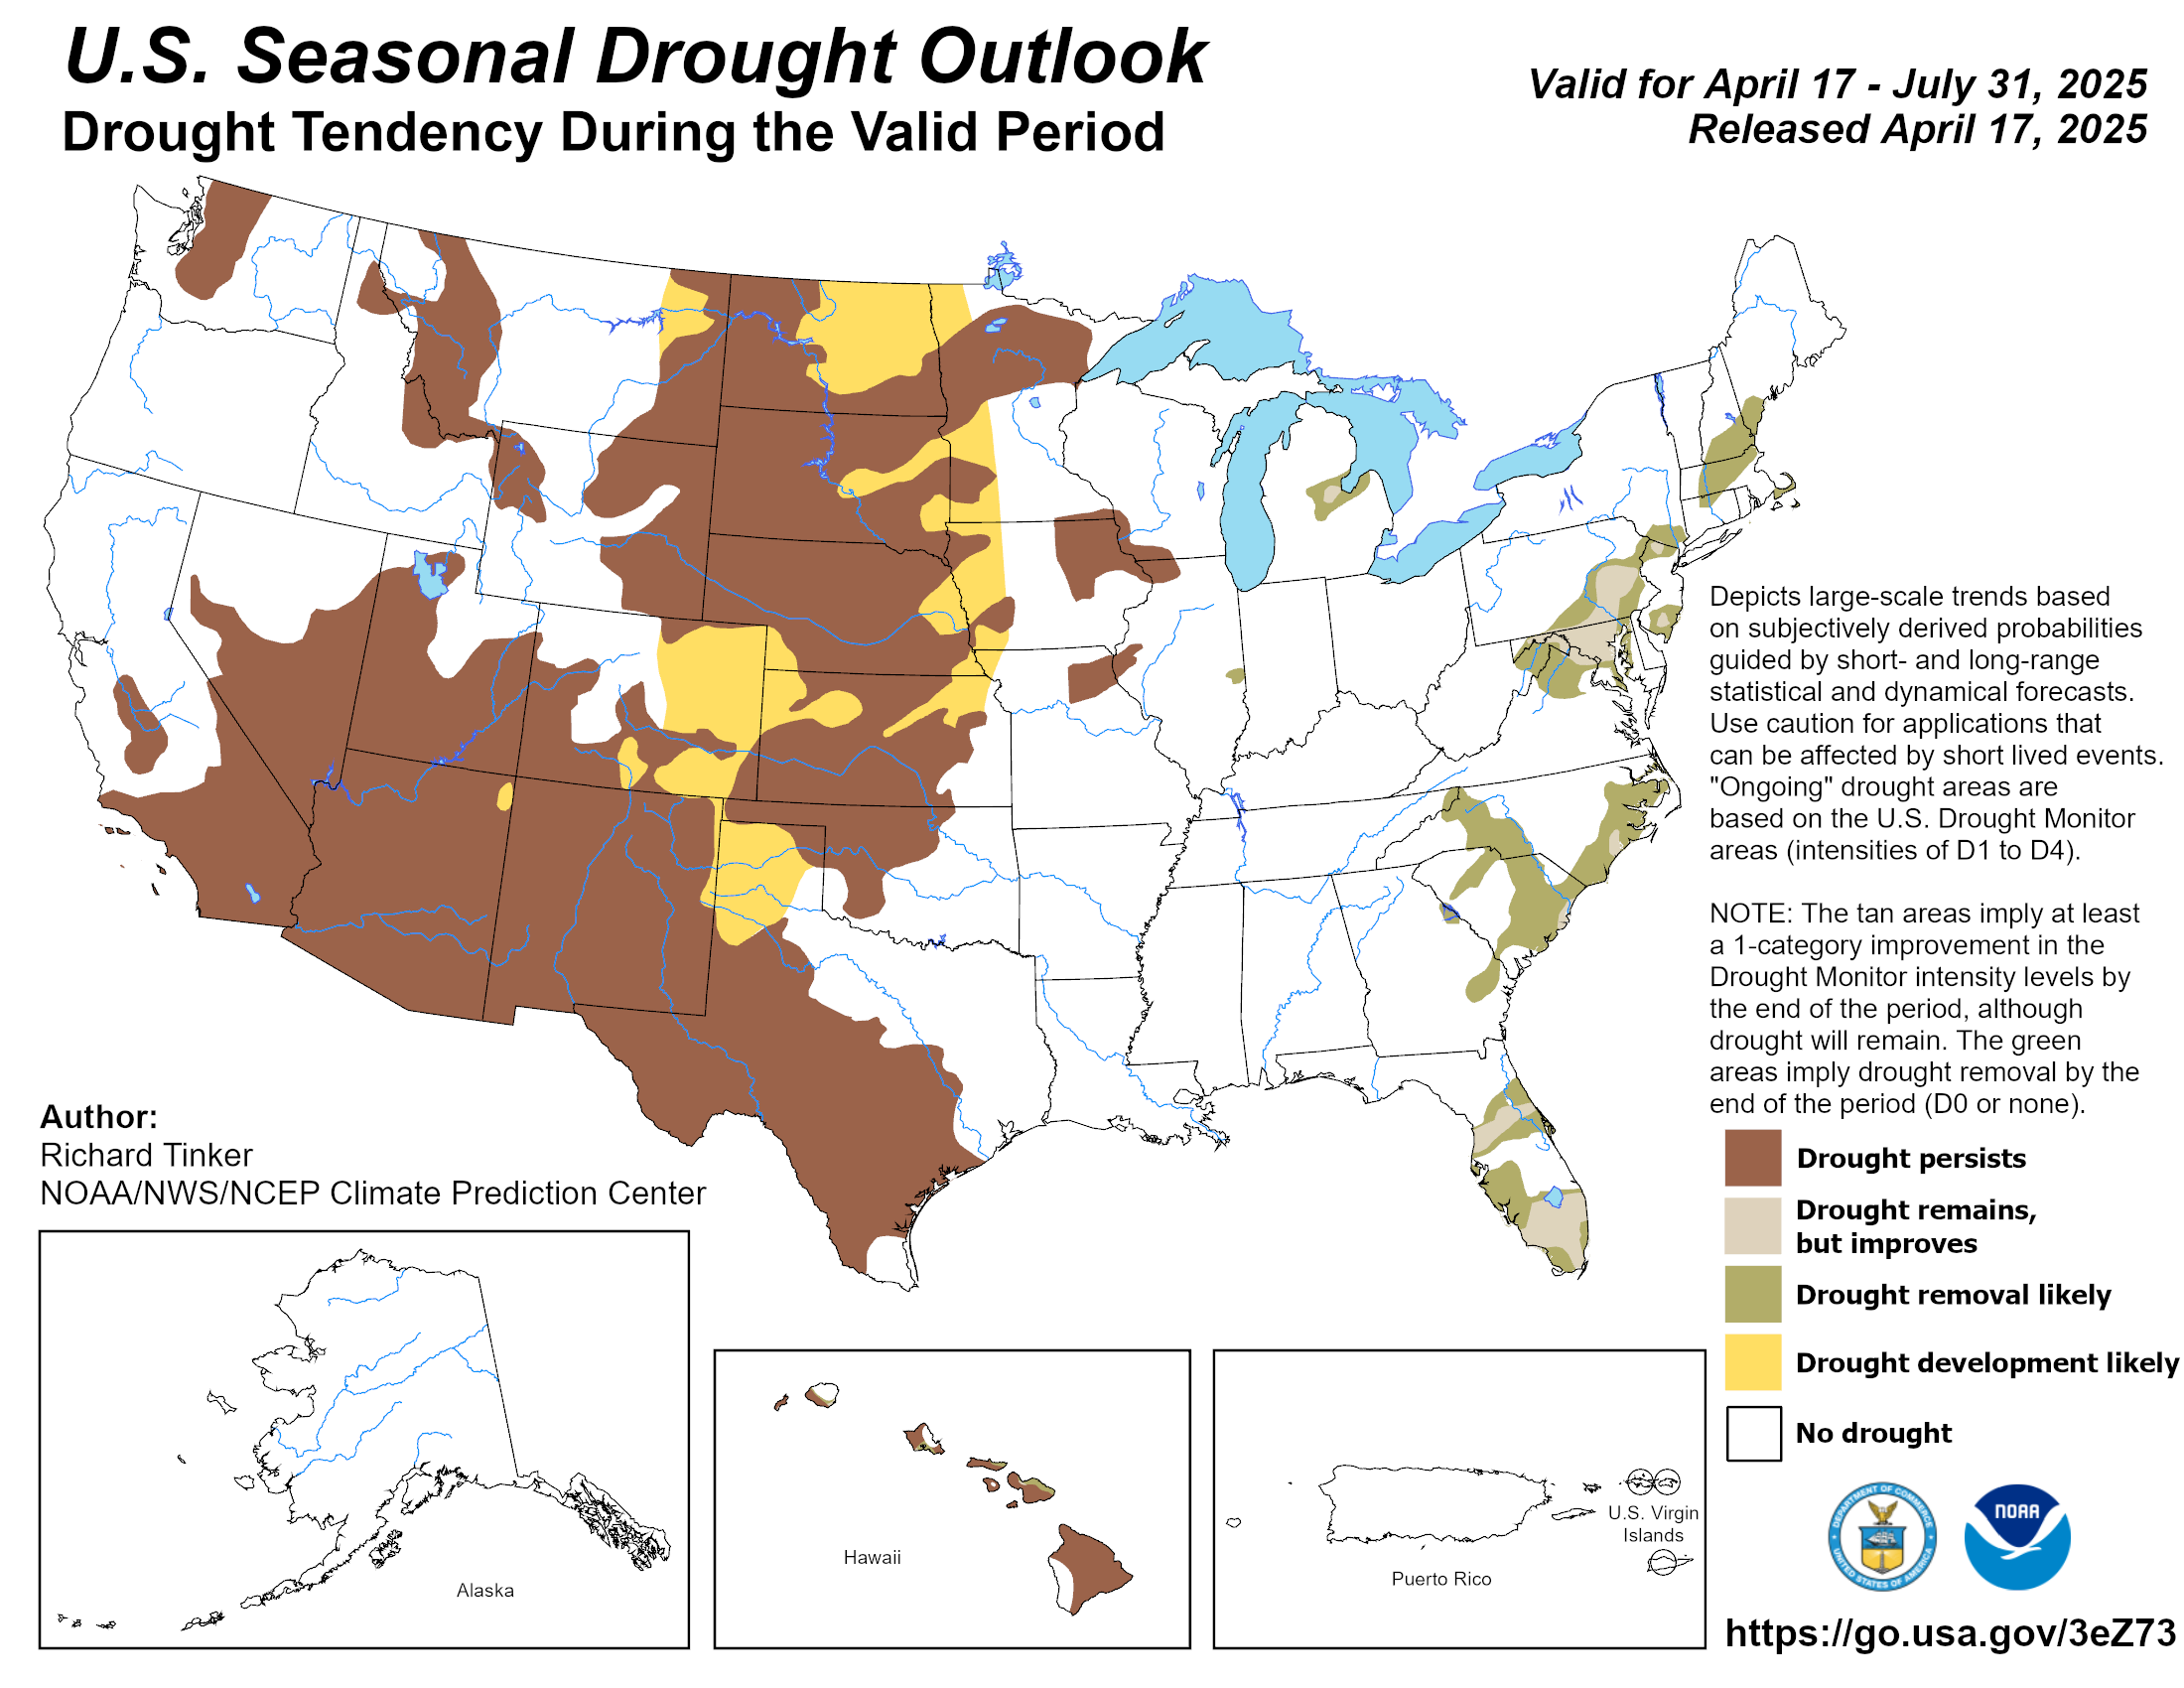
| CPC Drought Outlooks | |
| Monthly | Seasonal |
 |
 |
Resources
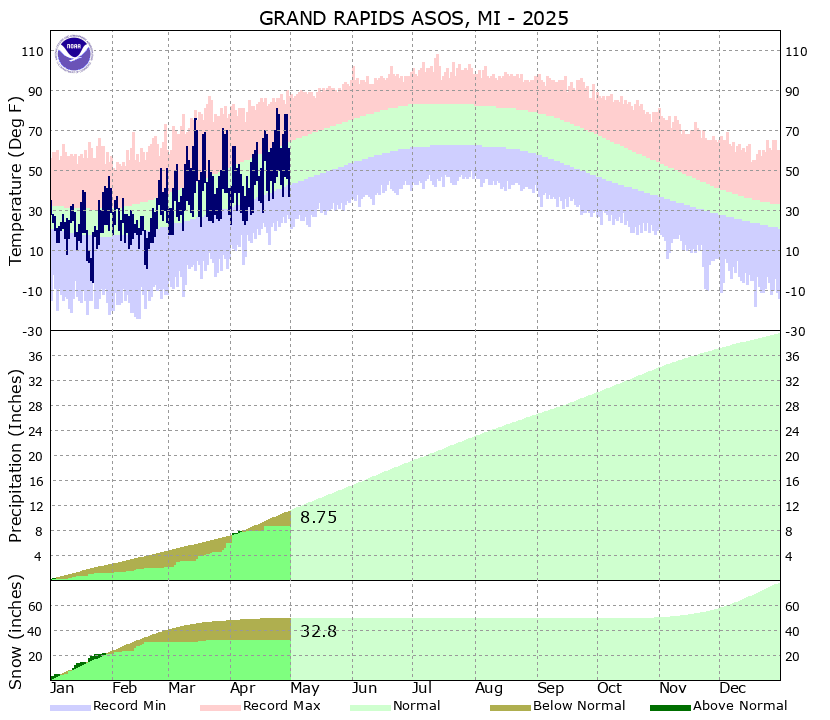
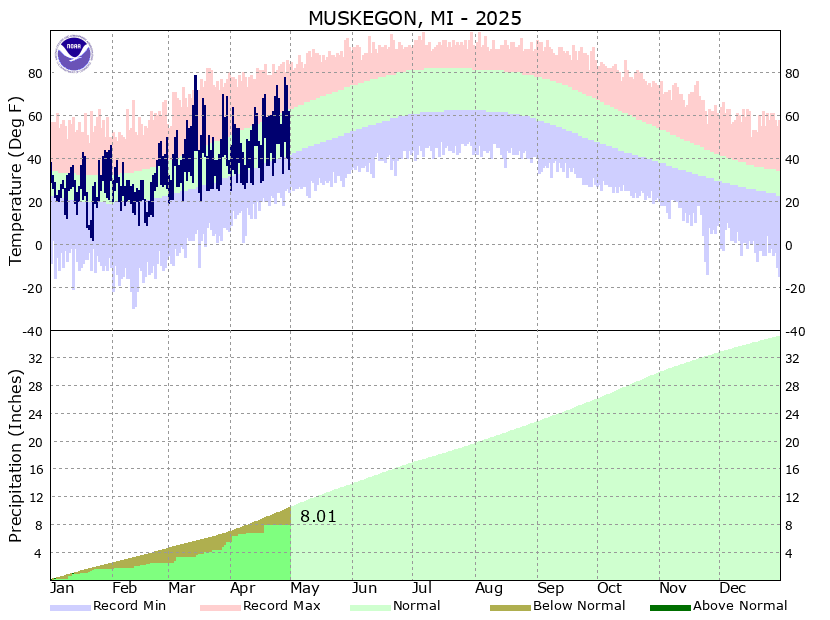
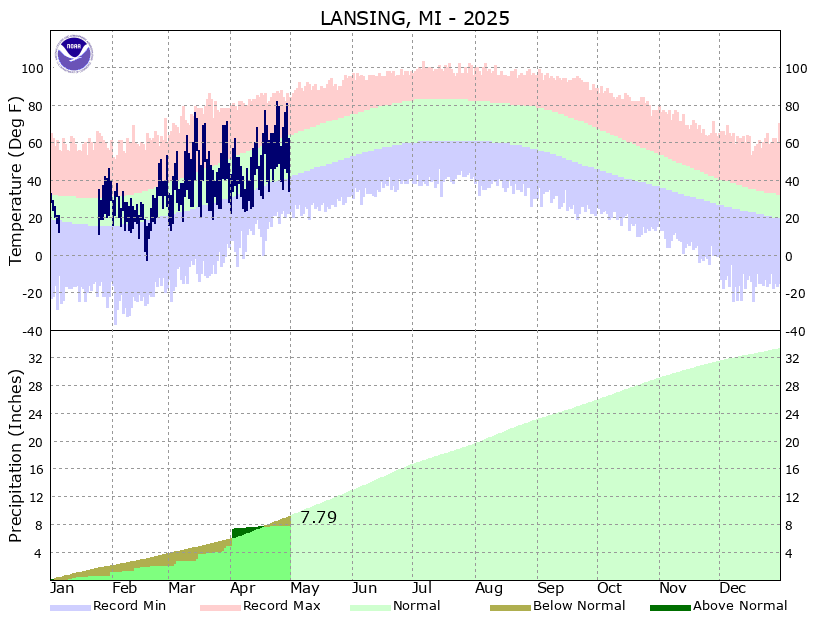
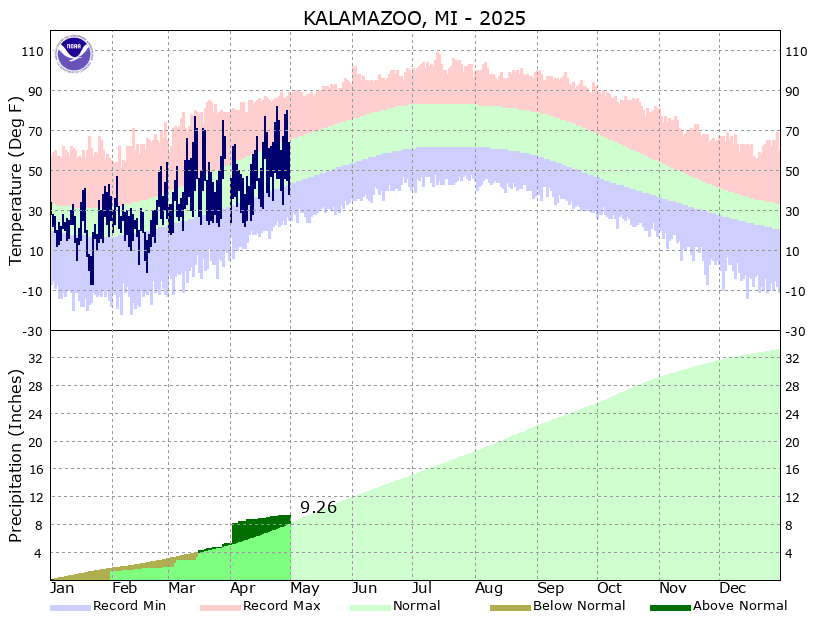
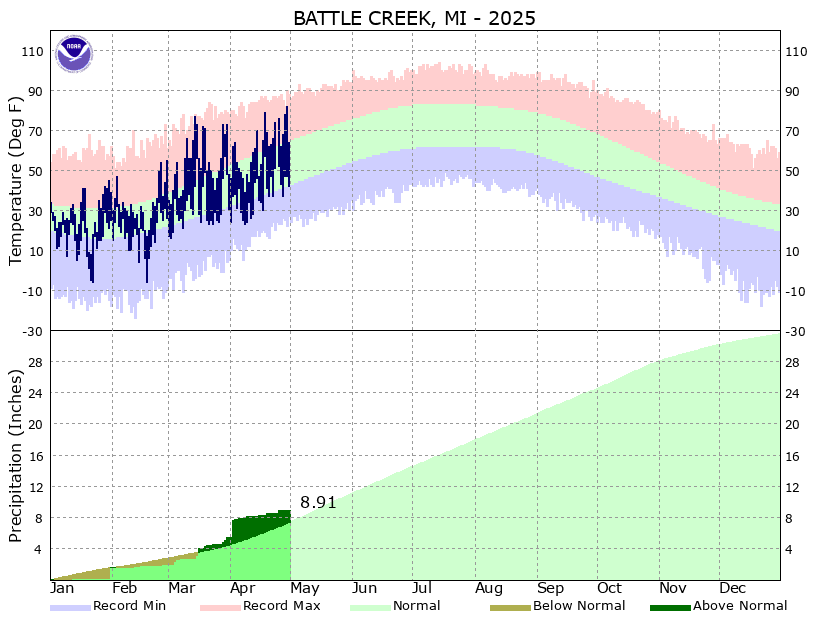
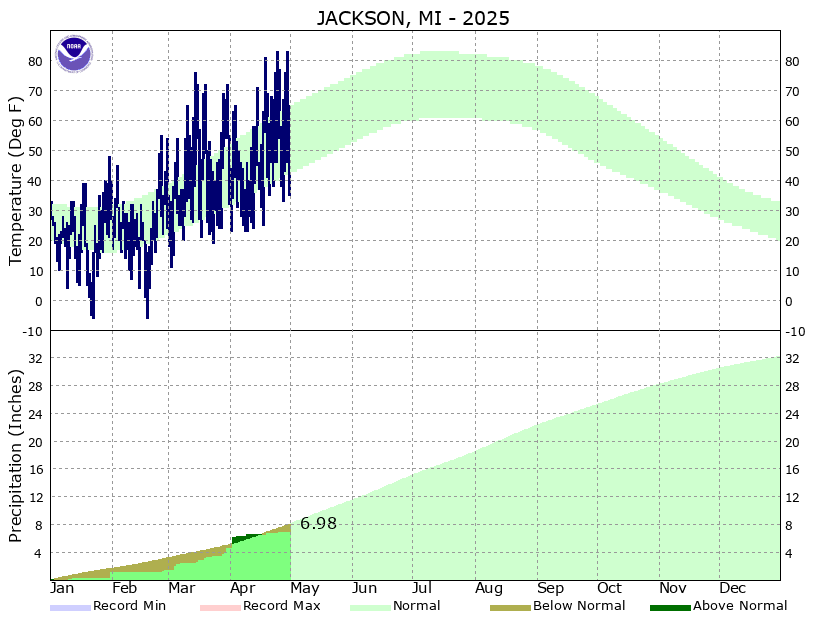
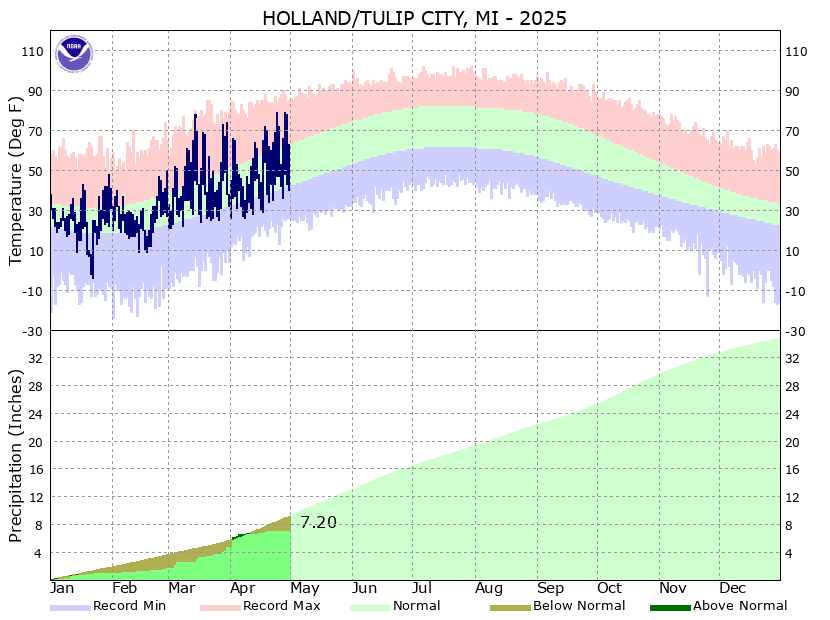
Climate Stats
|
||||||||||||||||||||||||||||
Resources
Acknowledgements
Images courtesy of...
  |
 |
 |
| NOAA/NWS | Midwestern Regional Climate Center |
High Plains Regional Climate Center |
 |
 |
 |
| US Geological Survey | National Drought Mitigation Center |
MI Department of Natural Resources |