
Severe thunderstorms capable of large hail and damaging wind gusts appear possible over the central and southern High Plains and eastern Kansas into Missouri Friday afternoon and evening. Rounds of storms Friday ahead of a slow moving frontal boundary will bring locally heavy rainfall and scattered flash flooding potential to the Mid-Mississippi, Ohio, and Tennessee Valleys, and the Appalachians. Read More >
The early morning hours of Sunday, May 31, 1998, brought one of the most memorable storm events to Michigan. A derecho -- a long-lived line of intense, fast-moving thunderstorms producing widespread destructive winds -- tore through much of the Great Lakes region. The storm complex started in South Dakota around 7 PM CDT May 30, and by 11 AM EDT May 31 it reached upstate New York. The storm crossed the Lower Peninsula of Michigan between 4:45 AM and 8 AM, killing 4 people and injuring 146.
"Ping-pong" animation of radar base reflectivity mosaic. Begins at 8 PM EDT Saturday, May 30, and ends at 7:15 AM EDT Sunday, May 31, 1998. Animation from the Storm Prediction Center's summary of this event.
"Straight-line" winds from the storm were commonly in the range of 60 to 90 mph, though winds were estimated as high as 130 mph in a few locations in southern Wisconsin and western Lower Michigan. Several tornadoes developed within this storm complex, including a violent tornado in Spencer, South Dakota. In Michigan, 5 tornadoes were officially discovered embedded in the larger pattern of downburst winds. Most of the tornadoes occurred in northern Lower Michigan on the north end of the storm line. These tornadoes were rather short-lived and developed along the chaotic interface between the thunderstorm outflow "gust front" and the warm & unstable pre-storm air mass. More common, and just as intense, was the west-to-east moving wall of wind that traversed Lower Michigan at an average speed of 70 mph.
Related reading: Introduction to Derechos, from NWS JetStream Online School for Weather.
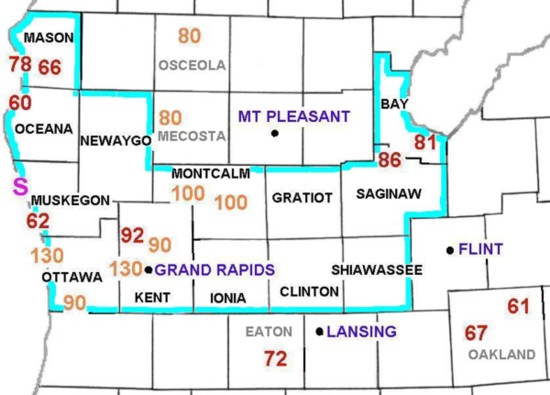
Area of Lower Michigan affected by the worst damage from the May 30-31, 1998 derecho. Red numbers are maximum measured wind gusts in mph. Orange numbers are estimated maximum gusts in mph, based on a damage survey by Grand Rapids NWS Forecast Office meteorologists. Thirteen Michigan counties (noted in black lettering and within light blue border) together were declared a Federal Disaster Area by the Federal Emergency Managers Association. The purple "S" represents where a "seiche" took place on the eastern shore of Lake Michigan. Image and caption from the Storm Prediction Center's summary of this event.
Storms that produce strong winds from rain-cooled downdrafts are fairly common in Michigan, and occur more frequently than storms that produce tornadoes. In a downdraft, rain-cooled air from within the storm cloud descends and accelerates toward the ground, eventually hitting the ground and fanning out as a swath of relatively "straight-line" wind flowing out from the storm. This wind is known as a downburst or microburst depending on the size of the area affected. Tornadoes, roughly put, are the opposite process, involving warm air near the ground spiraling inward and upward into a storm's updraft. Tornadoes and strong downdraft-based winds can occur in close proximity, as was the case in the Grand Rapids area on August 20, 2016. However, no matter whether the air is spiraling inward and upward, or free-falling down and fanning out, both tornadoes and straight-line winds can topple large trees and damage or destroy buildings, and can be deadly to people caught without adequate shelter.
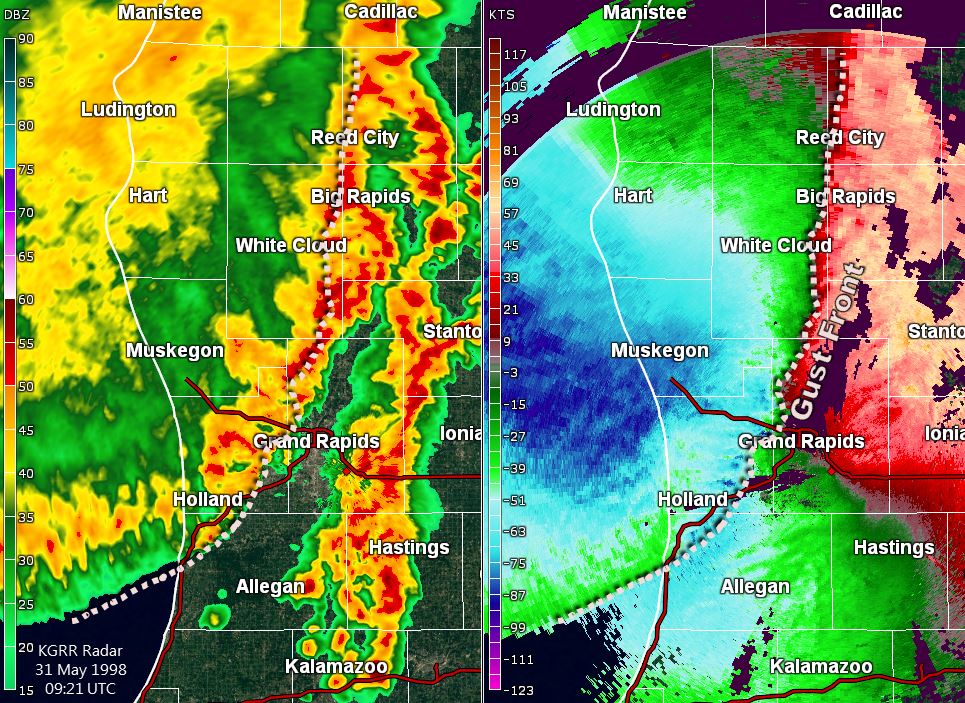
The images below are recently re-analyzed depictions of archived radar data from the National Weather Service in Grand Rapids, Michigan, collected the morning of May 31, 1998. On the left half of the images are radar reflectivity, which shows rain intensity. On the right half is radial velocity, which shows the component of wind speed moving toward or away from the radar. In the radial velocity image, green to blue colors are winds moving toward the radar, and red to orange colors are winds moving away from the radar. Dark purple colors in the velocity image are data that could not be accurately gathered due to range-folding.
Related reading: Introduction to Doppler Radar, from NWS JetStream Online School for Weather.
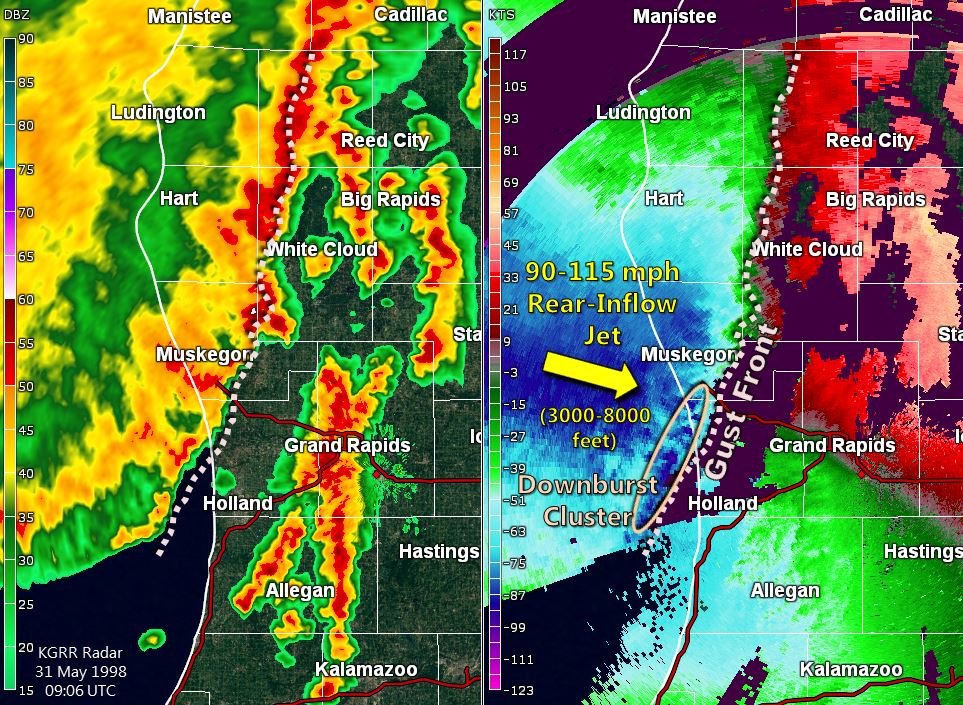
Above: Radar image from 5:06 AM EDT May 31, 1998. The leading edge of the destructive thunderstorm winds are indicated by the dashed white line labeled "Gust Front." The farther the radar beam travels from the origin site in Grand Rapids, the higher above ground the radar beam scans. An intense rear-inflow jet behind the storm line between 3000 and 8000 feet above the ground had winds sampled between 90 and 115 mph. These winds behind the storm line stayed above ground, but closer to the front edge of the storm line, some of that wind momentum was channeled down toward the ground. A close-up of the circled "downburst cluster" area is shown in the image below.
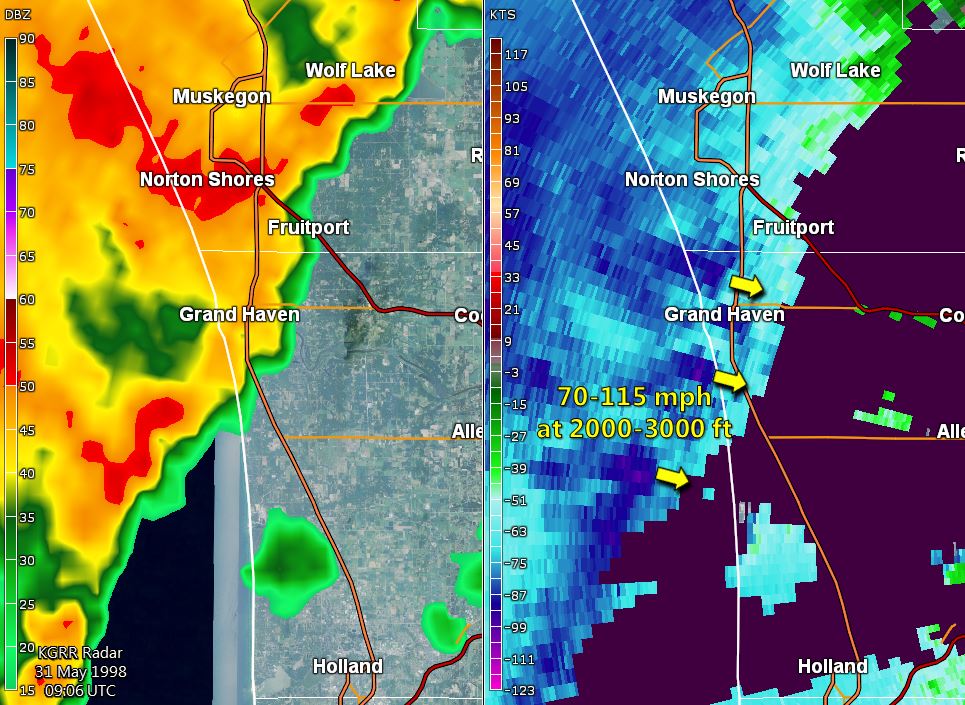
Above: Radar image from 5:06 AM EDT May 31, 1998. Winds sampled over Grand Haven area were in the range of 70 to 115 mph at 2000 to 3000 feet above the ground. These pockets of strong winds were indeed reaching the ground. Winds estimated as strong as 130 mph in Spring Lake, just east of Grand Haven, destroyed buildings.
Above: Radar image from 5:21 AM EDT May 31, 1998. The leading edge of the destructive thunderstorm winds are indicated by the dashed white line labeled "Gust Front." A close-up of the storm as it was west of Grand Rapids is shown in the image below.
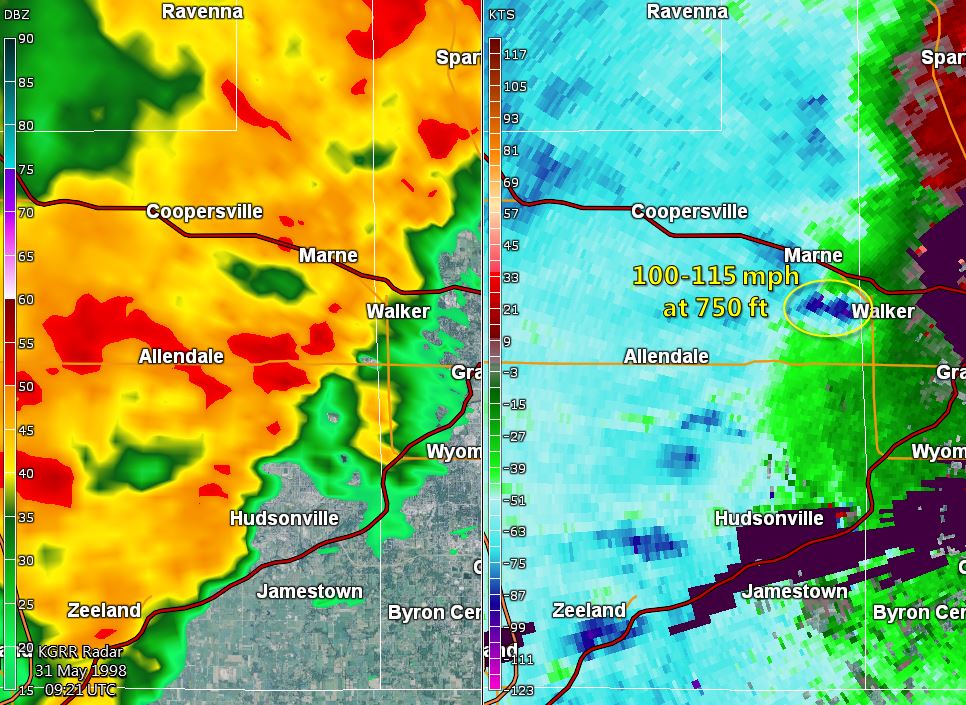
Above: Radar image from 5:21 AM EDT May 31, 1998. Particularly hard-hit by this storm was the city of Walker. The radar velocity data shows winds between 100 and 115 mph just 750 feet above the ground. The scattered pockets of stronger winds embedded within the line shows how some communities were hit by 90-110 mph winds while others were hit by "only" 60-70 mph winds.
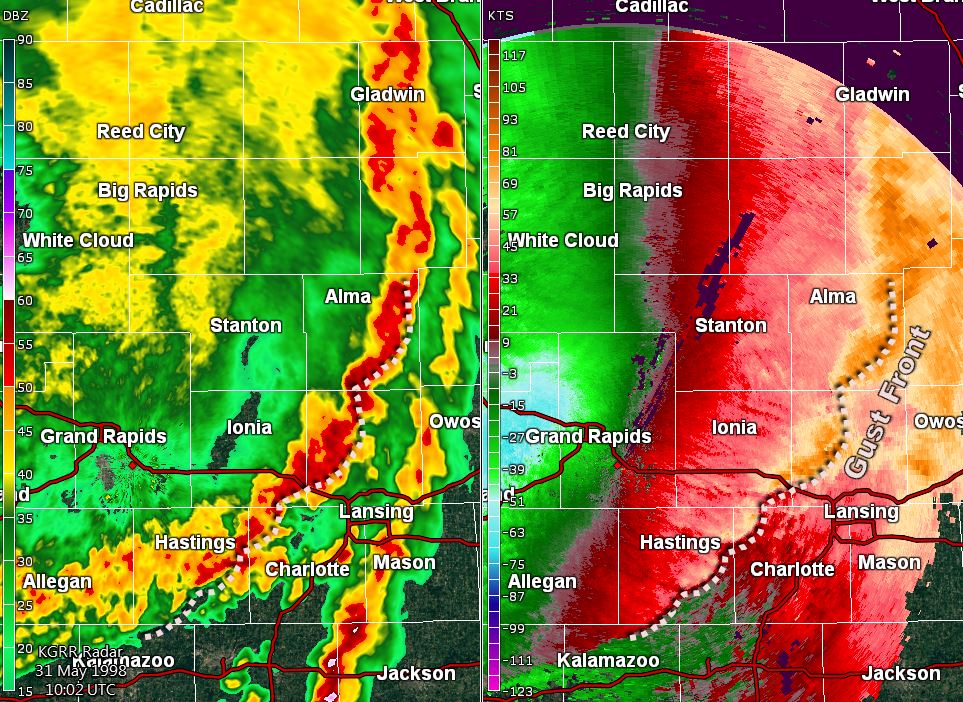
Above: Radar image from 6:02 AM EDT May 31, 1998. The leading edge of the destructive thunderstorm winds are indicated by the dashed white line labeled "Gust Front." 60-90 mph winds were occurring at this point in the storm's life. There is a wavy pattern of embedded "bowing segments" within the larger storm line.
The storm line traveled from Muskegon to St. Johns in 60 minutes, and it traveled from Grand Haven to Ionia in 40 minutes. This section of the storm as it crossed West Michigan was therefore moving at an astounding 80 mph.

